CJES
Caspian Journal of Environmental Sciences ©Copyright by The University of Guilan, Printed in I.R. Iran[Research]
Study of Physical and Chemical Soil Properties Variations
Using Principal Component Analysis Method in the Forest,
North of Iran
Ali Salehi1* and G. Zahedi Amiri2
1- Department of Forestry, Natural Resources Faculty, University of Guilan, P.O. Box 1144, Somesara, Iran. 2- Department of Forestry, Natural Resources Faculty, University of Tehran, Karadj, Iran.
* Corresponding Author’s Email: [email protected]
ABSTRACT
The field study was conducted in one district of Educational-Experimental forest at Tehran University (Kheirood-Kenar forest) in the North of Iran. Eighty-five soil profiles were dug in the site of study and several chemical and physical soil properties were considered. These factors included: soil pH, soil texture, bulk density, organic carbon, total nitrogen, extractable phosphorus and depth of soil. Principal Component Analysis (PCA), was used to identify the variations of soil properties. Results showed that there are significant relationships between some soil factors and two PCA axes. Content of clay in A1 and A2 horizons, bulk density, organic carbon and total nitrogen in A1 horizon, and content of silt in A2 horizon, correlated to the first PCA axis. Content of clay, pH, carbon percentage and silt content of B1 Horizon, and soil depth, were the most important factors correlated to the second PCA axis. Soil profiles that consist high content of clay, with heavy soil texture, and soil profiles with high content of silt, occupied different areas in the forest. The content of total nitrogen and organic carbon also varied noticeably amongst the soil profiles. The variations of soil properties showed correlation with the distribution of trees and variations of altitude.
Key words: chemical and physical soil properties, Multivariate analysis methods, Principal Component Analysis (PCA), Forest of North of Iran..
INTRODUCTION Hans Jenny presented his thesis about soil forming factors in 1941 (Gerrard, 1981) and notified five factors that create soil with di-fferent properties, including parent material, climatic factors, topographic conditions, biotic factors and time. Occurrence of soils with different properties in various places indicates that different factors affect their formation. Variation of soil properties in complex conditions can be very high, there-fore being expected in complex ecosystems such as forests, and particularly mountain forests. The majority of forests in North of Iran located in mountain areas and topo-graphic conditions, such as elevation, slope, aspect and micro topography which these influence forest types and soil properties. It Educational Experimental forest of
Kheiroo Kenar was transferred to Tehran University in 1966 by forestry organization for education and research approaches (Asly and Etter, 1969). According to education and research subjects, several researches and projects related to forest science and other fields, such as forest soil science, have been done in this forest. The main subject of the majority of soil researches was related to the classification of forest soil (Salehi, 2004). Habibi (1984) classified the soils of the studied site based on the French classification system. whereas, Sarmadian and Jafari (2001) classified them according to the soil taxonomy system.
Online version is available on www.cjes.net
was reported that the variation of soil properties is related to landscape and topographic conditions (Makarov et al., 1997).
Based on complex topographic conditions of the forests in North of Iran, the variations of soil factors in this area should be high (Salehi, 2004). Since variations of soil pro-perties are high and soil characteristics relate to several variables, multivariate analysis should be more useful than other univariate statistic methods. Multivariate analysis methods assume that several random vari-ables have inter relation between each other and that they are important for the researcher (Moghadam, 2000). Classification and ordina-tion are two main branches of multivariate analysis and in this study as ordination methods was used. In general, ordination is the ordering of objects along axes according to their resemblance (McCune, 1997). The major objective is to achieve an effective data reduction, expressing many dimensional relationships in a small number of dimen-sions. One of the most famous ordination methods is principal component analysis.
Principal component analysis (PCA) is the basic eigen-analysis technique. It was first introduced by Pearson and used in ecology by Goodall (1954). This method was gradually introduced as an applied multivariate analysis method in ecology after 1966, and it is one widespread method to ordinate data in ecology (Pourbabaei, 2004). Although using this method for ordination of floristic data meets some limitations (Mesdaghi, 2000), results of PCA on site data collected with floristic data can be valuable (Goldsmith, 1973).
In this study we used PCA as valuable method to: i) define the most significant and important soil properties; ii) evaluate how those soil variables varied among soil profiles in the study site; iii) evaluate inter-relationships among soil properties; iv) describe relations between variations of soil properties and other factors.
MATERIALS AND METHODS
Study Site location and description
The study site is the Kheirood-Kenar forest (51º 32’ N, 36º 27’ W) of the Caspian in Northern Iran. The Kheirood-Kenar forest is used for education and research by Tehran University and is close to Noshahr City in Mazandaran province.
This forest is divided to eight districts and this research was conducted in one of the districts called Nam-Khaneh. The area of the study site is about 1000 ha. The highest mean monthly temperatures of 29oC occur in June
and July, the lowest of 7.1oC occur in
February, and the mean annual rainfall is 1354.5 mm at the Noushahr meteorological station, which is 10 km far from study area. The temperature and rain-fall data were obtained from a 38 years data collection.
The study site is a mountain forest with an altitudinal range from about 650 to 1400m .Although some parts in the study site are underlined by sandstone, limestone forms the parent material across most of the site. According to the soil survey taxonomy, the majority of soils in the study site are classified in Inceptisoils and Alfisoils orders.
Soil Sampling and Analysis
In order to select sites for soil sampling, maps of landforms and forest types were used. The forest was stratified into about 300 landform units based on differences in altitude, slope and aspect. Four forest types identified by sampling tree plots were also considered. In individual landform units, each tree plot was compared with its two nearest neighbor tree plots regarding their species compositions and using the Sorenson index. If the Sorenson index was over 75%, similari-ty and the two plots fell within the same landform unit as defined above, one of the two plots was chosen at random for soil sampling. If two plots showed a Sorenson index less than 75% similarity or they fell within different landform units, they were both selected for soil sampling. In this way, from the original 325 tree plots, 85 sample plots were selected for soil profile.
Salehi and Zahedi 133
carbon by Walkely and Black method and extractable phosphorus by Olson method.
Sampling for Determination of Forest Types
The data for determination of forest types were obtained from 325 sampling tree plots. On each plot, the trees with more than 7.5- cm diameter at breast height (1.3 m above the ground level) were measured and identified. Slope, elevation and aspect were recorded for each plot using a clinometer, altimeter and compass respectively.
Statistical Analysis
Soil variables for all 85-soil profiles form one matrix for PCA. Because variables of some soil profiles were very different from variables of the others, seven profiles were removed as outlier’s profiles (Kent and Coker, 1996), and therefore 78 profiles were considered for the analyses. As the results of PCA can be less robust if the number of variables is large compared to the number of samples, only 23 variables of the 32 available were selected for PCA. In fact, the variables omitted in this way showed high correlation to each other. For example in this research, pH was determined by two methods, with H2O and in KCl, but only one of them was
used in the analysis. The soil variables considered were: soil depth, pH, percentage of clay, silt content and bulk density, for all
horizons of the soil; organic carbon, total nitrogen, C to N ratio (C/N), and extractable phosphorus, only for upper soil horizons (A1 and A2 horizons), because of the insignificant content of these soil properties in subsoil. Basal area for each tree species in all of the sampling tree plots and the total basal area for all of the trees species within each plot were calculated. Two-way indicator species analysis method (TWINSPAN) was used for classification of tree groups to determine forest types (Hill, 1976).
For above mentioned multivariate analysis “PC– ORD“ Program version 3.17 was used. Comparing of means of some soil properties amongst forest types, and also study of inter-relationships between these variables was done by One Way ANOVA (Analyses Of Variance) method. Minitab program version 13.1 was used for ANOVA.
RESULTS
Distribution of Soil Profiles and Soil Chara-cteristics in the Plane Determined by PCA axes
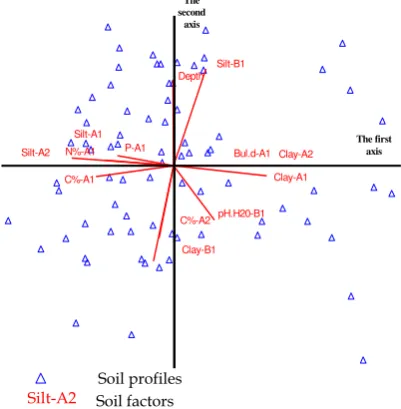
Distribution of soil profiles and soil characteristics in relation to the two first PCA axes are shown in Figure 1. The eigenvalues and the proportion of variance explained by the axes are listed in Table 1. The proportion of the variance is simply the eigenvalue for that axis divided by the total variance, i.e. the sum of the diagonal of the cross-products matrix. As it is shown in Fig 1, soil profiles, and soil characteristics, occupied different regions of the diagram. according to the Pearson and Kendal correlation coefficients among soil variables, and between them and main axes of PCA. The correlation structure is used to position objects in the ordination space, and objects close in the ordination space are generally more similar than objects Silt-B1
Depth
Table 1. Percentage of variance and eigenvalues of PCA axes
Axes
Eigenvalue Percentage of Variance
1
Figure 1. Distribution of soil factors and soil profiles in the plane defined by the two first
distant in the ordination space (McCune, 1997). As shown in Table 1 the first axis of PCA is the most important to explain variance across the variables (soil factors). The percentage of "eigenvalue" for the first axis and second axis of PCA are about 25% and 16% respectively.
As mentioned before, the location of soil profiles and soil factors in different regions of PCA axes is on the basis of correlation coefficients between variables, therefore the location of the variables in the diagram is significant and important. For example, soil profiles that occupied a specific region and are close to each other have several similar characteristics between each other, and consequently the correlation co-efficient between those characteristics should be high. On the other hand, the characteris-tics of soil profiles occupying opposite places in the diagram, for example opposite direc-tion of an axis, show distinct variations.
Eigenvectors and correlation coefficients between soil variables and the PCA axes
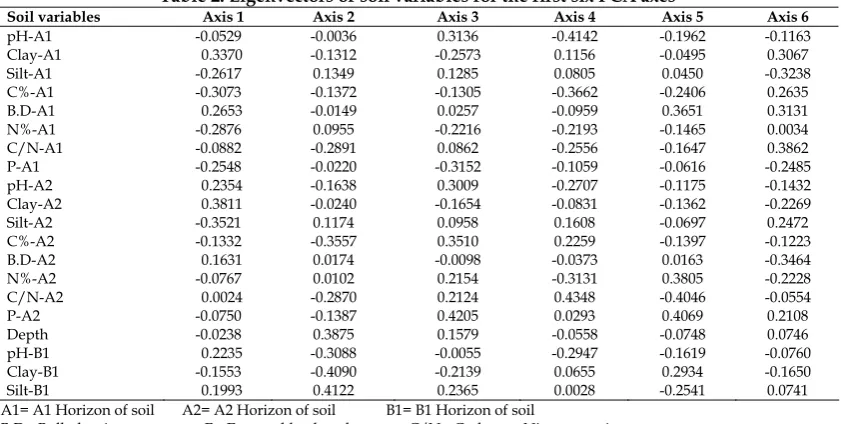
The values of the eigenvector for soil variables and the axes of PCA are shown in Table 2. Eigenvectors contain set of scores that show the weight of each variable (soil variables) on each axis of PCA. Eigenvectors vary between -1 to +1 and if the value of the eigenvector for a specific variable is close to absolute of 1, it is more important to weight
on the axes (Mesdaghi, 2000). As shown in Table 2, the eigenvectors for content of clay in A1 and A2 horizons, content of silt in A2 horizon, and percentage of organic carbon and nitrogen in A1 horizon for the first axis, and the values of percentage of organic carbon in A2 horizon, pH, clay and silt in B1 horizon, and soil depth for second axis, are higher compared to the eigenvectors of other variables. The last mentioned subject showed that these variables play a more important role to explain the first and second axes of variation.
Table 2. Eigenvectors of soil variables for the first six PCA axes
Soil variables Axis 1 Axis 2 Axis 3 Axis 4 Axis 5 Axis 6
pH-A1 -0.0529 -0.0036 0.3136 -0.4142 -0.1962 -0.1163 Clay-A1 0.3370 -0.1312 -0.2573 0.1156 -0.0495 0.3067 Silt-A1 -0.2617 0.1349 0.1285 0.0805 0.0450 -0.3238 C%-A1 -0.3073 -0.1372 -0.1305 -0.3662 -0.2406 0.2635
B.D-A1 0.2653 -0.0149 0.0257 -0.0959 0.3651 0.3131
N%-A1 -0.2876 0.0955 -0.2216 -0.2193 -0.1465 0.0034 C/N-A1 -0.0882 -0.2891 0.0862 -0.2556 -0.1647 0.3862 P-A1 -0.2548 -0.0220 -0.3152 -0.1059 -0.0616 -0.2485
pH-A2 0.2354 -0.1638 0.3009 -0.2707 -0.1175 -0.1432
Clay-A2 0.3811 -0.0240 -0.1654 -0.0831 -0.1362 -0.2269 Silt-A2 -0.3521 0.1174 0.0958 0.1608 -0.0697 0.2472 C%-A2 -0.1332 -0.3557 0.3510 0.2259 -0.1397 -0.1223
B.D-A2 0.1631 0.0174 -0.0098 -0.0373 0.0163 -0.3464
N%-A2 -0.0767 0.0102 0.2154 -0.3131 0.3805 -0.2228
C/N-A2 0.0024 -0.2870 0.2124 0.4348 -0.4046 -0.0554
P-A2 -0.0750 -0.1387 0.4205 0.0293 0.4069 0.2108
Depth -0.0238 0.3875 0.1579 -0.0558 -0.0748 0.0746
pH-B1 0.2235 -0.3088 -0.0055 -0.2947 -0.1619 -0.0760 Clay-B1 -0.1553 -0.4090 -0.2139 0.0655 0.2934 -0.1650
Silt-B1 0.1993 0.4122 0.2365 0.0028 -0.2541 0.0741
A1= A1 Horizon of soil A2= A2 Horizon of soil B1= B1 Horizon of soil
B.D= Bulk density P= Extractable phosphorus C/N= Carbon to Nitrogen ratio
Salehi and Zahedi 135
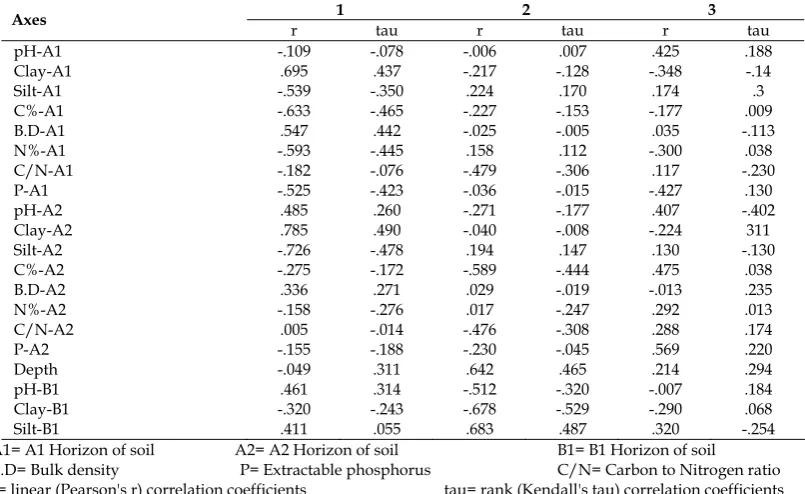
C. In relation to the second axis of PCA, it is negatively correlated to the content of clay in B1 horizon, and positively correla-ted to silt content of B1 horizon and depth of soil (Table 3).
Forest types, relationships between them and soil properties
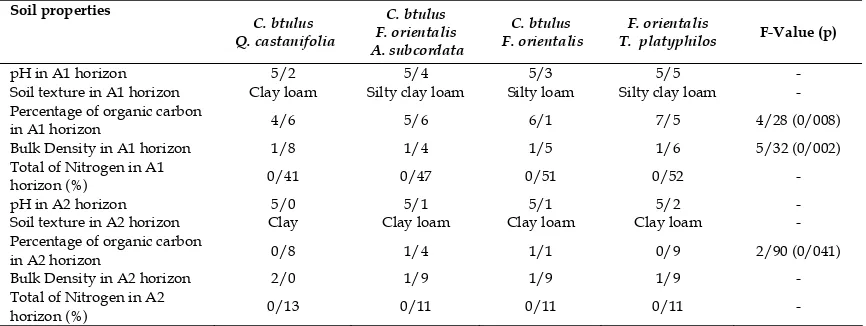
The results of TWINSPAN method determined four main tree groups. We used these groups as forest types to study relationships between them and soil propert-ies. Relationships between some important soil properties and forest types have been displayed in Table 4.
DISCUSSION
Forests, as complex ecosystems, usually have ranges of soils with varying properties. Some of these soil properties are more important than the others and play an obvious role to distinguish the soils covering specific regions. Understanding of the segregated factors among several different soil properties is useful for forest management. In this research, using of multivariate analysis obviously set apart differences of soil properties among soil profiles. As the first axis of PCA explain
more proportion of variance, the results showed that the texture, total nitrogen and organic carbon of the soil, especially in surface layers, are significant and important properties of soil that vary along yhe soil profiles. According to the results, soil profiles positioned to the right direction of the first PCA axis consist high content of clay (heavy soils) and high bulk density, and correspond to areas in the forest with soil profiles different from those profiles placed in the left direction of that first axis, which is accordant to low content of clay and high content of silt (light soils). Soil texture is the most fundamental soil physical property controlling water, nutrient and oxygen exchange and uptake (Schoenholtz et al., 2000), and influences the growth and distribution of trees (Fisher and Binkley, 2000).
Table 3. Pearson and Kendall correlations between soil variables and PCA axes
1 2 3 Axes
r tau r tau r tau
.007 .188
pH-A1 -.109 -.078 -.006 .425
Relationships between forest types besides detected variations of the soil properties, demonstrated that in the areas with heavy soils, the main forest type includes Carpinus
betulus, Quercus castanifolia type. Habibi
(1992) reported that Carpinus betulus desire heavy soils, such as clay and silty clay soils and Gorji Bahri (1988) believed that Quercus
castanifolia wish for heavy soils. On the other
Clay-A1 .695 .437 -.217 -.128 -.348 -.14
.3
Silt-A1 -.539 -.350 .224 .170 .174
-.153 .009
C%-A1 -.633 -.465 -.227 -.177
B.D-A1 .547 .442 -.025 -.005 .035 -.113
N%-A1 -.593 -.445 .158 .112 -.300 .038
-.306 -.230
C/N-A1 -.182 -.076 -.479 .117
-.015 .130
P-A1 -.525 -.423 -.036 -.427
pH-A2 .485 .260 -.271 -.177 .407 -.402
Clay-A2 .785 .490 -.040 -.008 -.224 311
Silt-A2 -.726 -.478 .194 .147 .130 -.130
C%-A2 -.275 -.172 -.589 -.444 .475 .038
B.D-A2 .336 .271 .029 -.019 -.013 .235
N%-A2 -.158 -.276 .017 -.247 .292 .013
C/N-A2 .005 -.014 -.476 -.308 .288 .174
P-A2 -.155 -.188 -.230 -.045 .569 .220
Depth -.049 .311 .642 .465 .214 .294
pH-B1 .461 .314 -.512 -.320 -.007 .184
Clay-B1 -.320 -.243 -.678 -.529 -.290 .068
Silt-B1 .411 .055 .683 .487 .320 -.254
A1= A1 Horizon of soil A2= A2 Horizon of soil B1= B1 Horizon of soil
hand, Fagus orientalis and Fagus orientalis -
Carpinus betulus types distributed on the light
texture soils, where the content of silt should be high compared to the content of clay. Habibi (1974) reported that both Fagus
orientalis and Fagus sylvatica do not require
heavy soils and prefer light soils.
Other considerable soil properties that varied among the soil profiles were the total nitrogen and the percentage of organic carbon. Inter-relationships illustrated by PCA showed that the amounts of these factors increase in profiles having high silt amount or lighter soil texture, which correspond to the soil profiles located in the left side of the first axis of PCA. On the basis of the position of each profile in the forest, the field results demonstrated that these soil variables increase along with increases in altitude and dominance of Fagus orientalis in the forest. It was clear that variations of these factors in the soil are affected by the altitude-induced climatic differences. Basically, climatic conditions, especially temperature and rainfall, can influence the accumulation of nitrogen and organic matters found in soil and the rate of decomposition of the organic matters (Brady and Weil, 1999), as well as the percentage of organic carbon in the soil depends on the decomposition of organic materials. Lorphelin and Kichi (1987) reported that, as the altitude increases, the activity of organisms and decomposition of organic matter decrease. On the other hand, although several environmental factors affect the rate of litter decomposition, the rate of litter fall is remarkably uniform among tree
species growing under similar soil and climatic conditions (Fisher and Binkley, 2000). Finzi et al (1998) showed that there were differences in the size and distribution of C and N pools at varying soil depths beneath six different tree species in temperate forests. Edwards et al., (1970) reported that the decomposition rate of beech leaves is lower than oak, elm, birch and ash leaves. Comparison of leaf decomposition rates among different plant species revealed that litter of Carpinus betulus was decomposed more rapidly than Fagus
orientalis (Cornelissen, 1996), so that the
presence of beech in this study may explain the augment of the content of nitrogen and carbon in higher altitudes.
Table 4. Mean of some soil properties and comparing of them amongst forest types
Soil properties C. btulus
C. btulus F. orientalis C. btulus F. orientalis
F-Value (p)
Q. castanifolia F. orientalis T. platyphilos A. subcordata
pH in A1 horizon 5/2 5/4 5/3 5/5 -
Soil texture in A1 horizon Clay loam Silty clay loam Silty loam Silty clay loam - Percentage of organic carbon
in A1 horizon 4/6 5/6 6/1 7/5 4/28 (0/008)
Bulk Density in A1 horizon 1/8 1/4 1/5 1/6 5/32 (0/002) Total of Nitrogen in A1
horizon (%) 0/41 0/47 0/51 0/52 -
pH in A2 horizon 5/0 5/1 5/1 5/2 -
Soil texture in A2 horizon Clay Clay loam Clay loam Clay loam - Percentage of organic carbon
in A2 horizon 0/8 1/4 1/1 0/9 2/90 (0/041)
Bulk Density in A2 horizon 2/0 1/9 1/9 1/9 - Total of Nitrogen in A2
horizon (%) 0/13 0/11 0/11 0/11 -
In this study, PCA showed noticeable variations of soil properties in the study site. We also described some relationships between soil properties and a few environ-mental factors, but it seems that the other analyses methods can be practical to show these relationships.
ACKNOWLEDGMENTS
The present investigation was conducted with support of Tehran University. The authors would also like to thank Dr. David Burslem and Dr. Michel Swaine from Aberdeen University, Aberdeen, Scotland.
REFERENCES
Salehi and Zahedi 137
Brady, N. C and Weil, R. R. (1990) The nature and properties of soil (Tenth edition0 macmilan publishing company, 621 pp. Cornelissen, J. H. C, (1996) An experimental
comparison of leaf decomposition rates in a wide range of temperate plant species and types. J. Ecol.,4, pp 573- 582.
Edwards, C. A., D. E. Reichk and A. Crossley, (1970) The role of soil invertebrates in turnover of organic matter and nutrients. Springer- Verlog, New York: pp 147- 172. Finzi, A. C. , Breemen, N. V., Canham, C. D.
(1998) canopy tree-soil intraction whitin temperature forests: speices effects on carbon and nitrogen, Ecological application,
8, 440- 446
Fisher, R. F and Binkley, D, (2000) Ecology and Management of Forest Soils (Third edition), John Wiley & sons, INC, 489 pp. Gerrard, A. J, (1981) Soils and landforms.
George Allen & Unwin Ltd, 219 pp.
Goldsmith, F. B. (1973) The vegetation of exposed sea cliffs at South Stack, Angle-sey. Ι. The multivariate approach. J. Ecol.,
61, 787- 818.
Goodall, D. W. (1954) Objective methods for the classification of vegetation. III. An essay in the use of factor analysis.
Australian J. of Botany, 2, 304- 324.
Gorji Bahri, Y, (1988) Quantitative and qualitative evaluation of Quercus/
Carpinus stands in Kheyrood-kenar forest,
Msc thesis, Tehran University press, 47 pp. Habibi, H, (1974) Investigation of influence of soil texture on Beech trees’ growth rate in Iran. Journal of Iranian Natural Resources,
31, 61- 69.
Habibi, H. (1984) Study of the soils in beech forests of Iran and their role in distribution of different beech type. Journal of Iranian Natural Resources, 38, 1- 15.
Habibi, H, (1992) Investigation of Hornbeam’s forest soils in Mazandaran province and its roles in quality of forest stands. Journal of Iranian Natural Resources,
38, 17-25.
Hill, M. O., Bunce, R. G. H., Shaw, M. W., (1976) Indicator species analysis, a divisive polythetic method of classification and its
application to a survey of native pine woods in Scotland. J. Ecol. 63, 597-613. Kent, M and Coker, P (1996) Vegetation
Description and Analysis, A Practical Approaches. John Wiley & sons, 650 pp. Lorphelin, L. and kichi, P. (1987) the soil of
the typical slope in the Himalayas (Nepal); their main characteristics and distribution.
Catena, 146, 533- 550
Makarov, M. I., Malysheva, T. I., Haumaier, L., Alt, H.G and Zech, W., (1997) The forms of phosphorus in Humic and Fulvic acids of a toposequence of alpine soils in the northern Caucasus. Geoderma, 80, 61-73.
McCune, B. (1997) Influence of noisy enviro-nmental data on canonical correspondence analysis. Ecology,78, 2617- 2623.
Mesdaghi, M, (2000) Vegetation description and analysis: a practical approach. Jehad Daneshgahi of Mashhad, Mashhad, pp 161- 179.
Moghadam, M. R, (2000) Quantitative Plant Ecology. Tehran University, Tehran, pp 233- 279.
Pourbabaei, H, (2004) Statistical Ecology. Guilan University, pp 293- 319.
Salehi, A. (2004) Investigation of physical and chemical soil properties variations in relation to trees composition and topographic factors in Nam-Khaneh district of educational-Experimental forest of Tehran University (Kheirood-Kenar forest). Thesis for PhD degree, Tehran University, Tehran. 187 pp.
Sarmadian, F and Jafari, M (2001) Investigation of forest soil in Educational-Experimental forest of Tehran University. Journal of Iranian Natural Resources, Special Issue, 111pp.
Schoenholtz, S. H, Van Miegroet, H, Burger, J. A (2000) A review of chemical and physical properties as indicators of forest soil quality: challenges and opportunities.
Forest ecology and management, 138, 335-356.