Other uses, including reproduction and distribution, or selling or
licensing copies, or posting to personal, institutional or third party
websites are prohibited.
In most cases authors are permitted to post their version of the
article (e.g. in Word or Tex form) to their personal website or
institutional repository. Authors requiring further information
regarding Elsevier’s archiving and manuscript policies are
encouraged to visit:
Analysis of the impact of the forest fires in August 2007 on air quality
of Athens using multi-sensor aerosol remote sensing data,
meteorology and surface observations
Yang Liu
c,*, Ralph A. Kahn
a, Archontoula Chaloulakou
b, Petros Koutrakis
caNASA Goddard Space Flight Center, Greenbelt, MD 20771, USA
bNational Technical University of Athens, Department of Chemical Engineering, Heroon Polytechniou 9, GR-15780 Zografos, Athens, Greece cDepartment of Environmental and Health, Harvard University, School of Public Health, Boston, MA 02215, USA
a r t i c l e
i n f o
Data from multiple satellite remote sensors are integrated with ground measurements and meteoro-logical data to study the impact of Greek forest fires in August 2007 on the air quality in Athens. Two pollution episodes were identified by ground PM10measurements between August 23 and September 4.
In the first episode, Evia and Peloponnese fires contributed substantially to the air pollution levels in Athens. In the second episode, transport of industrial pollution from Italy and Western Europe as well as forest fires in Albania contributed substantially to the air pollution levels in Athens. Local air pollution sources also contributed to the observed particle levels during these episodes. Satellite data provide valuable insights into the spatial distribution of particle concentrations, thus they can be used identify pollution sources. In spite of a few weaknesses in current satellite data products identified in this analysis, combining satellite aerosol remote sensing data with trajectory models and ground measure-ments is a powerful tool to study intensive particle pollution events such as forest fires.
Ó2009 Elsevier Ltd. All rights reserved.
1. Introduction
From late August to early September 2007, Greece suffered the worst forest fires in the past 50 years. A total of 2700 square kilo-meters of forest, olive groves and farmland were destroyed by the fires, and 84 people, including firefighters, lost their lives. In addi-tion to the direct fire damage, these devastating fires produced large quantities of gaseous air pollutants and particles (PM10and
PM2.5, airborne particles smaller than 10
mm and 2.5
mm in size,
respectively) dispersed over the region. Athens, the capital of Greece with a population of over four million inhabitants, was affected by both the Peloponnese and Evia fires. In addition to causing deterioration of air quality, fire smoke has adverse health effects on exposed populations, such as increased respiratory diseases, asthma, bronchitis, and eye irritation (Kunzli et al., 2006; Naeher et al., 2007). Exposure severity depends upon wind direc-tion, fire intensity, and precipitadirec-tion, and forest fire emissions can
also be mixed with those from other air pollution sources. There-fore, it is often difficult to reliably assess the spatial and temporal extent of population exposure to smoke emissions solely from ground-based air quality measurements.
Beginning in 1999, the National Aeronautics and Space Admin-istration (NASA) launched a series of Earth Observing System (EOS) satellite sensors, including the Multiangle Imaging SpectroRadi-ometer (MISR) (Diner et al., 2002) and the Moderate Resolution Imaging Spectroradiometer (MODIS) (Salomonson et al., 1989). Both sensors can measure aerosol abundance and size over both land and water with nearly global coverage at moderate spatial resolutions. In addition, MISR is able to provide information on aerosol type and plume top heights (Kahn et al., 2008). Particle information retrieved by satellite sensors may be suitable for monitoring the spatial and temporal trends of particle concentra-tions over large geographical areas. Dense aerosol plumes are easily observable and visualized through satellite remote sensing, making it possible to monitor their transport and transformations. The extensive spatial coverage satellite imaging offers is of particular benefit in areas with limited numbers of surface observations. Aerosol information retrieved by MISR and MODIS can provide a quantitative measure of aerosol event severity and potential air quality impact. The Ozone Monitoring Instrument (OMI), which
* Corresponding author. Present address: Department of Environmental and Occupational Health, Emory University, Rollins School of Public Health, 1518 Clifton Road NE, Atlanta, GA 30322, USA. Tel.:þ1 404 7272131; fax:þ1 404 7278744.
E-mail address:[email protected](Y. Liu).
Contents lists available atScienceDirect
Atmospheric Environment
j o u r n a l h o m e p a g e : w w w . e l s e v i e r . c o m / l o c a t e / a t m o s e n v
continues the Total Ozone Mapping Spectrometer (TOMS) measurements, was launched in 2004 aboard the EOS Aura satellite with daytime equator crossing at approximately 1:30 p.m. local time (Schoeberl et al., 2006). The OMI instrument can distinguish between aerosol types, such as smoke, dust, and sulfates, and measures cloud pressure and coverage, which provide data to derive tropospheric ozone. OMI, in conjunction with other Aura instruments, provides global mapping of several key tropospheric constituents including aerosols. Together with surface observations and meteorological information, these satellite sensors provide a better understanding of the spatial, temporal and chemical characteristics of the aerosol than can any single remote or surface-based observation. In this paper, we combine aerosol and meteo-rological measurements from multiple sources to characterize two particle pollution episodes identified by ground measurements between August 23 and September 3, 2007 in Athens. The objec-tives of this study are: (1) to assess the contribution of the Greek forest fires to particle pollution levels during these two episodes in Athens by combining satellite aerosol data, meteorological modeling, and ground measurements; and (2) to evaluate the accuracy and value of various satellite data products under these conditions.
2. Data and methods
The data used in this analysis consist of satellite images, satel-lite-retrieved aerosol optical depth and plume top heights, ground observations of particulate matter concentrations, and air mass trajectories calculated from assimilated meteorology. Each data source is described briefly below.
2.1. Ground air quality monitoring data
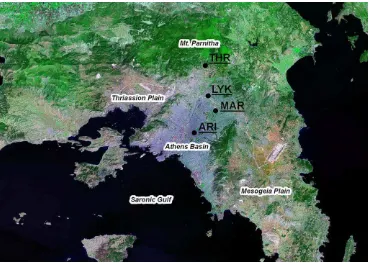
The Athens Basin is surrounded by high altitude terrain (over 1000 m asl) to the north, east, and southeast. Daily PM10
concentrations were collected at four sites (ARI, LYK, MAR, and THR) in this region (Fig. 1). A detailed description of these sites is given elsewhere (Grivas et al., 2008). Briefly, the background
station of THR is located in a remote area to the north. LYK, ARI and MAR measure suburban and urban air pollution levels. Calculations based on data of 2001–2004 show that the three sites have similar median daily PM10concentrations, with MAR being slightly cleaner
than LYK and ARI (Grivas et al., 2008). Previous research indicates that traffic emissions are the dominant air pollution source in Athens (Chaloulakou et al., 2003; Grivas et al., 2008). Since MODIS AOD represents the average particle concentration within the 1010 km2 pixel cell, it is more appropriate to compare it with regional average PM10 concentrations. Therefore, PM10
concentrations from the three traffic-affected sites were averaged, to represent urban pollution levels over existing background concentrations produced by local primary emissions.
2.2. Satellite datasets
The MODIS instruments, aboard both the EOS Terra and Aqua satellites, cross the equator on the day side at approximately 10:30 a.m. and 1:30 p.m. local time, respectively (Remer et al., 2005). MODIS red–green–blue true-color images at 250 m resolu-tion were downloaded from the MODIS Rapid Response System website (http://rapidfire.sci.gsfc.nasa.gov/subsets/). Active fire locations at 1-km resolution, derived from MODIS 4
mm radiances,
are indicated as black polygons on the images (Giglio et al., 2003). These images are a valuable resource for tracking fires, as they are generated in near-real-time over Earth’s landmasses. A dimen-sionless indicator of particle abundance, AOD is defined as the integral of aerosol extinction coefficients along the vertical atmo-spheric column from the ground to top of the atmosphere. When particle composition, vertical profiles, and atmospheric humidity are constant, AOD varies linearly with ground level particle mass loading (Liu et al., 2005). The currently operating MODIS aerosol retrieval algorithm uses its blue (440 nm), red (670 nm), and thermal infrared (2.13mm) wavelength bands to identify Dense
Dark Vegetation pixels, where it preferentially performs aerosol retrievals over land. AOD and other aerosol information are calcu-lated based on simplified assumptions about particle composition,Fig. 1.Overview of Athens and surrounding areas. Four PM10monitoring sites (black dots) are labeled.
and are reported at 10 km resolution at nadir. Since AOD values depend on wavelength, MODIS reports AOD at 550 nm wavelength (Remer et al., 2005). Although AOD values measured from the ground may range from near zero in pristine environments up to two or more in heavily polluted urban areas or dust storms (Jiang et al., 2007), an upper bound of 3.0 is set in the MODIS AOD retrieval process to minimize cloud contamination. Both Terra and Aqua MODIS AOD retrievals over land are highly correlated with ground truth (correlation coefficientsw0.9), and show little biases
(Remer et al., 2008). AOD values (MODIS parameter name: Opti-cal_Depth_Land_And_Ocean) covering eastern Italy, Greece and western Turkey were downloaded from the Goddard Space Flight Center MODIS Level 1 and Atmosphere Archive and Distribution System (http://ladsweb.nascom.nasa.gov) for this study.
OMI observes solar backscatter radiation at visible and ultravi-olet (UV) wavelengths. OMI-retrieved UV Aerosol Index (AI) is a measure of the degree to which backscattered UV radiation from an atmosphere containing aerosols differs from that of a pure molecular atmosphere. By definition, UV AI is positive (>0.2) for
absorbing aerosols, near zero (0.2) in the presence of clouds or larger non-absorbing particles, and negative (<0.2) for small non-absorbing particles (Torres et al., 2002). In addition, OMI provides simplified aerosol type information, but assumes that the column atmospheric aerosol load can be represented by one of three types of aerosols: desert dust, carbonaceous aerosols associated with biomass burning, and weakly absorbing sulfate-based aerosols. The OMI UV AI and aerosol type data at a 1324 km2nominal reso-lution at nadir were downloaded from the Goddard Earth Sciences Data and Information Services Center (http://disc.gsfc.nasa.gov/).
Through a stereo-matching technique, MISR is able to distin-guish plumes having contrast features distinct from the back-ground, and retrieves the plume top height with a vertical precision of approximately 500 m (Kahn et al., 2007). The MISR stereo height product has been used for mapping the heights of water clouds, as well as wildfire smoke plumes, volcanic effluent, and desert dust storms, regionally. Due to its relatively narrow swath (w400 km),
MISR has a sampling frequency of about a week at mid latitudes. Nevertheless, they complement aerosol layer height information from space-based lidar, which provide greater vertical precision and can retrieve even for optically very thin, featureless aerosol, but produce only one-dimensional data along the sub-spacecraft track. MISR’s plume top height data, reported at 1.1 km horizontal reso-lution, were obtained from the Langley Research Center Atmo-spheric Sciences Data Center (http://eosweb.larc.nasa.gov).
2.3. Meteorological data and HYSPLIT trajectories
Although polar-orbiting satellites can provide valuable infor-mation about the intensity and spatial impact of the forest fires, they offer only limited information about aerosol movement (Pace et al., 2005). In the current analysis, air parcel trajectories and meteorological parameters are combined with satellite measure-ments to analyze the transport of smoke plumes, as well as the influence of regional industrial pollution on the air quality in Ath-ens. The HYSPLIT (HYbrid Single-Particle Lagrangian Integrated Trajectory) Model was developed by the National Oceanic and Atmospheric Administration (NOAA)’s Air Resources Laboratory and has been used extensively in air pollution transport studies (Draxier and Hess, 1998; Koukouli et al., 2006). The Global Data Assimilation System (GDAS) model output at one-degree spatial resolution and 6-h frequency, developed by National Centers for Environmental Prediction (NCEP), is used as the meteorological input for HYSPLIT simulations. NCEP wind fields are also used directly in the analysis. The 24 to 48-h forward air parcel trajec-tories for the major fire sites of this study were initialized at 2.5 or
3 km above ground level to illustrate the transport paths of smoke plumes away from the fires. The 48-h backward air trajectories from Athens are also simulated to analyze the origin of air masses influencing the air quality of Athens.
2.4. Data processing and analysis method
The raw MODIS, OMI, and MISR data are stored in specialized Hierarchical Data Format (HDF) format for NASA’s EOS missions (HDF–EOS). Aerosol data and associated geographic coordinates for each satellite pixel centroid were all extracted using the Interactive Data Language (ITT Visual Information Solutions, Boulder, CO). Daily images and data from Terra and Aqua MODIS, OMI, and MISR, along with HYSPLIT trajectories collected during these two episodes, were organized into a Geographical Information System (GIS). A MODIS true-color image from either Terra or Aqua, chosen to maximize image quality, is used as the base layer, and all other datasets are superposed.
MODIS AOD is used to describe smoke plume spatial patterns, and to correlate with PM10concentrations measured at the surface
in Athens. All Terra and Aqua MODIS AOD values within a 30 km radius of the center of Athens were collected. Preliminary results indicate that AOD values in the mountains are often much lower, and are not correlated with, particle pollution levels in the Athens plain. As a result, these AOD values were excluded from further analysis. Preliminary analysis yielded a linear correlation coeffi-cient of 0.82 between daily average Athens urban AOD and average AOD within 100 km of Athens in the general downwind direction. The downwind AOD is on average 15% lower than the urban AOD. Hence, when no valid AOD retrievals are available due to cloud cover or thick fire plumes, AOD values from nearby Thriassion Plain, Mesogeia Plain, or downwind pixels judged from MODIS true-color images, are used to estimate the AOD in Athens whenever possible. OMI AI and aerosol type information were used to identify different aerosol air masses such as smoke plumes and industrial pollution. HYSPLIT trajectories were used to track the origins of aerosol air masses arriving at Athens, and to illustrate the pathways of forest fire smoke plumes. MISR-retrieved plume top heights were used to evaluate the accuracy of HYSPLIT-estimated smoke plume height values. For comparing the contributions of different emission sources in these fire events, we assume that the fluctuation of background PM10 concentrations represents the impacts of fire smoke and
regional pollution transport on Athens’ air quality, and the difference between urban average and background PM10 concentrations
represents the impact of local emission sources on Athens’ air quality (Charron et al., 2007; Harrison et al., 2001; Jones et al., 2008).
3. Air pollution episodes
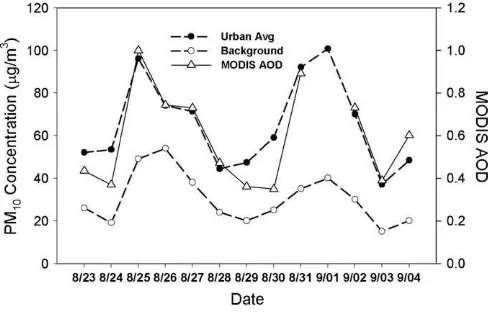
Fig. 2 shows average urban PM10 concentrations, regional
background, and MODIS AOD values between August 23 and September 4. The time series of PM10concentrations clearly
indi-cate two pollution episodes defined by average urban PM10
concentrations above the European Union Ambient Air Quality Standard for daily PM10(50
mg m
3), i.e., from August 24 to 28, andAugust 30 to September 3. During each episode, urban average PM10reached nearly 100
mg m
3. These two episodes are describedseparately in the following sections.
3.1. August 24 to August 28
From August 24 to 25, the average PM10concentration at the
three urban sites reached 96
mg m
3 and the background PM10concentration measured at THR rose to 49
mg m
3, from 19mg m
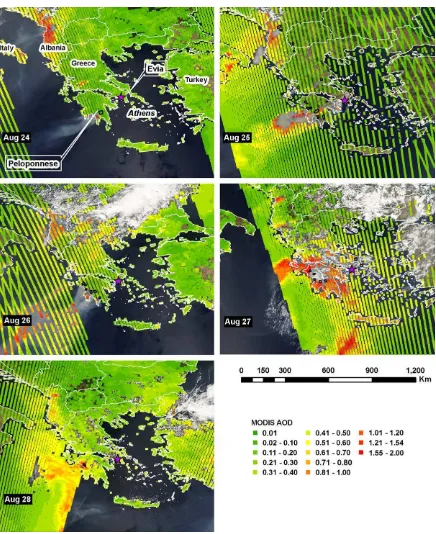
3Albania are highly visible in the August 25 MODIS true-color image (Fig. 3). The plumes are distinguished by their yellow coloration near their sources (marked as black polygons), partial transparency, and smooth texture compared with the white-gray and highly textured clouds. In addition, MODIS detected fire spots in Evia and northwest of Athens, based on 4 and 11
mm radiance anomalies
(Giglio et al., 2003), and dense smoke plumes passing over Athens on August 25. The HYSPLIT forward trajectories starting on August 25 at 1500 m above sea level indicate that during August 25 and 26, the wind direction over the Greek peninsula remained to the southwest. As a result, the Peloponnese smoke plumes were blown offshore and had no impact on air quality in Athens. However, the smoke plumes originating in Evia and northwest of Athens were blown past Athens. HYSPLIT trajectories also indicate that air parcels at 1500 m asl tend to remain near the surface along their dispersion pathways. As a result, the Evia fire is probably a major contributor to the increased background PM10 level in Athensduring this period. The spatial distribution of MODIS AOD values is displayed as colored pixels overlaid on the true-color images in all the plots ofFig. 3. It should be noted that the area represented by each MODIS pixel increases from 1010 km2at nadir to as large as 1240 km2 at the edge of each MODIS swath. This is clearly
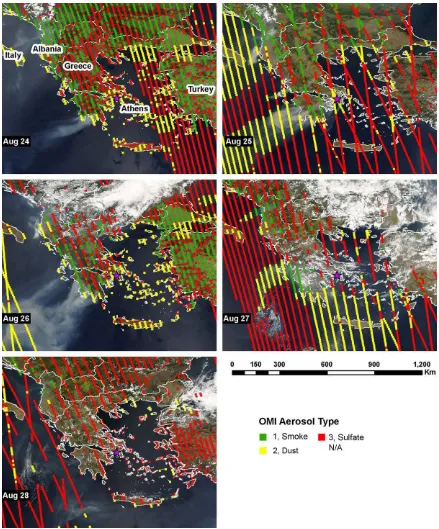
reflected by the increased spacing between columns of MODIS pixel centroids from left (close to nadir) to right (close to swath edge). Those columns of MODIS pixels at the northeastern corner of this plot that are not parallel to the rest of the pixels belong to a different MODIS orbit, passing over this region approximately 100 min apart. MISR and OMI data have similar spatial patterns as they are also aboard polar-orbiting EOS satellites although spatial sampling is much less of an issue for MISR plume heights, due to MISR’s narrower swath and camera focal lengths that vary with view angle. The clusters of the elevated AOD values clearly show the origins of the smoke plumes from Albania, Peloponnese, and Evia. Because MODIS couldn’t see through the center of the Evia thick smoke plume, the exact AOD value in Athens on August 25 is unknown. We can infer from an observation approximately 60 km downwind from Athens (AOD at 550 nm¼1.0) that the AOD value in Athens should be greater than 1.0, rising from 0.37 on August 24. MODIS AOD was generally below 0.2 north and west of Athens on August 24 and 25, suggesting that although the Albanian smoke plumes moved southward, their impact had not reached Athens. The aerosol type retrieved by OMI shows distinct differences within and outside the visible smoke plumes (Fig. 4). However, OMI clas-sified only those inland pixels over Albania and Peloponnese inside the smoke plumes as containing smoke particles; the ocean and
coastal pixels inside the smoke plumes, including those over Athens, are classified as dust particles. At the fire origins and along the plume dispersion pathways in both Albania and Greece, OMI-retrieved very high UV AI values (plots not shown), indicating the existence of strongly absorbing particles, as expected.
On August 26, the Evia fires continued to affect Athens’ air quality, although the smoke plumes were visibly smaller. PM10
concentration at the background site reached its highest value during the episode (54.1
mg m
3). Southward wind started to carry Albanian fire plumes into Greece, whereas the Peloponnese smoke plumes continued to move offshore. However, the spatial distribution of MODIS AOD indicates that they did not reach Athens. MODIS AOD in Athens, as inferred from nearest down-wind pixels, was approximately 0.7. OMI UV AI values indicate the presence of strongly absorbing particles over Athens, but misclassified the smoke plumes as dust. Ground level meteoro-logical observations, in the Athens basin, reported very strong winds blowing from the N–NE sector during the three-day period of 24–26 August. On August 27, the Peloponnese fires were smaller, but the circling smoke plumes affected the entire southern part of Greece, including Athens. High PM levels per-sisted with the average urban concentration calculated at 71.4mg m
3, while at the background site the concentration was measured at 38.1mg m
3. Due to cloud cover, the satellite instruments could not see Athens directly, but AOD values in surrounding pixels suggest that MODIS AOD was approximately 0.7 for Athens. OMI classified the aerosol type over Athens to be sulfate, and the aerosol type of the circling smoke plumes to be dust over ocean and smoke over land. The distinct contrast of OMI-retrieved particle types suggests that the circling smoke plumes did not directly affect the air quality of Athens. On August 28, MODIS still detected a few fire spots in Evia, but AOD values for surrounding pixels indicate that AOD in Athens was further reduced to approximately 0.5. OMI classified the aerosol type over Athens as non-absorbing sulfate near the ground. Ground PM10 concentration dropped below the EU 24-h limit value(50
mg m
3) at all stations with average urban and background concentrations being 44.1 and 24.1mg m
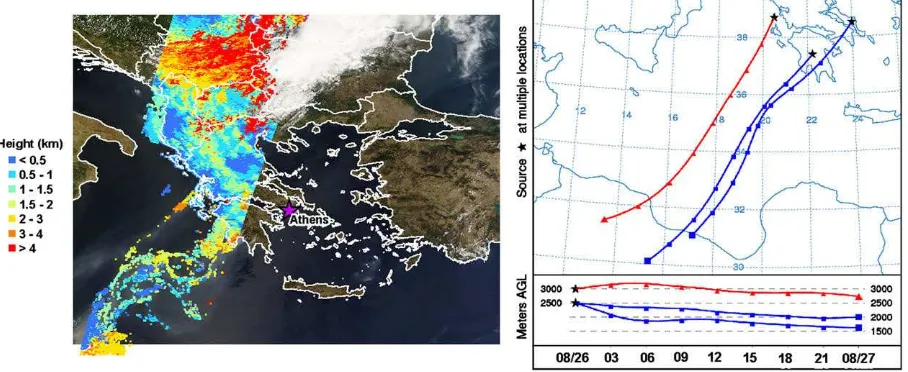
3respectively.On August 26, MISR captured the majority of the Peloponnese smoke plumes (Fig. 5, left plot). MISR-retrieved smoke plume top height indicates that smoke may have been injected as high as about 2.5 km in the main fire source area (i.e., the west coast of Peloponnese), whereas the one thin plume to the northwest of Peloponnese appears to be at around 3 km above the surface. As the plumes travel away from the coastal region, they seem to descend slightly, and concentrate between 1 and 2 km in elevation. MISR’s observations are supported by HYSPLIT forward trajectories showing that air parcels initiated from the main fire area at 2.5 km descend to between 1.5 and 2 km above sea level in 24 h, and another air parcel initiated northwest of the main fire area, at 3 km, maintains its elevation 24 h later (Fig. 5, right plot).
3.2. August 30 to September 3
On August 30, background PM10 concentration at THR was
25
mg m
3, and average urban PM10concentration was 59mg m
3.MODIS true-color images indicate that the Peloponnese smoke plumes were visibly smaller, and MODIS did not detect any fire spots in Evia. The Albanian fires continued to burn at multiple sites, and smoke plumes were blown to the northeast towards Serbia. MODIS observed a strip of polluted air between Bulgaria and northeastern Greece, with AOD values ranging from 0.5 to 0.8. MODIS AOD in Athens was between 0.3 and 0.4. The dominant wind direction was to the south over the Greek peninsula, and westerly winds started to blow polluted air from Italy towards Greece. OMI detected weakly
Fig. 2. Time series plots of average daily PM10concentrations at three urban sites
(dashed line with dots), a rural background site (dashed lines with circles), and average MODIS AOD values (solid line with triangles) in Athens. MODIS AOD on September 1 was missing due to extensive cloud cover.
absorbing sulfate particles over Athens. On August 31, MODIS true-color images show that the Albanian fires intensified, and large smoke plumes with AOD values as high as 1.5 were blown to the northeast. In addition, MODIS observed substantially higher AOD values over Italy and the northern half of Greece than those over the Peloponnese and Evia fire sites. MODIS AOD in Athens (between 0.6 and 1.6, average 0.9) was much higher than for surrounding areas (0.3–0.4), consistent with the large difference between urban average PM10 concentration (92
mg m
3) and background PM10concentration (35
mg m
3). This suggests that local sources were major contributors to the urban air pollution.By September 1, MODIS detected no fire spots in Evia, minor fire spots in the Peloponnese approximately 70 km east of the major fire sites (Fig. 6), and the Albanian fire sites were obscured by clouds. The polluted air mass, characterized by higher MODIS AOD values (0.6–1.0), that formed on August 31, moved further towards the southeast (Fig. 6). Dominant wind direction was from the north on August 31 and from the northwest on September 1. Since Sahara dust storms generally do not affect Athens in the summer months, the dust aerosols over Athens detected by OMI are probably mis-classified. Nonetheless, the coincident spatial patterns of elevated MODIS AOD values and OMI aerosol types indicate that Athens was
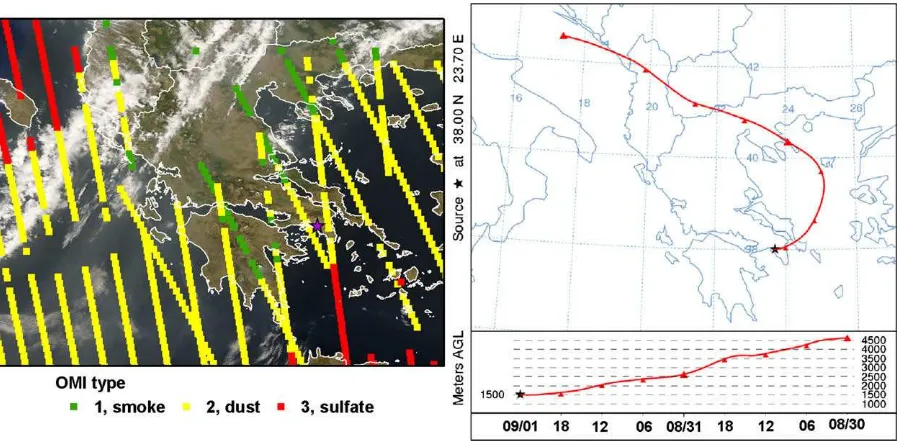
under the influence of this regional transport event. The HYSPLIT 48-h backward trajectory starting from Athens suggests the air mass that arrived on September 1 was influenced by both polluted air from Western Europe and the Albanian smoke plumes (Fig. 7). Unfortunately, MODIS AOD values in Athens and its surrounding region are missing. NCEP Meteorological data indicate that daytime regional boundary layer height during this episode is much lower (w300 m) than during the previous episode (w700 m). Although
the background PM10concentration rose to 40
mg m
3, the largedifference between the urban average PM10 concentration
(101
mg m
3) and background suggests that local sources were the major source of air pollution in Athens.On September 2, MODIS observed multiple fire spots in the areas of Albania not covered by cloud. MODIS AOD indicates no residual smoke plumes over the main Peloponnese fire sites, but Albanian fire smoke affected eastern Greece, Crete, and west Turkey, with an average MODIS AOD of 0.7 in Athens. OMI classified the particles over Athens a mixture of dust and sulfate, suggesting at least two aerosol types, likely from regional transport and local emissions. On September 3, cloud cover blocked the view of Athens and most of Greece. Observations from surrounding pixels suggest that MODIS AOD in the region was approximately 0.39. OMI clas-sified the aerosols over Athens as primarily sulfate particles, with a small amount of dust and smoke. The polluted air previously
Fig. 4.OMI predefined aerosol types overlaid on MODIS Level 1B true-color images over Greece from August 24 to 28, 2007. Athens is marked as the star.
classified as dust by OMI moved towards Turkey. The background PM10concentration dropped to 15
mg m
3, and average urban PM10concentration (37
mg m
3) returned to below the EU standard.4. Discussion
4.1. Impact of Greek forest fires on the air quality in Athens
The HYSPLIT forward trajectories and the spatial distribution of MODIS AOD indicate that smoke plumes generated by the Evia fires passed directly over Athens on August 25 and 26, causing a substantial increase in background PM10concentrations. MODIS
AOD measurements suggest that the Peloponnese fires may have also affected the air quality in Athens on August 27, when the circling wind in southern Greece brought smoke plumes to Athens. These findings are supported by OMI observations of light-absorbing particles, that are in good agreement with the visible patterns of the smoke plumes. Therefore, in addition to local emission sources, Greek forest fires were major contributors to the air pollution episode between August 24 and 28. Assuming that the PM10 concentrations at the THR station for August 24 and 29
(w19
mg m
3) represent the unaffected background during thisperiod, the 3-day average contribution from Greek forest fires was 28
mg m
3. The average contribution from traffic emissions and other local sources was 33mg m
3.On the other hand, the pollution episode between August 30 and September 3 was more likely caused by regional transport of industrial pollution from Italy and perhaps Western Europe, as well as smoke plumes generated by Albanian forest fires. During this period, the dominant wind direction switched from northeast to west and northwest. As the HYSPLIT backward trajectories show, the air mass over Athens on September 1 originated from north-west of Greece. Both MODIS AOD and OMI aerosol type observa-tions demonstrate the northwest-to-southeast movement of the polluted air mass. Assuming that the average PM10concentration at
the THR station on August 29 and September 3 (w17
mg m
3) is theunaffected background during this period, the average contribution of long-range transport was 17
mg m
3, and the average contribu-tion from traffic emissions and other local sources was 48mg m
3. NCEP meteorological data suggested that the contribution from local sources, concentrated in the shallow boundary layer during this episode, could be much greater relative to the contribution from regional transport. The unaffected background values of17–19
mg m
3 also correspond to the lowest 90th percentile ofconcentrations measured during the summer period, calculated from six years of continuous measurements at the same site (2001–2006).
4.2. Value of satellite data in characterizing air pollution episodes
Integrating available data from multiple sources creates a picture of aerosol characteristics and transport that is not readily discernible from satellite data products alone. The MODIS true-color images served as the base layer in this analysis, upon which other satellite data and HYSPLIT trajectories are overlaid. These images together with the active fire spots help identify the origins of fire plumes, and provide a preliminary assessment of which fire plumes may have affected the air quality in Athens. In addition to providing spatial context about the distribution of particle pollution, MODIS AOD tracked the variation of ground-level PM10well, especially for high
concentrations during the study period, as illustrated inFig. 2. When September 1 is excluded, PM10concentrations and MODIS AOD have
a Pearson correlation coefficient (r) of 0.89. One weakness of the correlation analysis is that direct AOD measurements in Athens are missing for a few days due to cloud contamination or high surface reflectance, so AOD must be estimated from surrounding pixels. Many previous studies that examined the AOD–PM relationship averaged AOD values within a certain distance (e.g., 25 km) of ground monitors to improve data coverage and get a more robust estimate of regional pollution level. The geographical setting of this analysis indicates that unless a site is on a flat terrain (Hutchison et al., 2008; Liu et al., 2007a), calculating mean AOD values based solely on proximity may introduce substantial errors. Instead, spatial averaging must take the impact of elevation and terrain conditions into consideration, for example, by excluding pixels over high mountains. This is particularly important for large-scale studies involving many ground monitors.
OMI can distinguish the smoke plumes from background pollution due to its high sensitivity to particle light absorption, and its ability to retrieve aerosol properties over both land and ocean surfaces. OMI spatial coverage is slightly better than MODIS in the Athens region because it is not affected by the high surface reflectance. However, OMI misclassified as dust almost all the smoke plumes over ocean. This might be caused by incorrect assumptions regarding aerosol layer heights, since the OMI absorbing particle retrieval is very sensitive to this quantity. It is likely that in OMI’s current aerosol climatology, all strongly
absorbing aerosols a few kilometers above the ocean surface in the Mediterranean region are considered as dust. Therefore, the current OMI aerosol types can only be used to qualitatively distinguish different aerosol air mass types under some condi-tions, such as forest fire smoke vs. industrial pollution. Updated information about aerosol emission sources, such as the season-ality and frequency of forest fires and dust storms in this region, was used to obtain correct aerosol type estimates for the current study.
Due to its low sampling frequency compared to MODIS and OMI, MISR did not observe the Evia smoke plumes. MISR-retrieved plume top heights show that the main Peloponnese smoke plumes on August 26 stayed near the surface after the initial injection, which is in good agreement with HYSPLIT trajectory predictions. Although not suitable for daily operational monitoring of forest fires due to low sampling frequency, MISR provides high quality AOD measurements (Kahn et al., 2005) and plume heights over land. MISR-retrieved aerosol microphysical properties have also been used to distinguish different particle size and types (Liu et al., 2007b; Liu et al., 2007c). These data products can be used together with MODIS fire product to study the long-term characteristics of forest fires in a region, to take advantage of its particle type retrievals, and higher AOD retrieval accuracy over land.
5. Summary
The massive forest fires and regional particle pollution trans-port between August 23 and September 4 in Greece were analyzed by integrating multiple satellite remote sensing prod-ucts with meteorological data and surface observations. Two particle pollution episodes, August 24–28, and August 30– September 3, were identified in ground PM10 measurements. The Evia fire smoke had a significant impact on air quality in Athens on August 25 and 26; its contribution was comparable with local emission sources. The circling Peloponnese fire smoke affected Athens on August 27, but its contribution was smaller than local emission sources during this episode. Regional transport of polluted air from Italy and perhaps Western Europe, as well as forest fires in Albania, made significant contributions to the second pollution episode in Athens; however, local emissions were the dominant source of particles. An integrated view of multiple data sources provides a powerful tool for characterizing particle spatial distribution, temporal variation, source locations and plume transport. Furthermore, the cross-comparison of multiple satellite data products cannot only take advantage of each sensor’s strengths, but also helps identify areas for future improvement.
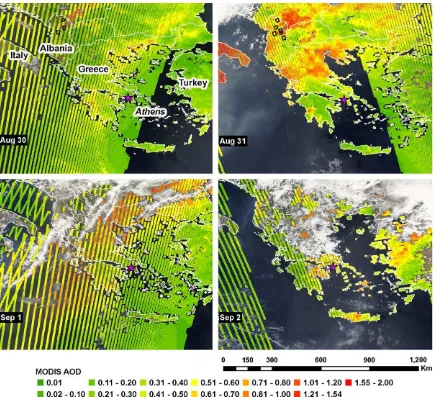
Fig. 6. MODIS AOD values overlaid on MODIS Level 1B true-color images with fire spots (black polygons) over Greece from August 30 to September 2, 2007. Athens is marked as the star.
Acknowledgement
The work of Yang Liu and Petros Koutrakis was supported by The Harvard School of Public Health Cyprus Initiative and Harvard-EPA Center on Particle Health Effects (R-827353 and R-832416). The work of Ralph A. Kahn is supported in part by NASA’s Climate and Radiation Research and Analysis Program, under H. Maring, and in part by the EOS–MISR instrument project; it is performed at the Goddard Space Flight Center under contract with NASA.
References
Chaloulakou, A., Kassomenos, P., Spyrellis, N., Demokritou, P., Koutrakis, P., 2003. Measurements of PM10 and PM2.5 particle concentrations in Athens, Greece. Atmospheric Environment 37, 649–660.
Charron, A., Harrison, R.M., Quincey, P., 2007. What are the sources and conditions responsible for exceedences of the 24 h PM10 limit value (50 mu g m(-3)) at a heavily trafficked London site? Atmospheric Environment 41, 1960–1975. Diner, D., Beckert, J., Bothwell, G., Rodriguez, J., 2002. Performance of the MISR
instrument during its first 20 months in earth orbit. IEEE Transactions on Geoscience and Remote Sensing 40, 1449–1466.
Draxier, R.R., Hess, G.D., 1998. An overview of the HYSPLIT_4 modelling system for trajectories, dispersion and deposition. Australian Meteorological Magazine 47, 295–308.
Giglio, L., Descloitres, J., Justice, C.O., Kaufman, Y.J., 2003. An enhanced contextual fire detection algorithm for MODIS. Remote Sensing of Environment 87, 273–282. Grivas, G., Chaloulakou, A., Kassomenos, P., 2008. An overview of the PM10
pollu-tion problem, in the Metropolitan area of Athens, Greece. Assessment of controlling factors and potential impact of long range transport. Science of the Total Environment 389, 165–177.
Harrison, R.M., Yin, J.X., Mark, D., Stedman, J., Appleby, R.S., Booker, J., Moorcroft, S., 2001. Studies of the coarse particle (2.5-10 mu m) component in UK urban atmospheres. Atmospheric Environment 35, 3667–3679.
Hutchison, K.D., Faruqui, S.J., Smith, S., 2008. Improving correlations between MODIS aerosol optical thickness and ground-based PM2.5 observations through 3D spatial analyses. Atmospheric Environment 42, 530–543.
Jiang, X., Liu, Y., Yu, B., Jiang, M., 2007. Comparison of MISR aerosol optical thickness with AERONET measurements in Beijing metropolitan area. Remote Sensing of Environment 107, 45–53.
Jones, A.M., Yin, J.X., Harrison, R.M., 2008. The weekday-weekend difference and the estimation of the non-vehicle contributions to the urban increment of airborne particulate matter. Atmospheric Environment 42, 4467–4479. Kahn, R.A., Chen, Y., Nelson, D.L., Leung, F.Y., Li, Q.B., Diner, D.J., Logan, J.A., 2008.
Wildfire smoke injection heights: two perspectives from space. Geophysical Research Letters 35.
Kahn, R.A., Gaitley, B.J., Martonchik, J.V., Diner, D.J., Crean, K.A., Holben, B., 2005. Multiangle Imaging Spectroradiometer (MISR) global aerosol optical depth validation based on 2 years of coincident Aerosol Robotic Network (AERONET)
observations. Journal of Geophysical Research – Atmospheres 110 Art. No. D10S04.
Kahn, R.A., Li, W.H., Moroney, C., Diner, D.J., Martonchik, J.V., Fishbein, E., 2007. Aerosol source plume physical characteristics from space-based multiangle imaging. Journal of Geophysical Research – Atmospheres 112 Art. No. D11205. Koukouli, M.E., Balis, D.S., Amiridis, V., Kazadzis, S., Bais, A., Nickovic, S., Torres, O., 2006. Aerosol variability over Thessaloniki using ground based remote sensing observations and the TOMS aerosol index. Atmospheric Environment 40, 5367–5378.
Kunzli, N., Avol, E., Wu, J., Gauderman, W.J., Rappaport, E., Millstein, J., Bennion, J., McConnell, R., Gilliland, F.D., Berhane, K., Lurmann, F., Winer, A., Peters, J.M., 2006. Health effects of the 2003 Southern California wildfires on children. American Journal of Respiratory and Critical Care Medicine 174, 1221–1228.
Liu, Y., Franklin, M., Kahn, R., Koutrakis, P., 2007a. Using aerosol optical thickness to predict ground-level PM2.5 concentrations in the St. Louis area: a comparison between MISR and MODIS. Remote Sensing of Environment 107, 33–44. Liu, Y., Kahn, R., Koutrakis, P., 2007b. Estimating PM2.5 component concentrations
and size distributions using satellite retrieved fractional aerosol optical depth: part I – method development. Journal of the Air & Waste Management Asso-ciation 57, 1351–1359.
Liu, Y., Kahn, R., Turquety, S., Yantosca, R.M., Koutrakis, P., 2007c. Estimating PM2.5 component concentrations and size distributions using satellite retrieved fractional aerosol optical depth: part II – a case study. Journal of the Air & Waste Management Association 57, 1360–1369.
Liu, Y., Sarnat, J., Kilaru, V., Jacob, D., Koutrakis, P., 2005. Estimating ground-level PM2.5 in the Eastern United States using satellite remote sensing. Environ-mental Science & Technology 39, 3269–3278.
Naeher, L.P., Brauer, M., Lipsett, M., Zelikoff, J.T., Simpson, C.D., Koenig, J.Q., Smith, K.R., 2007. Woodsmoke health effects: a review. Inhalation Toxicology 19, 67–106.
Pace, G., Meloni, D., di Sarra, A., 2005. Forest fire aerosol over the Mediterranean basin during summer 2003. Journal of Geophysical Research – Atmospheres 110. Remer, L.A., Kaufman, Y.J., Tanre, D., Mattoo, S., Chu, D.A., Martins, J.V., Li, R.R., Ichoku, C., Levy, R.C., Kleidman, R.G., Eck, T.F., Vermote, E., Holben, B.N., 2005. The MODIS aerosol algorithm, products, and validation. Journal of the Atmo-spheric Sciences 62, 947–973.
Remer, L.A., Kleidman, R.G., Levy, R.C., Kaufman, Y.J., Tanre, D., Mattoo, S., Martins, J.V., Ichoku, C., Koren, I., Yu, H.B., Holben, B.N., 2008. Global aerosol climatology from the MODIS satellite sensors. Journal of Geophysical Research – Atmospheres 113, D14S07.
Salomonson, V.V., Barnes, W.L., Maymon, P.W., Montgomery, H.E., Ostrow, H., 1989. Modis – advanced facility instrument for studies of the earth as a system. IEEE Transactions on Geoscience and Remote Sensing 27, 145–153.
Schoeberl, M.R., Douglass, A.R., Hilsenrath, E., Bhartia, P.K., Beer, R., Waters, J.W., Gunson, M.R., Froidevaux, L., Gille, J.C., Barnett, J.J., Levelt, P.F., De Cola, P., 2006. Overview of the EOS aura mission. IEEE Transactions on Geoscience and Remote Sensing 44, 1066–1074.
Torres, O., Bhartia, P.K., Herman, J.R., Sinyuk, A., Ginoux, P., Holben, B., 2002. A long-term record of aerosol optical depth from TOMS observations and comparison to AERONET measurements. Journal of the Atmospheric Sciences 59, 398–413.