WIND WAVE NUMERICAL MODELING IN THE CASPIAN SEA
R. Mahmoodi a, *, A. A. Ardalan a, M. Hasanlou a
a School of Surveying and Geospatial Engineering, College of Engineering, University of Tehran, Tehran, Iran - (reza.mahmoodi13, ardalan, hasanlou)@ut.ac.ir
KEYWORDS: SWH, numerical modeling, simulation, wave modeling, wind wave
ABSTRACT:
Numerical simulation results of wind wave in the Caspian Sea by using wind forcing data are presented. The numerical modeling which is applied in this study is based on numerical spectral wave model which is based on Navier-Stokes equations. It solves these equations through each of mesh elements. Moreover, in this model high-resolution unstructured grid for the Caspian Sea has been used in order to reach finer accuracy. The wind forcing data are given from European Centre for Medium-Range Weather Forecasts (ECMWF). The measurement data, which are gained from Ports and Marine Organisation (PMO) of Iran, are used in order to estimate the accuracy of the model. The results have shown better accuracy in comparison with PMO simulation. Mean of the coefficient of determination (R-squared) for significant wave height in this simulation is 0.8059, though, in PMO simulation this coefficient is reported 0.7056. Better accuracy requires more measurement data and also finer resolution of bathymetry data.
1. INTRODUCTION
One of the most important marine phenomena is a wave which its features make it hard phenomena for study. Waves are crucial in determining the geometry and shape of the coasts, especially in designing ports, waterways, coastal protection, coastal structures, and other coastal activities. The first step for designing coastal structures and determining sand transport and pollution’s propagation is a hydrodynamic study of the coastal region. The impact of waves on coasts and coastal activities makes researchers measure the wave features by field tools (in-situ data) and numerical modeling for their studies. These features are varying in domain and time, therefore, accurate identification of these features requires long measurements in short intervals at several places in the case study (A.a et al., 2005). Nevertheless, nowadays because of the high costs of field measurements and also developments in computers processing and improvements in numerical modeling, hindcasting and determining the wave’s features are usually done by these numerical modeling. In the other hand, for calibration of those models, there have to be some field measurements. In south coasts of Caspian Sea in Iran, field measurements are available at Noshahr and Amirabad ports. Therefore, with these measurements and the outputs of numerical modeling for the Caspian Sea and also satellite data, wave hindcast can be done for a long time.
Aboobacker and his colleagues (Aboobacker et al., 2009) applied an MIKE21 SW model for eastern coasts of India and compared the results with measured data from May 1996 to January 1997. They found out that due to the high correction coefficients, i.e. 0.87 and the bias (0.25m) the results were reliable and perfectly matched to the measured data. Furthermore, they reported that for more accurate results, wind data with better spatial resolution must be employed. Samiksha and his colleagues (Samiksha et al., 2012) simulated the waves of Indian Ocean with numerical model WAVEWACTH III and then they validated their model’s results with measured data and because of the fine accuracy of the model they could rebuild the May 2002 events perfectly. Sharifi and his colleagues (Sharifi et al., 2012) investigated predicting wave characteristics by two numerical models,
* Corresponding author
MIKE21 SW and WAVEWACTH III. Global Forecast System (GFS) for wind data and ETOP01 for bathymetry data were used by them and then they compared the results with significant wave height (SWH) derived by satellites and find out that MIKE21 SW model gives more accurate results in shallow water and nearshore due to its unstructured mesh. Myslenkov and his colleagues (Myslenkov et al., 2016) used two sources, GFS and Weather Research and Forecasting (WRF), for their wind data in their wave simulation by SWAN and they reached RMSE=0.3m for one year period and also it reveals that more accurate results can be reached when WRF wind data employed. In this study, we tried to reach more accurate wave model for the Caspian Sea by applying an MIKE21 SW model and using ECMWF wind data and then calibrate it with measured data for Amirabad and Noshahr ports.
2. CASE STUDY AND DATASETS
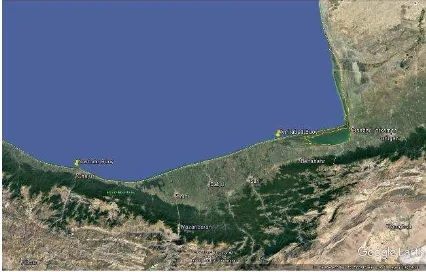
Wave measurements are obtained from Ports and Maritime Organization of Iran during June, July and August 2013 from two buoys which are developed at Amirabad and Noshahr ports (Figure 1).
Figure 1. Buoys location which wave measurements are obtained from them
Wind-wave models are mostly based on wind data. The more accurate model requires more accurate wind data, therefore, in
The International Archives of the Photogrammetry, Remote Sensing and Spatial Information Sciences, Volume XLII-4/W4, 2017 Tehran's Joint ISPRS Conferences of GI Research, SMPR and EOEC 2017, 7–10 October 2017, Tehran, Iran
This contribution has been peer-reviewed.
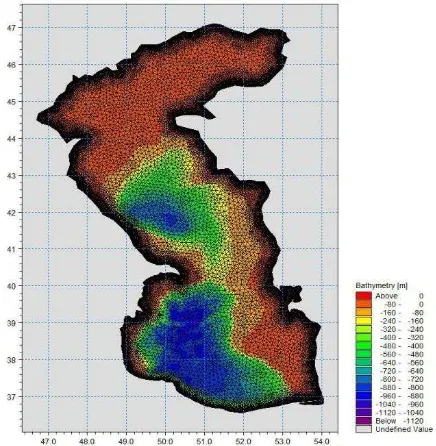
this study, we used reanalysis data from ECMWF ERA-Interim (“ERA Interim, Daily,” n.d.) dataset with a spatial resolution of 0.125 degrees and temporal resolution of 3 hours. Moreover, GEBCO_2014 Grid with 30 arc-second intervals is used for bathymetry data from (“Gridded bathymetry data (General Bathymetric Chart of the Oceans).,” n.d.). Caspian Sea level is 27 meter under the sea level, therefore (Imani et al., 2014), we added 27 meters to these data to make them correct for calculations. In order to determine the case study, we used an unstructured mesh which has four sizes in a different area, from deep sea to shallow water the distance between nodes are respectively 10000 meters, 3200 meters, 1200 meter, 700 meters to provide better results (Figure 2).
Figure 2. Case study and mesh elements with adding bathymetry data
3. PROPOSED METHOD
As we mentioned before there are several methods for wave modeling including numerical modeling and experimental methods. Nowadays by developing science and technology and improvements in computers, numerical modeling has been improved greatly and fine accuracy can be gained by using numerical modeling methods. In this study, we used a fully spectral formulation which has been explained in (I.R. Young, 1999) and (G. J. Komen et al., 1996). By using this model, we can observe several physical phenomena relating to wave including (1) Growing waves because of the wind, (2) Dissipation because of the bed resistance, (3) Dissipation because of the white capping, (4) Dissipation because of the wave braking, (5) Wave-wave none liner interaction, (6) Wave-current interaction, (7) Ice coverage influence on waves, (8) Time-varying effect on water depth, and (9) Depth variation effect on refraction and shoaling (Wadhams, 1996).
We used the quasi-linear theory of wind-wave generation based on (Janssen, 1991) for wind input which allows the momentum to transfer from the wind to the sea depends on the sea state and also the wind stress. By incorporating this approach (Hasselmann and Hasselmann, 1985), we approximated the non-linear energy transfer which is through the wave-wave non-linear interaction. The theories of (Hasselmann, 1974) and (Janssen, 1989) have been used in order to calculate the dissipation due to the white-capping. For modeling the bottom friction dissipation, approach of (Johnson and Kofoed-Hansen, 2000) has been used which
depends on the wave and sediment properties. Well-proven approach of (J. A. Battjes and J. P. F. M. Janssen, n.d.) and (Eldeberky and Battjes, 1996) are used in order to describe the bottom-induced wave breaking. The other phenomena which we mentioned them as our final result are presented in (OLE R. SØRENSEN et al., 2005).
In order to run the model, we used 10 minutes’ intervals which are enough to recognize changes in SWH. Considering the fact that our measurement data are for July and August 2013, we run the model for 30 days from 2013/6/23 to 2013/7/22 and as we do not have any initial conditions. we considered initial conditions as zero spectral and after the simulation, the results of the first two days have been eliminated from the results.
In this model, we used two spectral discretizations, frequency discretization, and directional discretization. Logarithm discretization has been used for frequency discretization with less frequency of 0.055 Hertz and coefficient of 1.1 and for directional discretization, we used 16 directions with 22.5 degrees’ intervals. In order to calculate the wind influence, there are two manners: (1) coupled, (2) uncoupled. Whenever our domain is local and small we can use uncoupled manner in our model, though, in this study due to the Caspian Sea size, we used coupled manner and also we considered drag coefficient constant with the value of 0.01. After running the model with primary values, we started sensitivity analysis in order to find out which parameters are effective in the model’s results. we find out that bottom friction constant value and the constant values of white-capping are effective in the SWH.
Eventually, after running the model several times with different values for these constants, we achieved the best values for them which are mentioned in Table 1.
Table 1. Constant values for calibrated model Coeff
Figure 3 and 4 are model’s results with calibrated constant values in comparison with measurement data for Amirabad and Noshahr ports.
Figure 3. comparison the SWH derived from calibrated numerical model and measurement data for Amirabad Port
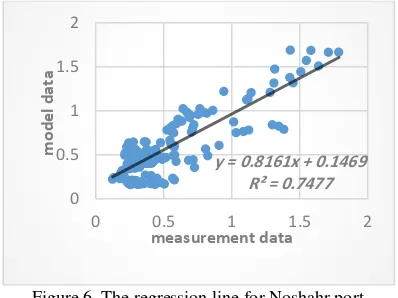
As it can be seen in Figure 3 and 4, SWH changes are perfectly simulated. Figure 5 and 6 are the regression charts for the measurement data and model’s results.
The International Archives of the Photogrammetry, Remote Sensing and Spatial Information Sciences, Volume XLII-4/W4, 2017 Tehran's Joint ISPRS Conferences of GI Research, SMPR and EOEC 2017, 7–10 October 2017, Tehran, Iran
This contribution has been peer-reviewed.
Figure 4. comparison the SWH derived from calibrated numerical model and measurement data for Noshahr Port
Figure 5. The regression line for Amirabad Port.
Figure 6. The regression line for Noshahr port.
The results showed better accuracy in Amirabad Port which we assumed that is due to the more available measurement data in Amirabad Port. This simulation could simulate SWH with 2meter height which reveals the capability of predicting accurate SWH in storm conditions in the Caspian Sea. The scatter chart of the results shows that we can use this calibrated model for a whole year and in the future studies we can use this study as a base in order to predict SWH in the Caspian Sea for future years. Also, numerical results for these two ports present in Table 2.
Table 2. Numerical results for Amirabad and Noshahr ports.
R2 RMSE MSE
Amirabad 0.8641 0.1528 0.0233
Noshahr 0.7477 0.1703 0.029
Eventually, Figure 7 is the schematic output for the Caspian Sea for one of the time steps. Vectors are showing the magnitude of SWH and the direction of the waves.
Figure 7. Schematic output for the Caspian Sea
4. CONCULOSION
Using ECMWF wind data are reliable to use for wind wave numerical modeling. The model’s Mean R-squared is 0.8059 and the mean RMSE is 0.16155 meter which shows that the model is perfectly matched with measurement data and also it has better accuracy than the PMO simulation (Ports and Marin Organization of Iran, 2016).
REFERENCES
A.a, G., A, N., S, T., V, C., V, J.A., 2005. WAVE HINDCAST STUDY OF THE CASPIAN SEA 1, 19–25.
Aboobacker, V.M., Vethamony, P., Sudheesh, K., Rupali, S.P., 2009. Spectral characteristics of the nearshore waves off Paradip, India during monsoon and extreme events.
Eldeberky, Y., Battjes, J.A., 1996. Spectral modeling of wave breaking: Application to Boussinesq equations. J. Geophys. Res. Oceans 101, 1253–1264. doi:10.1029/95JC03219 Oceanography and marine science [WWW Document]. Camb.
Univ. Press. URL
http://www.cambridge.org/ir/academic/subjects/earth-and-
environmental-science/oceanography-and-marine-science/dynamics-and-modelling-ocean-waves (accessed 5.24.17). Gridded bathymetry data (General Bathymetric Chart of the Oceans).
[WWW Document], n.d. . GEBCO. URL
http://www.gebco.net/data_and_products/gridded_bathymetry_dat a/ (accessed 5.30.17).
Hasselmann, K., 1974. On the spectral dissipation of ocean waves due to white capping. Bound.-Layer Meteorol. 6, 107–127.
The International Archives of the Photogrammetry, Remote Sensing and Spatial Information Sciences, Volume XLII-4/W4, 2017 Tehran's Joint ISPRS Conferences of GI Research, SMPR and EOEC 2017, 7–10 October 2017, Tehran, Iran
This contribution has been peer-reviewed.
Hasselmann, S., Hasselmann, K., 1985. Computations and Parameterizations of the Nonlinear Energy Transfer in a Gravity-Wave Spectrum. Part I: A New Method for Efficient Computations of the Exact Nonlinear Transfer Integral. J. Phys. Oceanogr. 15,
1369–1377.
doi:10.1175/1520-0485(1985)015<1369:CAPOTN>2.0.CO;2
Imani, M., You, R.-J., Kuo, C.-Y., 2014. Caspian Sea level prediction using satellite altimetry by artificial neural networks. Int. J. Environ. Sci. Technol. 11, 1035–1042. doi:10.1007/s13762-013-0287-z
I.R. Young, 1999. Wind Generated Ocean Waves, Volume 2 - 1st
Edition [WWW Document]. URL
https://www.elsevier.com/books/wind-generated-ocean-waves/young/978-0-08-043317-2 (accessed 5.24.17).
J. A. Battjes, J. P. F. M. Janssen, n.d. Energy Loss and Set-Up Due to Breaking of Random Waves. Coast. Eng. 1978, Proceedings. doi:10.1061/9780872621909.034
Janssen, P.A.E.M., 1991. Quasi-linear Theory of Wind-Wave Generation Applied to Wave Forecasting. J. Phys. Oceanogr. 21,
1631–1642.
doi:10.1175/1520-0485(1991)021<1631:QLTOWW>2.0.CO;2
Janssen, P.A.E.M., 1989. Wave-Induced Stress and the Drag of Air Flow over Sea Waves. J. Phys. Oceanogr. 19, 745–754. doi:10.1175/1520-0485(1989)019<0745:WISATD>2.0.CO;2 Johnson, H.K., Kofoed-Hansen, H., 2000. Influence of Bottom Friction
on Sea Surface Roughness and Its Impact on Shallow Water Wind Wave Modeling. J. Phys. Oceanogr. 30, 1743–1756. doi:10.1175/1520-0485(2000)030<1743:IOBFOS>2.0.CO;2 Myslenkov, S.A., Shestakova, A.A., Toropov, P.A., 2016. Numerical
simulation of storm waves near the northeastern coast of the Black Sea. Russ. Meteorol. Hydrol. 41, 706–713. doi:10.3103/S106837391610006X
OLE R. SØRENSEN, HENRIK KOFOED-HANSEN, MORTEN RUGBJERG, LARS S. SØRENSEN, 2005. A third-generation spectral wave model using an unstructured finite volume technique
[WWW Document]. ResearchGate. URL
https://www.researchgate.net/publication/255572079_A_third-generation_spectral_wave_model_using_an_unstructured_finite_v olume_technique (accessed 5.24.17).
Ports and Marin Organization of Iran, 2016. modeling-phase2-f. Samiksha, S.V., Vethamony, P., Aboobacker, V.M., Rashmi, R., 2012.
Propagation of Atlantic Ocean swells in the north Indian Ocean: a case study. Nat Hazards Earth Syst Sci 12, 3605–3615. doi:10.5194/nhess-12-3605-2012
Sharifi, F.S., Ezam, M., Karami Khaniki, A., 2012. Evaluating the results of Hormuz strait wave simulations using WAVEWATCH-III and MIKE21-SW. Int. J. Mar. Sci. Eng. 2, 163–170.
Wadhams, P., 1996. Dynamics and modelling of ocean waves. KomenG.J., CavaleriL., DonelanM., HasselmannK., HasselmannS., and JanssenP.A.E.M.. 1994. Cambridge: Cambridge University Press, xxi + 532 p, illustrated, hard cover. ISBN 0-521-47047-1. £40.00; $US59.95. Polar Rec. 32, 362–363. doi:10.1017/S0032247400067619
The International Archives of the Photogrammetry, Remote Sensing and Spatial Information Sciences, Volume XLII-4/W4, 2017 Tehran's Joint ISPRS Conferences of GI Research, SMPR and EOEC 2017, 7–10 October 2017, Tehran, Iran
This contribution has been peer-reviewed.