GLOBAL DIFFUSION PATTERN AND HOT SPOT ANALYSIS OF
VACCINE-PREVENTABLE DISEASES
Yongyao Jiang1,*, Friday Fan 2, I. Holly Zanoni 2, Yun Li 1
1NSF Spatiotemporal Innovation Center, George Mason University, Fairfax, VA 22030 - (yjiang8, yli38)@gmu.edu 2International Development, Community and Environment Department, Clark University, Worcester, MA 01610 –
(jianfan, hzanoni)@clarku.edu
KEY WORDS: Spatiotemporal Analysis, Hot Spot Analysis, Public Health, GWR
ABSTRACT:
Spatial characteristics reveal the concentration of vaccine-preventable disease in Africa and the Near East and that disease dispersion is variable depending on disease. The exception is whooping cough, which has a highly variable center of concentration from year to year. Measles exhibited the only statistically significant spatial autocorrelation among all the diseases under investigation. Hottest spots of measles are in Africa and coldest spots are in United States, warm spots are in Near East and cool spots are in Western Europe. Finally, cases of measles could not be explained by the independent variables, including Gini index, health expenditure, or rate of immunization. Since the literature confirms that each of the selected variables is considered determinants of disease dissemination, it is anticipated that the global dataset of disease cases was influenced by reporting bias.
1. PROBLEM STATEMENT
The concept for this project originates from a news report that aired on National Public Radio on 25 January 2014, entitled, How Vaccine Fears Fueled the Resurgence of Preventable Diseases (NPR, 2014). Specifically, the Global Health Program at the Council on Foreign Relations tracked news reports on global outbreaks of five vaccine-preventable diseases, including measles, mumps, polio, rubella, and whooping cough (NPR, 2014); all which are spread through the air or by direct contact (CDC, 2014). The story suggested that vaccination rates were falling enough in the United States that the community immunity threshold requirement was no longer being met, resulting resurgence of vaccine-preventable diseases; this fact is well documented throughout medical literature (Cherry, 2012; Hinman, 2011; Meissner, 2004). When a critical portion of a community is immunized against a contagious disease, most members of the community are protected against the disease because there is little opportunity for an outbreak and even those who are not eligible for certain vaccines—such as infants or immunocompromised individuals—get some protection because the spread of contagious disease is contained (CDC, 2012). This is known as "community immunity." In the case of measles, for example, a minimum threshold of 83% must be maintained (CDC, 2014).
Research has been dedicated to the patterns of directional movement (Samphutthanon, 2013) and determining statistically significant hot spots of diseases (Hinman, 2006; Jeefo, 2010; Samphutthanon, 2013). However, implementing GIS to analyze disease diffusion arising from spatially non-stationary processes, such as ordinary least squares (OLS) and geographically weighted regression (GWR) is limited (Goto, 2013; Hu, 2012).
The objectives of this project are to: 1) Identify spatial characteristics of vaccine-preventable diseases by measuring central tendency, dispersion, and directional trend (Hinman,
Corresponding author
2006; Samphutthanon, 2013); 2) Highlight one of the vaccine- preventable diseases to determine statistically significant hot spots (Hinman, 2006; Jeefo, 2010; Samphutthanon, 2013); and 3) Explore variables that explain the spread of the highlighted disease (Goto, 2013).
2. DATA
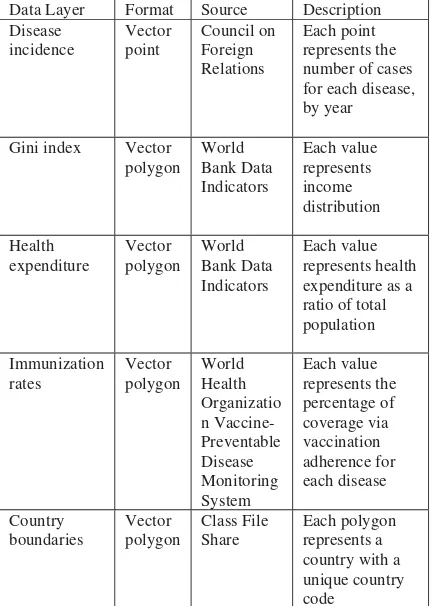
Data are listed in table 1. Global disease case data were retrieved from the Council on Foreign Relations in a CSV file containing coordinates for all sample points, which were then geocoded in ArcGIS. Data were collected globally between January 2008 and December 2013 based on news reports with the number of disease cases recorded at a single geographical location. Since no metadata accompanied the dataset, it is assumed that the coordinate locations represent hospitals or clinics. The data points were then cleaned to remove erroneous values and the final global dataset consisted of 884 geographical points, including 1,215,603 cases. The number of disease cases serves as the dependent variable and cases were normalized by the total population of each country.
health expenditure as a ratio of total population was used as a proxy to access to health care (Filmer, 1999; Herrera, 2005).
Data Layer Format Source Description Disease
Gini index Vector polygon
Table 1. Data source and description
3. METHODS
3.1 Spatio Temporal Analysis
Spatio temporal analysis was performed to determine where the diseases appear to be originating and trending globally. Each disease was classified by year and by number of cases and the temporal spatial pattern was ranked by number of cases for each year from 2008-2014. Cases were standardized across all diseases for consistency.
3.2 Standard Deviational Ellipse
Spatial characteristics of disease were identified by measuring central tendency, dispersion, and directional trend. Analysis was applied to the raw point disease data layer to create annual ellipses for each disease. This analysis consisted of two primary steps, locating the mean center and the directional trend.
The first step included locating the mean center for each disease across all years as well as for each disease by each year. The mean center parameter was weighted by cases. Furthermore, the mean center was also considered for all diseases by year (also weighted by cases), which resulted in an overall undeviating mean center in Africa.
The second step included determining directional trend for each
disease across all years as well as for each disease by each year in the time series. The ellipse parameter was weighted by cases. There were insufficient records to calculate ellipses for mumps in 2008; polio in 2008 and 2009; and whooping cough in 2008 and 2009. The shape and extent of the ellipses influenced the remainder of the analyses and led to the exclusion of mumps and rubella altogether and limiting polio and whooping cough. 2014 was excluded from the final analysis because it is the current reporting year, which is not a complete year and is thus invalid. Only measles, still presented with suitable spatial characteristics. However, further spatial statistics analysis dictated which disease to further investigate.
3.3 Spatial Autocorrelation Analysis (Moran’s I)
To determine whether the diseases were spatially clustered, randomly distributed or dispersed, spatial autocorrelation was applied to each disease. Fixed distance band was chosen to conceptualize the spatial relationships so that each feature was analyzed within the context of neighboring features. In order to determine the distance, incremental spatial autocorrelation was performed to get the distance corresponding to the first peak.
3.4 Hot Spot Analysis (Getis-Ord Gi*)
After the spatial autocorrelation analysis, only measles shows a significant clustering pattern. To identify hot spots of measles within all five years, hot spot analysis was performed. In order to analyze the change of hot spot over time, sot spot analysis was then performed with measles data for each year.
3.5 Ordinary Least Squares (OLS)
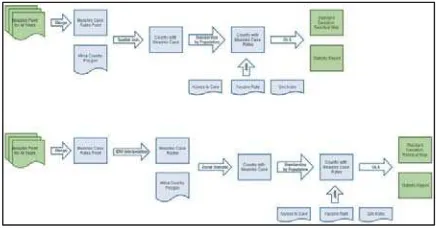
Global ordinary least squares linear regression was performed in order to understand the relationship between the measles cases and the independent variables: Gini index, health expenditure, and immunization rates. Based on research, it was assumed that the chosen independent variables statistically explain the dependent variable. As described in the flowchart in figure 1, two approaches were attempted to construct the OLS model.
In the first approach, disease incidents points were spatially joined to the country polygon feature using the SUM aggregation method and then eliminated countries that have no incidents being joined. Incidents were further standardized by population in each country and the other independent variables were also joined to the country polygon feature. The OLS analysis is performed based on the joined polygon feature by specifying one unique ID fields, dependent and independent variables and path to output report file.
The second approach introduced spatial interpolation and zonal statistics to address the problem of countries that have no disease incidents. A raster surface that covers the focused study area (Africa) was interpolated and the country polygons were used as the analytical zones and the mean incident rate value for each African country was extracted. The mean rates value was then used as dependent variable in the OLS analysis in which the independent variables are the same as in the first approach.
3.6 Interpolation
area. Since previous research indicated that the incident points in Africa are spatially autocorrelated, inverse distance weighted spatial technique was used to interpolate a raster surface that guarantees each country has some incident rate value. The default parameters were applied, except the search radius was specified based on the result of the Incremental Spatial Autocorrelation.
Figure 1. Methodology for OLS analysis
4. RESULTS
4.1 Spatial Characteristics
Temporal spatial analysis was performed to determine where the diseases appear to be originating and trending globally. This analysis was performed primarily to reproduce the time series analysis presented in the news report; which was effective at peaking interest regarding the incidence of disease globally. After looking at the dispersion of disease, the most visually prevalent diseases throughout the time series included measles, polio, and whooping cough. Refer to figure 2 for a directional movement of diseases.
Figure 2. Spatio temporal analysis of measles, polio, and whooping cough
Figure 3. Directional distribution measles, polio, and whooping cough
4.2 Spatial Autocorrelation Analysis (Moran’s I)
To determine whether the diseases are spatially clustered, randomly distributed or dispersed, spatial autocorrelation was applied to each disease. Fixed distance band was chosen to conceptualize the spatial relationships so that each feature is analyzed within the context of neighboring features. In order to determine the distance, incremental spatial autocorrelation was performed to get the distance corresponding to the first peak. Refer to table 2 for the Moran's I results for diseases.
Disease Z-score
P-value
Moran’s I
Disease Z-score Measles 6.649 0.000 0.02 Measles 6.649 Mumps -0.779 0.436 -0.03 Mumps -0.779 Polio 0.061 0.952 -0.01 Polio 0.061 Table 2. Spatial autocorrelation analysis (Moran’s I) results for diseases; according to the table above, only measles shows a significant clustering pattern based on Z-score
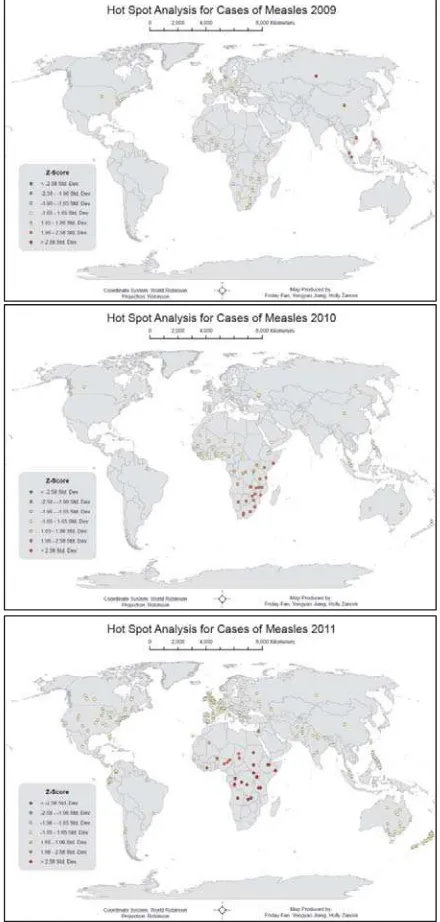
4.3 Hot Spot Analysis (Getis-Ord Gi*)
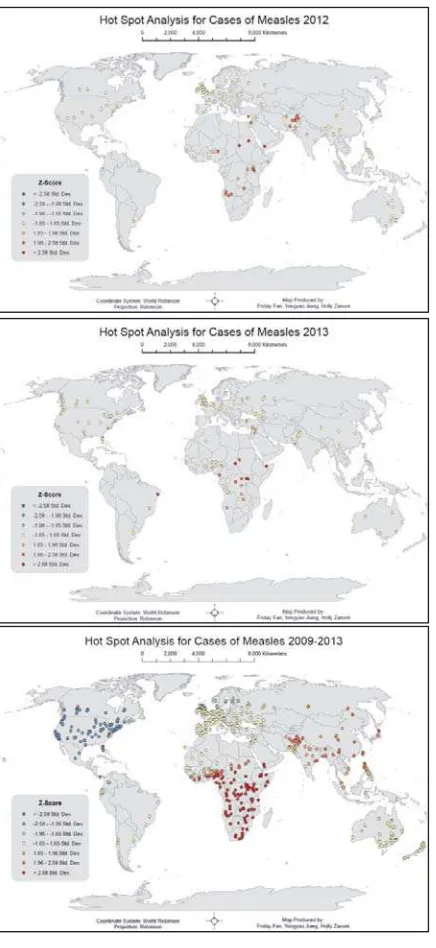
Analysis of hot spots of measles by year indicates that cases are clustered (hot spots) in Asia in 2009 and moves to Africa in 2010. In 2011, hot spots become strongly clustered in Africa. Some of the hot spots moved back to Asia again in 2012. In
2013, the hot spots in Asia disappeared and hot spots in Africa become less but more concentrated. On the other hand, the hot spot map of all five years shows that the hot spot is in Africa and the cold spot is in the United States. Refer to figure 4 for hot spot analysis of Measles.
4.4 Ordinary Least Squares (OLS)
Figure 4. Hot spot analysis of measles
Figure 5. OLS scatter plot of independent variables. Gini vs. case rate (left), expenditure vs. case rate (middle), vaccine rate vs. case rate (right)
Figure 6. OLS results with interpolation
Figure 7. OLS results without interpolation
Firstly, the sign of the coefficients are not all expected. The sign of health expenditure rate is expected in both cases since it is negative which should correspond to increased spending on healthcare leading to better access to healthcare and less likelihood of becoming infected by measles. The Gini index indicates fairness in dispersion of income distribution. A Gini coefficient of zero expresses perfect equality and a coefficient of one expresses maximal inequality; thus, one would expect the lower the Gini Index the less people will be infected. This is the case for the OLS model with interpolation but not for the other model. The coefficients for vaccine rate disagree with each other as well. A negative sign is expected since more people vaccinated are expected to lead to less infection. However, the OLS model without interpolation has a positive sign.
Secondly, There is no redundancy in either of the models because the VIF[c] values are both lower than 7.5.
Thirdly, the results of t-test suggest that the coefficients for the independent variables are not significantly different than 0 since the greatest difference is less than 1.4.
Fourthly, the Jarque-Bera statistic is greater than 0.05 in both models, which means it is not significant. This suggests that the model is not misspecified or no key variable is missing from any of the models.
Fifthly, the adjusted R2 is a small negative number for both of models, which indicates that the dependent variable is not being explained by the independent variables at all.
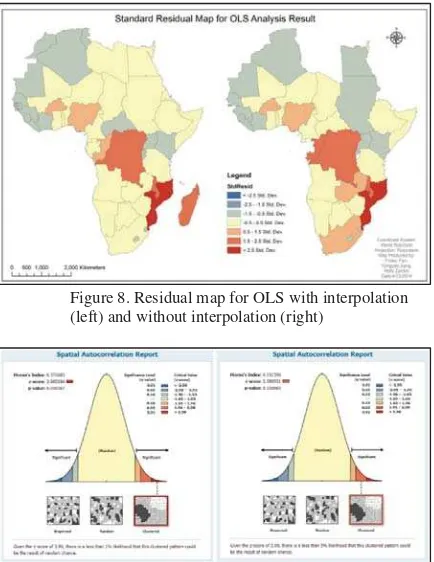
Figure 8. Residual map for OLS with interpolation (left) and without interpolation (right)
Figure 9. Spatial autocorrelation report for OLS with Interpolation (left) and without interpolation (right)
5. CONCLUSION
The most notable limitation is the dataset, which was retrieved from the Council on Foreign Relations, followed by the nature of working with a global dataset, and joining the points to polygons, which reduced the overall observations to fifty.
The initial consideration behind using this specific dataset was to reproduce the maps within the news report and then examine their claim that there is a resurgence of vaccine-preventable disease due to declining vaccine rates. It was quickly determined that global examination would prove difficult due to the nature of the global dataset as well as reporting inconsistencies among the countries. Exploration of variables in Africa was chosen based on the results of hot spot analysis. However, by joining disease case points to country polygons in Africa, the number of observations was minimized to fifty, which is too few for analysis using geographically weighted regression.
Based on inconsistent results compared to extensive literature reviews and the news report, it is anticipated that the data collection process used by the Council on Foreign Relations may be unreliable and inaccurate. Nonetheless, results from both reports indicate highly mobile disease diffusion largely initiating in Africa and the Near East and expanding outward over time. Of notable exception is whooping cough, which appears to be highly mobile and capable of easily expanding and retreating from year to year; this may be a disease to investigate further precisely due to this extreme variability.
In conclusion, if future analysis were to ensue, attempts would be made to minimize error by retrieving data from an alternate source, such as the WHO Monitoring System for
Vaccine-Preventable Disease. By running analyses again with a more standardized approach to data collection, it is believed that the results would be more representative of the literature, or at least there would be more confidence in the overall analysis. Another independent variable for consideration would be comparing rural/urban population. Also, more attention would be given to a more specific area within Africa to explore local versus regional clustering that was not explicitly explored in this analysis.
REFERENCES
Centers for Disease Control and Prevention (2014). Vaccine-Preventable Diseases and the Vaccines that Prevent Them. Last updated January 2014. Retrieved 5 March 2014 from: http://www.cdc.gov/vaccines/parents/downloads/parent-ver-sch-0-6yrs.pdf.
Cherry, J. D. (2012). Epidemic Pertussis in 2012—the Resurgence of a Vaccine-Preventable Disease. New England Journal of Medicine, 367(9), 785-787, retrieved 5 April 2014 from: http://www.nejm.org/doi/full/10.1056/nejmp1209051.
Council on Foreign Relations (2014). Vaccine-Preventable Outbreaks. Retrieved 5 March 2014 from www.cfr.org/interactives/GH_Vaccine_Map/index.html#map. Filmer, D., & Pritchett, L. (1999). The Impact of Public Spending on Health: Does Money Matter?. Social science & Medicine, 49(10), 1309-1323. Retrieved 15 April 2014 from: http://www.ncbi.nlm.nih.gov/pmc/articles/PMC2305684/pdf/bull who00391-0020.pdf.
Goto K, Kumarendran B, Mettananda S, Gunasekara D, Fujii Y, et al. (2013). Analysis of Effects of Meteorological Factors on Dengue Incidence in Sri Lanka Using Time Series Data. PLoS ONE 8(5): e63717. Retrieved 15 April 2014 from: http://www.plosone.org/article/info%3Adoi%2F10.1371%2Fjour nal.pone.0063717#pone-0063717-g006.
Gupta, S., Verhoeven, M., & Tiongson, E. (1999). Does Higher Government Spending Buy Better Results in Education and Health Care? International Monetary Fund.
Hinman, A. R., Orenstein, W. A., Schuchat, A., & Centers for Disease Control and Prevention (CDC). (2011). Vaccine-Preventable Diseases, Immunizations, and MMWR: 1961-2011. MMWR Surveillance Summary, 60(Suppl 4), 49-57.
Hinman, S. E., Blackburn, J. K., & Curtis, A. (2006). Spatial and Temporal Structure of Typhoid Outbreaks in Washington, DC, 1906–1909: Evaluating Local Clustering With the Gi* Statistic. International Journal of Health Geographics,5(1), 13. Retrieved 5 March 2014 from: http://www.ij-healthgeographics.com/content/5/1/13.
Hu, M., Li, Z., Wang, J., Jia, L., Liao, Y., Lai, S., ... & Yang, W. (2012). Determinants of the incidence of Hand, Foot and Mouth Disease in China Using Geographically Weighted Regression Models. PloS One, 7(6). Retrieved 15 April 2014 from: http://www.plosone.org/article/info%3Adoi%2F10.1371%2Fjour nal.pone.0038978#pone-0038978-g003.
of Health Care, Survival and Health Outcomes in Ghana. Journal of Health Economics,15(3), 333-357. Retrieved 15 April 2014 from:
http://www.sciencedirect.com/science/article/pii/01676296950 00216.
Markieta, M. (2013). Spatial Analysis. Global Connectivity Revisited, Mapping Out Flight Routes, retrieved 6 April 2014 from: http://www.spatialanalysis.ca/2011/global-connectivity-mapping-out-flight-routes/.
Meheus, F., & Van Doorslaer, E. (2008). Achieving Better Measles Immunization in Developing Countries: Does Higher Coverage Imply Lower Inequality?. Social Science & Medicine, 66(8), 1709-1718. Retrieved 30 March 2014 from: http://www.sciencedirect.com/science/article/pii/S0277953607 006508.
Meissner, H. C., Strebel, P. M., & Orenstein, W. A. (2004). Measles Vaccines and the Potential for Worldwide Eradication of Measles. Pediatrics, 114(4), 1065-1069. Retrieved 30 March
2014 from: http://pediatrics.aappublications.org/content/114/4/1065.short.
National Public Radio, How Vaccine Fears Fueled the Resurgence of Preventable Diseases, aired 25 January 2014, retrieved 25 January 2014 from
www.npr.org/blogs/health/2014/01/25/265750719/how-vaccine-fears-fueled-the-resurgence-of-preventable-diseases. Samphutthanon, R., Tripathi, N. K., Ninsawat, S., & Duboz, R. (2013). Spatio-Temporal Distribution and Hotspots of Hand, Foot and Mouth Disease (HFMD) in Northern Thailand. International Journal of Environmental Research and Public Health, 11(1), 312-336.
World Bank Data Indicators. (2014). Health Indicators. Retrieved 30 March 2014 from: http://data.worldbank.org/indicator#topic-8.
World Health Organization. Monitoring System for Vaccine-Preventable Disease. Health Indicators. Retrieved 10 April 2014 from:
http://apps.who.int/immunization_monitoring/globalsummary/t imeseries/tscoveragebcg.html.
World Health Organization. Monitoring System for Vaccine-Preventable Disease. Retrieved 10 April 2014 from: http://apps.who.int/immunization_monitoring/globalsummary/c ountries?countrycriteria%5Bcountry%5D%5B%5D=ZAF&co mmit=OK.
World Health Organization. Vaccine-Preventable Diseases: Monitoring System 2013 Global Summary. Retrieved 6 April
2014 from: http://www.who.int/immunization/monitoring_surveillance/rou