Estimating the Influence of Accident Related Factors on
Motorcycle Fatal Accidents using Logistic Regression
(Case Study: Denpasar-Bali)
Wedagama, D.M.P.1)
Abstract: In Denpasar the capital of Bali Province, motorcycle accident contributes to about 80% of total road accidents. Out of those motorcycle accidents, 32% are fatal accidents. This study investigates the influence of accident related factors on motorcycle fatal accidents in the city of Denpasar during period 2006-2008 using a logistic regression model. The study found that the fatality of collision with pedestrians and right angle accidents were respectively about 0.44 and 0.40 times lower than collision with other vehicles and accidents due to other factors. In contrast, the odds that a motorcycle accident will be fatal due to collision with heavy and light vehicles were 1.67 times more likely than with other motorcycles. Collision with pedestrians, right angle accidents,and heavy and light vehicleswere respectively accounted for31%, 29%, and 63% of motorcycle fatal accidents.
Keywords: fatal accidents, logistic regression, motorcycle.
Introduction
Motorcycle is widely used as the main mode of transportation in Indonesia including Bali Province. Motorcycle in Bali is reported for almost 85% of the total registered vehicles with an average annual growth rate of approximately 11% [1]. Meanwhile, in the capital city, Denpasar, the number of registered motorcycles was 390,000 of the total number of 457,000 registered vehicles in 2007. Furthermore, during the daytime on weekdays, the number of vehicles tends to double to about 800,000 units considering trips make by commuters and students to and from Denpasar [1].
It is a common view in Bali that three main transportation modes; private cars, heavy vehicles (bus and truck), and motorcycles share the roadways including highways. Commuters use the highways, which connects the capital city and the surrounding areas. Consequently, all these roads passed daily high traffic flows in which approximately 70% are motorcycle.
The majority of motorcycles on the road are small-size motorcycles with engine capacity ranges between 100-150 cc. These small-size motorcycles have very high mobility on the road.
1 Department of Civil Engineering, Faculty of Engineering, Udayana University, Bukit Jimbaran – Bali, Indonesia
Email: [email protected]
Note: Discussion is expected before November, 1st 2010, and will be published in the “Civil Engineering Dimension” volume 13, number 1, March 2011.
Received 29 September 2009; revised 5 April 2010; accepted 1 May 2010.
People use motorcycles for many purposes including work, shopping, leisure, and education either for short or long distance trips. For instance, students use motorcycles during weekdays for a return trip of 55 km between the capital city of Denpasar and a university in Jimbaran, Southern Bali. This is mainly due to poor quality of the current public transport services. On the other hand, a motorcycle is more practical to cope with traffic congestion and more efficient in comparison with private cars or public transport.
As there are no special lanes dedicated to motorcycle, there are always conflicts on the road amongst the three modes. The behavior of motorcycle users such as speeding and maneuvering among vehicles to get ahead, worsened traffic condition and is not favorable in terms of road safety. This may lead to high proportion of motorcycle accidents and casualties. In fact, during the period of 2003-2007 there were 4489 road accidents and 8498 casualties in Bali in which almost 60% involving fatal and seriously injured casualties. Of these road accidents, on average 70% of which involve motorcycles [2]. A motorcyclist in Bali, therefore, could be regarded as a vulnerable road user.
In the city of Denpasar, during the period of 2006-2008 there were 676 accidents involving motorcycle, which accounted for about 67% of total road accidents [2].Of those accidents, 32% were motorcycle fatal accidents. Motorcycle fatal accident is defined as at least one motorcyclist died on the event of road accidents [2].
⎟⎟
case study area. This paper aimed at examining several accident related factors contributing to motorcycle fatal accidents in the city of Denpasar, Bali Province, using a logistic regression. The accident related factors were obtained from the local police accident reports.
Literature Review
Previous Studies
Many studies have been carried out to estimate motorcycle accidents in both developed and developing countries [3-7]. There are significant differences between motorcyclists in developing and developed countries. For example, pillion passengers are very uncommon in western countries. In addition, motorcycles in developing countries are more popular for commuting or utilitarian trips as opposed to recreational trips [3].
A study conducted in the United Kingdom (UK) [4] described growth of scooter and motorcycle corresponded to the increase in fatal and serious injuries. The study concluded that junction influenced significantly motorcycle accidents. This is mostly because older drivers have difficulties in identifying approaching motorcycles. Other significant factors influencing motorcycle accident included accident location (on bends), collision when overtaking vehicle(s) and skills of young and inexperienced motorcyclists and older motorcyclists.
Meanwhile, a study also conducted in the UK focusing on motorcyclist’ behavior and accidents [5]. The study found that speed was significantly related to motorcycle accident. In addition, errors and not violations dominantly influenced motorcycle accident. These because motorcyclists were likely to make errors during their trip due to the relative instability of a motorcycle. This study’s suggestions included reducing the errors by changing and improving the riding style. This could be achieved by doing appropriate training and making motorcyclists aware of the risk of doing such errors. Other related studies, however, were more concerned on helmet and motorcycle accidents and casualties [6,7].
A study conducted in Saudi Arabia [8] applied a logistic regression to investigate the influence of accident factors on fatal and non fatal accidents for motor vehicle in Saudi Arabia. The study found that accident location and cause of accident significantly associated with fatal accidents. Accident factors used in the study including accident location, accident type, collision type, accident time, accident cause, driver age at fault, vehicle type, nationality, and license status.
Logistic regression has been considered as an appropriate method of analysis to compare severity of affecting factors between young and older drivers involved in single-vehicle accidents [9]. The study found that factors influencing accidents of both driver groups were the same, except alcohol and drugs as the significant factors for older drivers accidents. Factors influencing young and older drivers’ accidents included speeding and non-usage of a restraint device. In addition, ejection and existence of curve/grade significantly influenced higher young driver accident severity at all levels. Meanwhile, a frontal impact point was the main significant factor for older drivers accidents at all levels.
Logistic Regression Model
Logistic regression is useful for predicting a binary dependent variable as a function of predictor variables [10]. The goal of logistic regression is to identify the best fitting model that describes the relationship between a binary dependent variable and a set of independent or explanatory variables. The dependent variable is the population proportion or probability, P, that the resulting outcome is equal to one. Parameters obtained for the independent variables can be used to estimate odds ratios for each of the independent variables in the model [10].
The specific form of the logistic regression model is:
π(x) = P = B Bx
The transformation of conditional mean π(x) logistic function is known as the logit transformation. The logit is the LN (to base e) of the odds, or likelihood ratio that the dependent variable is one, such that
Logit (P) = LN
⎟⎟
Bi = the parameter estimates for the independent variables
Xi = set of independent variables (i = 1, 2,...,n)
P = probability ranges from 0 to 1
LN = the natural logarithm ranges from negative infinity to positive infinity
The logistic regression model accounts for a curvilinear relationship between the binary choice P
is approximately linear in the middle range and logarithmic at extreme values. A simple transfor-mation of Equation (1) yields:
⎟⎟
The fundamental equation for the logistic regression shows that when the value of an independent variable increases by one unit, and all other variables are held constant, the new probability ratio [Pi/(1-Pi)] is given as follows:
⎟⎟
When independent variables X increases by one unit, with all other factors remaining constant, the odds [Pi/(1-Pi)] increases by a factor eBi. This factor is called the odds ratio (OR) and ranges from 0 to positive infinity. It indicates the relative amount by which the odds of the outcome increases (OR>1) or decreases (OR<1) when the value of the corresponding independent variable increases by one unit.
In logistic regression, there is no true R2 value as
there is in Ordinary Least Squares (OLS) regression. Alternatively, Pseudo R square can approximate an R-squared based on lack of fit indicated by the deviance (-2LL) as shown in Equations (5) and (6). In this study, there are two versions of Pseudo-R2, one
is Cox & Snell Pseudo-R2 and the other is
Nagelkerke Pseudo-R2 [11].
Cox & Snell Pseudo-R2 = R2 = 1 -
Where the null model is the logistic model with just the constant and the k model contains all predictors in the model. The Cox & Snell Pseudo-R2 value
cannot reach 1.0, however Nagelkerke Pseudo-R2
value can be used to modify it.
Nagelkerke Pseudo-R2 = R2 =
A common method, which is also used to measure the goodness of fit is Hosmer-Lemeshow Test [10]. The null hypothesis for this test is that the model fits the data, and the alternative is that the model does not fit. The test statistic is constructed by first breaking the data set into roughly ten groups. The groups are formed by ordering the existing data by the level of their predicted probabilities. The data are first ordered from least likely to have the event to most likely for the event. Then equal sized groups
are formed, the observed and expected number of events is computed for each group. The statistic test is,
If the observed number of events differs from what is expected by the model, the H-L test will be large and there will be evidence against the null hypothesis.
Case Study Area and Data Description
Case Study Area
Province of Bali has an area of 5,634.40 km2 and a
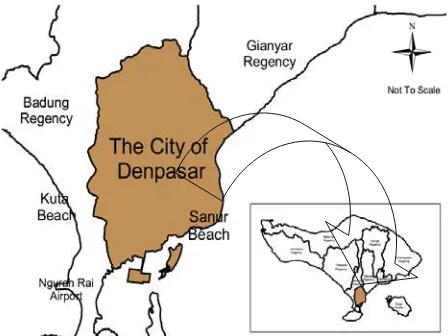
population of about 3.4 million. The island is widely known as a tourist destination. Most popular tourist destinations are located in Southern areas including Kuta, Sanur, and Nusa Dua. Therefore, these areas are the most densely populated than any other parts of Bali. The capital city, Denpasar, is also located in the Southern Bali as shown in Figure 1. Denpasar has an area of 127 km2 with the population of
608,595[1].
Figure 1. Case Study Area – The City of Denpasar
Data Description
this declining motorcycle accident perhaps because of the safety riding campaign in Bali which commenced in 2007. The proportion of motorcycle fatal accidents for 2006, 2007 and 2008 were 38%, 29% and 32% respectively. Thus, the average motorcycle fatal accident was 33% during the period of 2006-2008.
0
Figure 2. Motorcycle Accidents in The City of Denpasar
Model Development
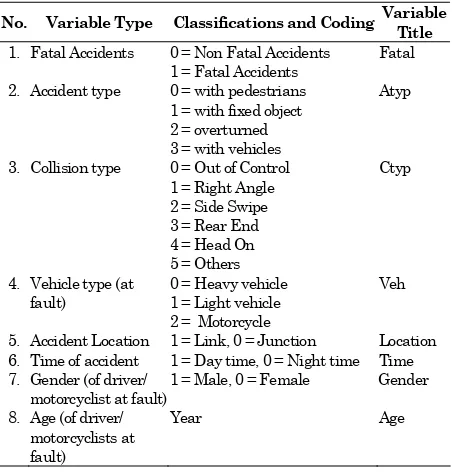
Data availability has been the primary consideration in determining independent variables for this study. All variables mentioned in Table 1 were obtained from the police. This study attempted to consider all relevant factors influencing motorcycle fatal accidents, despite the shortcoming of existing accident data in Bali. Some of accident related factors employed as the independent variables in this study (i.e. variables type no. 2 - 6 in Table 1) followed the method used by a previous study conducted in Saudi Arabia [8]. Furthermore, following suggestions from previous studies [12,13] age and gender have long been a high priority in accident risk assessment. Therefore, age and gender of driver or motorcyclist at fault were also considered as independent variables. As the results, variable types no. 2 – 8 in Table 1 are employed as the independent variables in this study. All independent variables are categorical, except age which is a continuous variable. Meanwhile, the dependent variable is fatal accidents, which is binominal in nature.
In order to represent categorical variables, dummy variables are created following the coding system in SPSS [14] software used in this study. The categorical variables have several levels, so that they require the use of dummy variables defined as 0, 1, 2, 3, and so forth. This coding system is applied for the rest of categorical variables as shown in Table 1. It should be noticed that the SPSS is able to carry out this coding automatically once the end user has set the levels of the categorical variables.
Table 1. Variables Selected for the Study
No. Variable Type Classifications and Coding Variable Title
1. Fatal Accidents 0 = Non Fatal Accidents 1 = Fatal Accidents
Fatal 7. Gender (of driver/
motorcyclist at fault)
1 = Male, 0 = Female Gender
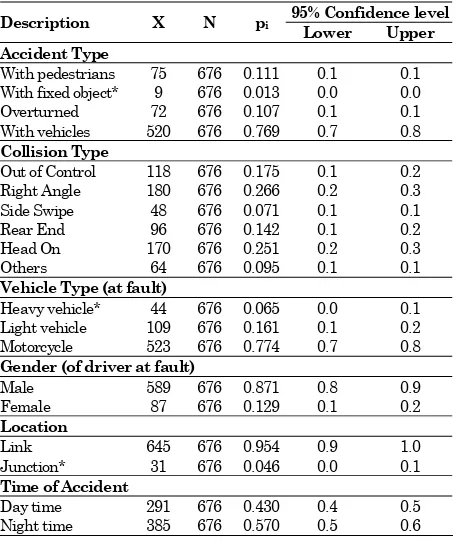
According to data related statistics shown in Table 2, some variable classifications can be neglected because of their small proportion. The hypothesis testing technique for proportions was used in this study to test whether a classification could be reduced [8,10]. The following typical test was used: H0: pi = 0 and, (8)
Ha: pi
≠
0,where,
H0 = Null hypothesis (a classification can be
neglected because of small proportion)
Ha = Alternate hypothesis (a classification can not
be neglected)
pi is the proportion of an independent variable
classification.
If the pi is significantly different from zero and falls
in the rejection region at the 5% significance level, the null hypothesis is rejected. On the other hand, of the pi is sufficiently close to zero, the null hypothesis
is accepted [10].
Based on the test, for motorcycle fatal accident analysis, there are three accident factors excluded from the model development stage, those are (marked with star in Table 2); ‘accident type-with fixed object’, ‘vehicle type at fault-heavy vehicle’, and ‘accident location-junction’. The proportions of these classifications are statistically close to zero and have small proportions. Consequently, they can be excluded from model development stage [10].
the accident type factor, ‘with-fixed object’ is merged with another significant factor ‘overturned’. This is based on the assumption that these two factors could be considered as a single accident. In addition, ‘heavy vehicle’ and ‘light vehicle’ are merged together and generated as a new classification ‘heavy and light vehicles’. The location factor ‘junction’ is not used as predictors considering that statistically most of fatal accidents occurred on road link.
Table 2. Hypothesis Testing: Data Statistics
95% Confidence level Description X N pi
Lower Upper
Accident Type
With pedestrians 75 676 0.111 0.1 0.1 With fixed object* 9 676 0.013 0.0 0.0 Overturned 72 676 0.107 0.1 0.1 With vehicles 520 676 0.769 0.7 0.8
Collision Type
Out of Control 118 676 0.175 0.1 0.2 Right Angle 180 676 0.266 0.2 0.3 Side Swipe 48 676 0.071 0.1 0.1 Rear End 96 676 0.142 0.1 0.2 Head On 170 676 0.251 0.2 0.3
Others 64 676 0.095 0.1 0.1
Vehicle Type (at fault) Heavy vehicle* 44 676 0.065 0.0 0.1 Light vehicle 109 676 0.161 0.1 0.2
Motorcycle 523 676 0.774 0.7 0.8
Gender (of driver at fault)
Male 589 676 0.871 0.8 0.9
Female 87 676 0.129 0.1 0.2
Location
Link 645 676 0.954 0.9 1.0
Junction* 31 676 0.046 0.0 0.1
Time of Accident
Day time 291 676 0.430 0.4 0.5 Night time 385 676 0.570 0.5 0.6 * Statistically insignificant at the 5% level; the 95%
confidence limits include 0.
where: X = number of classification (yes=1), N = sample size
The entry method of logistic regression was followed using SPSS version 15 [14]. The Omnibus Test [14,15] of motorcycle fatal accidents model coefficients is analysed in order to assess whether the data fit the model as shown in Table 3. In the table, the specified model is significant (Sig. < 0.05) so it is concluded that the independent variables improve on the predictive power of the null model.
Table 3. Omnibus Test of Model Coefficients
Motorcycle fatal accidents Chi-square Sig.
Step 64.859 .000
Block 64.859 .000
Model 64.859 .000
Table 4 contains the two pseudo R2 measures that
are Cox & Snell and Nagelkerke. The former measure frequently has a maximum less than one. It
is therefore usually better to assess Nagelkerke’s measure as this divides Cox & Snell by the maximum to give a measure that really does range between zero and one. In this example, the motorcycle fatal accident model explains 13% of the variance in the dependent variable. In addition, in Table 4 Hosmer-Lemeshow (H-L) test shows the significance of the developed logistic regression models (Sig. > 0.05).
Table 4. Goodness of Fit (Pseudo R2 and H-L Test)
Pseudo R2 Test Fatal Accidents
Model -2 Log likelihood
Cox & Snell R Square
Nagelkerke R Square Motorcycle 785.182 0.091 0.128
Hosmer and Lemeshow Test (H-L Test)
Chi-square df Sig.
Motorcycle 0.765 8 0.999
Results and Discussions
The model results as shown in Table 5 indicates that at 95% confidence level, collision with pedestrians and right angle accidents were negatively related to motorcycle fatal accidents, while heavy and light vehicles were positively related to motorcycle fatal accidents.
Table 5. Significant Factors Influencing Motorcycle Fatal Accidents
Motorcycle fatal accidents
Variables B Sig. Exp(B)
Atyp(1) -0.829* 0.046 0.437
Atyp(2) 0.619 0.087 1.858
Ctyp(1) 0.598 0.115 1.818
Ctyp(2) -0.930* 0.033 0.394
Ctyp(3) -0.934 0.086 0.393
Ctyp(4) -0.259 0.573 0.772
Ctyp(5) -0.534 0.221 0.586
Time(1) -0.023 0.900 0.977
Age -0.006 0.457 0.994
Gender(1) 0.065 0.805 0.937
Veh(1) 0.513* 0.014 1.670
Constant -0.456 0.145 0.634
- Bold figures are significant at 95%, Where
Atyp(1) = with pedestrians
Atyp(2) = with fixed object + overturned Ctyp(1) = Out of Control
Ctyp(2) = Right Angle
Ctyp(3) = Side Swipe
Ctyp(4) = Rear End
Ctyp(5) = Head On
Time(1) = Night time
Age = Age (at fault)
Gender(1) = Female
Veh(1) = Heavy + Light vehicle
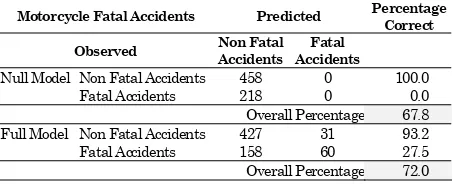
accuracy of the model. Overall, the percentages have increased from 67.8 for the null model to 72.0 for the full model.
Table 6. Classification Accuracy
Motorcycle Fatal Accidents Predicted Percentage
Correct
Observed Non Fatal
Accidents Fatal Accidents
Null Model Non Fatal Accidents 458 0 100.0
Fatal Accidents 218 0 0.0
Overall Percentage 67.8 Full Model Non Fatal Accidents 427 31 93.2
Fatal Accidents 158 60 27.5
Overall Percentage 72.0
The results indicate that collision with pedestrians and right angle accidents are less likely to influence motorcycle fatal accidents than collision with other vehicles and accidents due to other factors respectively. On the other hand, heavy and light vehicles are more likely to influence motorcycle fatal accidents than motorcycles.
The odds that a motorcycle accident will be fatal due to collision with pedestrians and right angle accidents are about 0.44 and 0.40 times respectively lower than for collision with other vehicles and accidents due to other factors. Collision with pedestrians and right angle accidents are accounted only for 31% and 29% respectively to influence motorcycle fatal accidents. In other words, collision with other vehicles, and accidents due to other factors contribute more on motorcycle fatal accidents in the city of Denpasar.
In contrast, the odds that a motorcycle accident will be fatal due to collision with heavy and light vehicles were 1.67 times more likely than with other motorcycles. This indicated that collision with heavy and light vehicles influenced 63% motorcycle fatal accidents.
Right angle accidents as one of the significant factors is consistent with a past study conducted in Saudi Arabia [8]. Right angle accidents in Saudi Arabia were common cause of accidents especially at junction. The main reason was that motorists and motorcyclist behavior which failed to give way to other motorists [8]. Similarly, this sort of motorist behavior is common in the city of Denpasar. More campaign such as introducing the risk of ‘fail to yield’ violation especially for motorcyclist is required to reduce such behaviour. In addition, such a violation may influence collision with pedestrians, in particular, when crossing the road. Meanwhile, accidents due to other factors are significantly higher than right angle accidents in contributing to motorcycle fatal accidents. Accident because of other causes, however, would imply broad range of factors
which have not been thoroughly recorded within the accident data. Therefore, further works including data elaboration and improvement on accident recording system by the police are required before suggesting action plan to prevent accident because of other causes.
In relation to collision with other vehicles and collision with heavy and light vehicles can probably be explained by the fact that in typical mixed traffic, motorcycles shared the roadways together with heavy and light vehicles, in which motorcycles are the most vulnerable ones. Introducing special lane for motorcycle along the road link and enforcing safety riding program for motorcyclists including awareness to use the left lane, can be used to reduce fatal accidents.
Conclusions
This study employs a logistic regression technique to investigate the influence of accident factors on motorcycle fatal accidents on arterial roads in the city of Denpasar, Bali Province.Based on the State Police of Bali Province accident data during the period of 2006-2008, seven predictor variables are employed in the model development.
The analyses show that the odds that a motorcycle accident will be fatal due to collision with pedestrians and right angle accidentsare about 0.44 and 0.40 times respectively lower than for collision with other vehicles and accidents due to other factors. In contrast, the odds that a motorcycle accident will be fatal due to collision with heavy and light vehicles are 1.67 times more likely than collision with other motorcycles. Collision with pedestrians, right angle accidents and heavy and light vehiclesare accounted for 31%, 29% and 63% respectively to influence motorcycle fatal accidents.
The result of this study could be used to develop strategies to prevent and reduce fatal accidents in particular for motorcyclists in Bali. These strategies include introducing special lane for motorcycle along the road link and enforcing safety riding program for motorcyclists including awareness to use the left lane. In addition, further works including data elaboration and improvement on accident recording system by the police are required before recommending action plan to prevent an accident because of other causes.
References
1. Statistics of Bali Province, Bali in Figures, 2008.
3. Quddus, M.A., Noland, R.B., and Chin, H.C., An Analysis of Motorcycle Injury and Vehicle Damage Severity using Ordered Probit Models,
Journal of Safety Research, Vol. 33, 2002, pp. 445-462.
4. Clarke, D.D., Ward, P., Bartle, C., and Truman, W., In-depth Study of Motorcycle Accident, Road Safety Research Report No. 54, Department for Transport, UK, 2004.
5. Elliot, M.A., Sexton, B., and Keating, S.L.,
Motorcyclist’s Behaviour and Accidents, Safety Group, Transport Research Laboratory Limited, UK, 2004.
6. Ichikawa, M., Chadbunchachai, W., and Marui, E., Effect of The Helmet Act for Motorcyclists in Thailand, Accident Analysis and Prevention, Vol. 35, 2003, pp. 183–189.
7. Keng, S.H., Helmet Use and Motorcycle Fatalities in Taiwan, Accident Analysis and Prevention,
Vol. 37, 2005, pp. 349–355.
8. Al-Ghamdi, A.S., Using Logistic Regression to Estimate the Influence of Accident Factors on Accident Severity, Accident Analysis and Prevention, Vol. 34, 2002, pp. 729-741.
9. Dissanayake, S., Comparison of Severity Affecting Factors Between Young and Older Drivers Involved in Single Vehicle Crashes, IATSS Research ,Vol.28, No.2, 2004, pp. 48-54.
10.Washington, S.P., Karlaftis, M.G., and Mannering, F.L., Statistical and Econometric Methods for Transportation Data Analysis, Chapman & Hall, USA, 2003.
11.Charnkol, T., Hanaoka, S., and Tanaboriboon, Y., Emergency Trip Destination of Evacuation as Shelter Analysis for Tsunami Disaster: A Case Study in Phuket, Thailand, Journal of the Eastern Asia Society for Transportation Studies, Vol.7, 2007, pp. 853-868.
12.O’Donnel, C.J. and Connor, D.H., Predicting the Severity of Motor Vehicle Accident Injuries using Models of Ordered Multiple Choice, Accident Analysis and Prevention, Vol. 28, No.6, 1996, pp. 739-753.
13.Kockelman, K.M. and Kweon, Y-J., Driver Injury Severity: An Application of Ordered Probit Models, Accident Analysis and Prevention, Vol. 34, 2002, pp. 313- 321.
14.Chan, Y.H., Biostatistics 202. Logistic Regression Analysis. Singapore Med J, Vol. 45, 2004, pp.149-153.