Abstract
There were about 86.62% motorcycle accidents of all road accidents during period 2003-2008 in Tabanan regency, Bali Province. Of those motorcycle accidents, 50% included motorcycle fatal accidents. This study investigates the influence of accident related factors on motorcycle fatal road accidents during period 2003-2008 in the Regency of Tabanan, Bali, using logistic regression technique.Based on accident data, eight predic-tor variables were employed in the developed models. The study found that the odds of mopredic-torcycle fatal accident due to motorists failed to yield and collision with light vehicles were both about 0.4 times lower than for acci-dent due to other causes and collision with motorcycles respectively. Thus, the probabilities of failed to yield and light vehicle were about 30% and 28% respectively contributing on motorcycle fatal accidents.
Keywords: Motorcycle,fatal accidents, logistic regression.
Abstrak
Kecelakaan lalu lintas yang melibatkan sepeda motor berkisar 86,62% dari seluruh kecelakaan lalu lintas yang terjadi selama periode tahun 2003-2008 di Kabupaten Tabanan, Provinsi Bali. Dari kecelakaan lalu lintas yang melibatkan sepeda motor tersebut, 50% merupakan kecelakaan fatal. Pada studi ini, regresi logistik digunakan untuk analisis faktor-faktor yang mempengaruhi kecelakaan fatal yang melibatkan sepeda motor dalam kurun waktu tahun 2003-2008 di Kabupaten Tabanan, Provinsi Bali. Dari data kecelakaan lalu lintas, delapan varia-bel penduga digunakan pada penyusunan model. Hasil analisis memperlihatkan bahwa kecelakaan fatal akibat pengendara kendaraan bermotor tidak memberikan prioritas kepada pengguna jalan lainnya dan akibat tabra-kan dengan kendaraan ringan mempunyai odds yang sama yaitu 0,4 kali lebih rendah dibandingtabra-kan kecelakaan karena sebab-sebab lainnya dan kecelakaan akibat tabrakan dengan sepeda motor. Peluang dari pengendara kendaraan bermotor tidak memberikan prioritas kepada pengguna jalan lainnya dan tabrakan dengan kenda-raan ringan adalah berturut-turut sebanyak 30% dan 28% dalam mempengaruhi terjadinya kecelakaan fatal yang melibatkan sepeda motor.
Kata-kata Kunci: Sepeda motor, kecelakaan fatal, regresi logistic.
Predicting The Influence of Accident Related Factors
on Motorcycle Fatal Accidents Using Logistic Regression
(Case Study : Tabanan, Bali)
D. M. Priyantha Wedagama
Department of Civil Engineering, Faculty of Engineering, Udayana University Bukit Jimbaran – Bali, Indonesia 80361, E-mail: [email protected]
Jurnal Teoretis dan Terapan Bidang Rekayasa Sipil Jurnal Teoretis dan Terapan Bidang Rekayasa Sipil
1. Introduction
The motorcycle is notable as the most popular mode of transportation in Indonesia including Bali Province. Motorcycle has an average annual growth rate of approximately 11% and is accounted for almost 85% of the total registered vehicles in Bali. The census data showed that there were 1,166,694 motorcycles of the total 1,377,352 registered vehicles in 2007 (Statistics of Bali Province, 2008). In the capital city of Denpasar, the number of registered motorcycles was 390,000 of the total number of 457,000 registered vehicles in 2007. Furthermore, during the daytime on weekdays, the number of vehicles tends to be doubled
about 800,000 units considering trips make by commuters and students to and from Denpasar (Statistics of Bali Province, 2008).
such a poor quality of the current public transport services, while in contrast a motorcycle is a lot easier overcoming traffic congestion and more efficient compared with either private cars or public transport.
In Bali, three main modes including private cars, heavy vehicles (bus and truck) and motorcycles share together the roadways including arterial roads. As the results, there are always conflicts on the road amongst the three modes. Moreover, the behaviour of motorcycle users such as speeding and maneuvering among vehicles to get ahead worsened traffic condition is not favorable in terms of road safety. This may lead to high proportion of motorcycle accidents and casualties. In fact, during period 2003-2007 there were 4489 road accidents and 8498 casualties in Bali in which almost 60% involving killed and seriously injured casualties. Of these road accidents, on average there were 70% motorcycle acci-dents (State Police of Bali Province, 2008). A motorcy-clist in Bali, therefore, could be regarded as a vulnerable road user.
In Tabanan regency, during period 2003-2008 there were 518 motorcycle accidents which accounted for about 86.62% of total road accidents (State Police of Bali Province, 2008). Of those accidents, 50% were motorcycle fatal accidents. With regard to this high proportion of motorcycle fatal accidents, Tabanan regency is chosen as a case study area. This paper aimed at examining several accident related factors contributing to motorcycle fatal accidents in the Regency of Tabanan in Province of Bali. As the accident related factors were obtained from the local police accident reports during period 2003-2008, the investigation has been conducted using secondary data.
2. Literature Review
2.1 Previous studies
Many studies have been carried out to estimate motor-cycle and motor vehicle accidents in both developed and developing countries. In this section, the review is more on motorcycle than motor vehicle because there are significant differences between motorcyclists in developing and developed countries. For example, pillion passengers are very uncommon in western countries. In addition, motorcycles in developing countries are more popular for commuting or utilitarian trips as opposed to recreational trips (Quddus, et al., 2002).
A study conducted by Clarke, et al. (2004) in the UK described that the increase in scooter and motorcycle sales has caused a corresponding increase in deaths and serious injuries caused to motorcyclists following a period of relative decline. Scooters had a 16% rise in sales between 2002–2003. The recent vehicle licensing records, larger motorcycles (above 500cc engine
capacity) have accounted for around half of all regis-tered motorcycles, in which this pattern seems to con-tinue further. Furthermore, significant differences were found in the sample with respect to the types of acci-dents involving motorcyclists (and their blameworthi-ness). The study concluded that, firstly there seems to be a particular problem surrounding other road users’ perception of motorcycles, particularly at junctions. Such accidents often seem to involve older drivers with relatively high levels of driving experience who nonetheless seem to have problems detecting approaching motorcycles. Secondly, motorcyclists themselves seem to have far more problems with other type of accidents, such as those on bends, and overtak-ing or ‘filterovertak-ing’ accidents. Thirdly, there have been two main groups of riders that interventions should be focused on. They included young and inexperienced riders of smaller capacity machines such as scooters, and older riders who were more experienced riders of higher capacity machines. Both the skills and attitudes of these riders need to be addressed.
Meanwhile, a study conducted in the UK focusing on motorcyclist’ behaviour and accidents (Elliot, et al., 2004). The study found that speed behaviour was sig-nificantly related to involvement in a 'blame' accident. In addition, errors and not violations were the domi-nant predictors of motorcyclists' accident-involvement. This situation was a reverse to car accident-involvement. The explanation for this difference might be that riding a motorcycle is more demanding than driving a car, thus motorcyclists may be more prone to making errors when riding than are car drivers when driving. More importantly, given the dynamics of motorcycling, the commission of an error when riding is likely to have more severe consequences than making an error when driving. For example, it is quite possible for a car driver to recover from making an error without losing control of the vehicle. However, the recovery from an error when riding a motorcycle is potentially more difficult due to the relative instability of a two-wheeled vehicle compared with a four-wheeled vehicle.
on helmet and motorcycle accidents and casualties, for instance a study by Ichikawa, et al. (2003) in Thailand and Keng (2005) in Taiwan.
Another study conducted by Al-Ghamdi (2002) applied Logistic Regression to investigate the influ-ence of accident factors on fatal and non fatal acci-dents for motor vehicle in Saudi Arabia. The study found that accident location and cause of accident sig-nificantly associated with fatal accidents. Accident factors used in the study including accident location, accident type, collision type, accident time, accident cause, driver age at fault, vehicle type, nationality and license status.
Furthermore, logistic regression has been considered as an appropriate method of analysis in a study conducted by Dissanayake (2004) to compare severity of affecting factors between young and older drivers involved in single-vehicle crashes. The study findings informs that almost all the common identified factors influenced both driver groups in the same manner except in the case of alcohol and drug usage in the case of crash severity of older drivers. Speeding and non-usage of a restraint device were the two most important factors affecting towards increased crash severity for both driver groups at all severity levels. Additionally, ejection and existence of curve/grade were determinants of higher young driver crash sever-ity at all levels. For older drivers, having a frontal im-pact point was a severity determinant at all levels.
In this paper, Logistic Regression model is employed as to deal with the binary nature of dependent variables such as fatal and non fatal accidents.
2.2 Logistic regression model
Logistic regression is useful for predicting a binary dependent variable as a function of predictor variables. The goal of logistic regression is to identify the best fitting model that describes the relationship between a binary dependent variable and a set of independent or explanatory variables. The dependent variable is the population proportion or probability (P) that the result-ing outcome is equal to 1. Parameters obtained for the independent variables can be used to estimate odds ratios for each of the independent variables in the model (Washington, 2003).
The specific form of the logistic regression model is:
The transformation of conditional mean π(x) logistic function is known as the logit transformation. The
π(x) = P = ratio that the dependent variable is 1, such that
Where:
Bo : the model constant
Bi : the parameter estimates for the independent variables
Xi : set of independent variables (i = 1,2,...,n)
P : probability ranges from 0 to 1
The logistic regression model accounts for a curvilin-ear relationship between the binary choice Y and the predictor variables Xi, which can be continuous or discrete. The logistic regression curve is approxi-mately linear in the middle range and logarithmic at extreme values. A simple transformation of Equation (1) yields
The fundamental equation for the logistic regression shows that when the value of an independent variable increases by one unit, and all other variables are held constant, the new probability ratio [Pi/(1-Pi)] is given
as follows:
When independent variables X increases by one unit, with all other factors remaining constant, the odds [Pi/(1-Pi)] increases by a factor expBi. This factor is
called the odds ratio (OR) and ranges from 0 to positive infinity. It indicates the relative amount by which the odds of the outcome increases (OR>1) or decreases (OR<1) when the value of the corresponding independent variable increases by 1 unit.
There is no true R2 value in logistic regression, as there is in Ordinary Least Squares (OLS) regression. Alternatively, Pseudo R2 can be a proxy of an R2 including Cox & Snell Pseudo-R2 and Nagelkerke Pseudo-R2.
1
: the natural logarithm ranges from negative infinity to positive infinityThe null model includes only the constant while the k model contains all explanatory variables in the model. Cox & Snell R2 value cannot reach 1.0, so that Nagelkerke is used to revise it.
A Hosmer-Lemeshow Test is used to carry out the goodness of fit measure. The null hypothesis for this test is that the model fits the data, and the alternative is that the model does not fit. The test statistic is con-ducted by first breaking the data set into roughly 10 groups. The groups are constructed by ordering the existing data by the level of their predicted probabili-ties. The data are ordered from least likely to most likely for the event. The equal sized groups are formed. From each group, the observed and expected number of events is computed for each group. The test statistic is,
Where:
= The Hosmer-Lemeshow test (H-L test)
Ok = Observed number of events in the kth group
Ek = Expected number of events in the kth group
vk = Variance correction factor for the kth group
If the observed number of events differs from what is expected by the model, the H-L test will be large and there will be evidence against the null hypothesis. Nagelkerke Pseudo-R2 = R2 =
3. Case Study Area and Data Description
3.1 Case study area
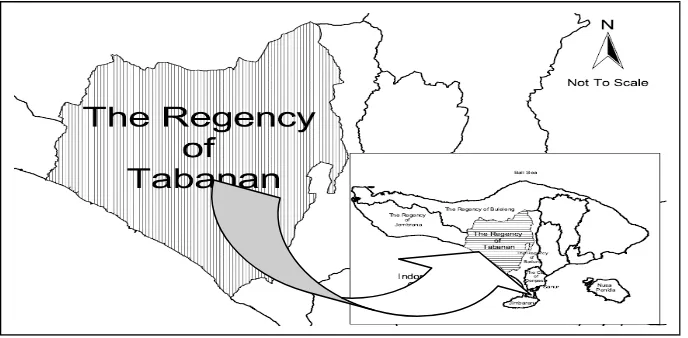
Province of Bali has an area of 5,634.40 km2 and a population of about 3.4 million. The island is widely known as a tourist destination. Most of popular tourist destinations are located in southern areas including Kuta, Sanur, and Nusa Dua. Therefore, these areas are the most densely populated than any other parts of Bali.
As shown in Figure 1, the regency of Tabanan is lo-cated in the south-west of Bali and bounded by the Regency of Badung and Jembrana to the east and the west respectively. It has an area about 850 km2 with the population of 414,220 in 2007 (Statistics of Bali Province, 2008). In 2007, there were 147,483 regis-tered motorcycles which accounted for about 88.44% of the total regiestered vehicles. This indicated that motorcycle dominated the mode of transportation in Tabanan regency. In addition, the motorcycle average annual growth during period 2003-2007 was about 7.71%. At the end of 2007, total road length is 1,054.17 km and during period 2003-2007 there were no additional roadways built in the regency.
3.2 Data description
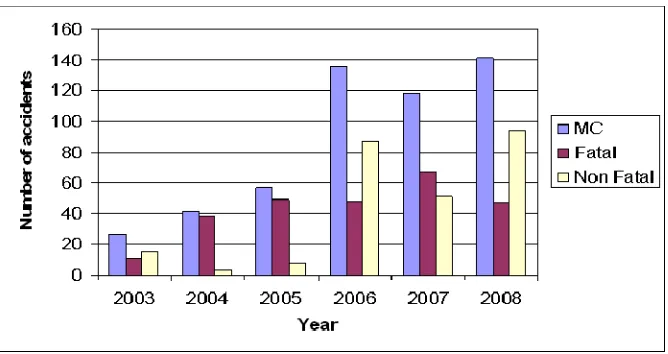
As shown in Figure 2, there were 518 motorcycle acci-dents in Tabanan regency with an average annual in-crease of 48% during period 2003-2008. In addition, motorcycle fatal accidents (260 events) were accounted for more than half of motorcycle accidents during this period. This indicated that motorcycle fatal accidents were a serious problem in this regency. In this study however, 15 accident data were incompleted, therefore 503 samples were effective and used in the model development.
4. Model Development
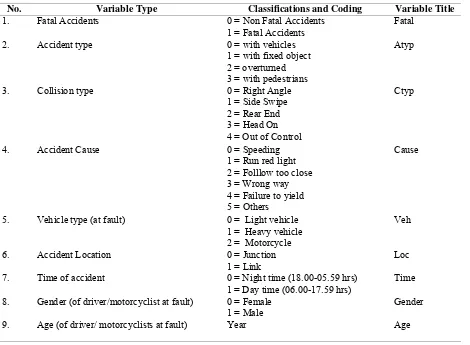
Some of accident related factors were used as the predictor variables in this study, following the method used by Al-Ghamdi (2002). These variables are used to analyze fatal motorcycle fatal accidents. Motorcycle fatal accident is defined as at least one motorcyclist killed on the event of road accidents. Following sug-gestions from previous studies (Kockelman and Kweon, 2001; O’Donnel and Connor, 1996), age and gender have long been a high priority in accident risk assessment. Therefore, age and gender of driver or motorcyclist at fault were considered as predictor variables. Response variable is fatal accidents, which is binominal in nature. All predictor variables are cate-gorical, but age which is a continuous variable.
The categorical variables have several levels, so that they require the use of dummy variables defined with 0, 1, 2, 3 and so forth, as shown in Table 1. They are created so that having k-1 dummy variables for the k levels of the nominal scale of that variable and are matching the coding system in SPSS, software used in this study. For example, the variable accident cause (Cause) has six levels and hence has five dummy vari-ables as shown in Table 2. When the respondent is ‘speeding’, the V1 would be set to 1 and V2, V3, V4
and V5 are set to zero (0). This coding system is
applied for the rest of categorical variables. It should be noticed that the SPSS is able to carry out this coding automatically once the end user has set the levels of the categorical variables.
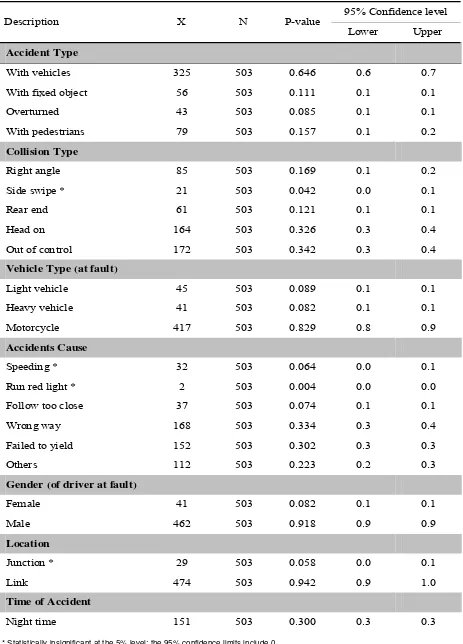
According to data related statistics shown in Table 3, some variable classifications can be neglected because of their small proportion. The hypothesis testing tech-nique for proportions was used in this study to decide whether a classification could be reduced. The follow-ing typical test was used:
Figure 2. Fatal motorcycle accidents in Tabanan Regency (2003-2008)
H0: pi = 0
Ha: pi≠ 0
Where, pi is the proportion of a variable classification.
Based on the test, there were four accident factors excluded from the model development stage, including ‘collision type-side swipe’, ‘accident cause due to speeding’, ‘run red light’ and ‘junction as the accident location’. This exclusion is carried out with merging the ‘non significant’ factors with another ‘significant’ factors. For instance, within the accident cause factor, ‘speeding’ and ‘run red light’ were merged with acci-dent cause factor ‘follow too close ’ and generated a new classification called ‘speed&rrl&close’. Follow-ing the same procedure, collision type ‘side swipe’ was merged with ‘right angle’ and resulting a new classification called RA&SS. For location factor ‘junction’ was not used as predictors considering that statistically most of fatal accidents occurred on road link.
These reductions result new classifications for vari-ables collision type and accident cause. Consequently, the classifications used in the model development are recoded using the same technique that has been described previously (Refer Table 2). In relation to model parameter analyses, last categories of each vari-ables would be used as the reference. For instance, for accident cause, the reference category is accident because of other causes.
No. Variable Type Classifications and Coding Variable Title
1. Fatal Accidents 0 = Non Fatal Accidents
1 = Fatal Accidents
Fatal
2. Accident type 0 = with vehicles
1 = with fixed object 2 = overturned 3 = with pedestrians
Atyp
3. Collision type 0 = Right Angle
1 = Side Swipe 2 = Rear End 3 = Head On 4 = Out of Control
Ctyp
4. Accident Cause 0 = Speeding
1 = Run red light 2 = Folllow too close 3 = Wrong way 4 = Failure to yield 5 = Others
Cause
5. Vehicle type (at fault) 0 = Light vehicle 1 = Heavy vehicle 2 = Motorcycle
Veh
6. Accident Location 0 = Junction
1 = Link
Loc
7. Time of accident 0 = Night time (18.00-05.59 hrs)
1 = Day time (06.00-17.59 hrs)
Time
8. Gender (of driver/motorcyclist at fault) 0 = Female 1 = Male
Gender
9. Age (of driver/ motorcyclists at fault) Year Age
Table 1. Variables selected for the study
Table 2. Dummy variables for accident cause
Cause V1 V2 V3 V4 V5
Speeding 1 0 0 0 0
Run red light 0 1 0 0 0
Follow too close 0 0 1 0 0
Wrong way 0 0 0 1 0
Failure to yield 0 0 0 0 1
Others 0 0 0 0 0
Table 5 contains the two pseudo R2 measures that are Cox and Snell and Nagelkerke. The former measure frequently does have a maximum less than one. It is therefore usually better to assess Nagelkerke’s measure as this divides Cox and Snell by the maximum to give a measure that really does range between zero and one. In this example, the motorcycle fatal accident models explain 6% respectively of the variance in the dependent variable. In addition, in Table 5 Hosmer-Lemeshow (H-L) test shows the significance of developed logistic regression models (Sig. > 0.05).
5. Results and Discussions
The model results as shown in Table 7 indicate that accident because motorists failed to yield (Cause(3)) and collision with light vehicles (Veh(1)) were two significant factors which negatively related to motor-cycle fatal accidents. As previously described in Table 3, the two significant factors were analysed by comparing them with their own reference categories. Based on Equation (3) and Table 7, the value of Exp (β) for dummy variables
Table 3. Hypothesis testing: data statistics (motorcycle fatal accidents)
Description X N P-value
95% Confidence level
Lower Upper
Accident Type
With vehicles 325 503 0.646 0.6 0.7
With fixed object 56 503 0.111 0.1 0.1
Overturned 43 503 0.085 0.1 0.1
With pedestrians 79 503 0.157 0.1 0.2
Collision Type
Right angle 85 503 0.169 0.1 0.2
Side swipe * 21 503 0.042 0.0 0.1
Rear end 61 503 0.121 0.1 0.1
Head on 164 503 0.326 0.3 0.4
Out of control 172 503 0.342 0.3 0.4
Vehicle Type (at fault)
Light vehicle 45 503 0.089 0.1 0.1
Heavy vehicle 41 503 0.082 0.1 0.1
Motorcycle 417 503 0.829 0.8 0.9
Accidents Cause
Speeding * 32 503 0.064 0.0 0.1
Run red light * 2 503 0.004 0.0 0.0
Follow too close 37 503 0.074 0.1 0.1
Wrong way 168 503 0.334 0.3 0.4
Failed to yield 152 503 0.302 0.3 0.3
Others 112 503 0.223 0.2 0.3
Gender (of driver at fault)
Female 41 503 0.082 0.1 0.1
Male 462 503 0.918 0.9 0.9
Location
Junction * 29 503 0.058 0.0 0.1
Link 474 503 0.942 0.9 1.0
Time of Accident
Night time 151 503 0.300 0.3 0.3
Motorcycle fatal accidents Chi-square Sig. Model 22.685 .001
Table 4. Omnibus tests of model coefficients
Table 5. Goodness of fit (pseudo r2 and h-l test)
Pseudo R2 Test
Fatal Accidents Model -2 Log likelihood Cox & Snell R Square Nagelkerke R Square
Motorcycle 674.571 .044 .059
Hosmer and Lemeshow Test (H-L Test)
Chi-square df Sig.
Motorcycle 7.415 5 .192
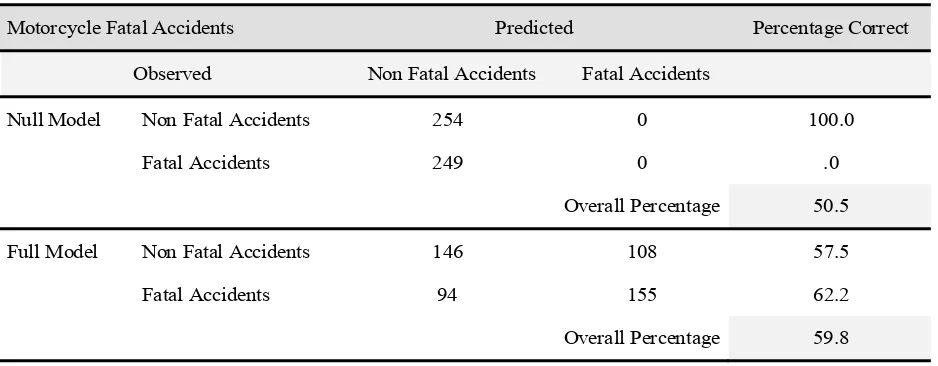
Table 6. Classification accura
Motorcycle Fatal Accidents Predicted Percentage Correct
Observed Non Fatal Accidents Fatal Accidents
Null Model Non Fatal Accidents 254 0 100.0
Fatal Accidents 249 0 .0
Overall Percentage 50.5
Full Model Non Fatal Accidents 146 108 57.5
Fatal Accidents 94 155 62.2
Overall Percentage 59.8 Table 6 gives the overall percent of cases that are correctly predicted by the full model. For motorcycle fatal acci-dents, the percentages have increased from 50.5 for the null model to 59.8 for the full model.
Table 7. Significant factors to influence motorcycle fatal accidents
Motorcycle fatal accidents
Variables B S.E. Sig. Exp(B)
Cause(3) -0.837 0.259 0.001 0.433
Veh(1) -0.926 0.347 0.008 0.396
Where
1. Cause(3) : Failure to yield 2. Veh(1) : Light Vehicles
A previous study (Ulfarsson and Mannering, 2004) has shown that failed to yield were a factor that could
influence (male) motorist’s injuries. In order to reduce such a factor of ‘failed to yield’ related fatal accidents in Bali, introducing an educational campaign or an awareness program about the risk of such a violation would be necessary.
In relation to light vehicle is probably explained by the fact that in typical mixed traffic, motorcycles shared the roadways together with heavy and light vehicles, in which motorcycles were the most vulnerable ones. These can be used to determine strategies to reduce fatal accidents, for examples, introducing special lane for motorcycle along the road link and enforcing safety riding program for motorcyclists including awareness to use the left lane.
6. Conclusions
This study applies logistic regression technique to investigate the influence of accident factors on motor-cycle fatal accidents in the Regency of Tabanan in Province of Bali. Based on the State Police of Bali Province accident data, eight predictor variables were employed in the model development. The analyses show that the odds of motorcycle fatal accident due to motorist failed to yield and collision with light vehi-cles were both about 0.4 times lower than for accident because of other causes and collision with motorcy-cles respectively. Thus, the probabilities of motorists failed to yield and collision with light vehicles were about 30% and 28% respectively contributing on motorcycle fatal accidents
The results would be expected to develop strategies to prevent and reduce fatal accidents in particular for motorcyclists in Bali. These strategies include introducing an educational campaign or an awareness program about the risk of ‘failed to yield’ by motorists and introducing special lane for motorcycle along the road link and enforcing safety riding program for motorcyclists including awareness to use the left lane. In addition, further works including data elaboration and improvement on accident recording system by the police are required before recommending action plan to prevent an accident because of other causes.
References
Al-Ghamdi, A.S., 2002, Using Logistic Regression to Estimate the Influence of Accident Factors on Accident Severity, Accident Analysis and Prevention, Vol. 34, 729-741.
Clarke, D.D., Ward, P., Bartle, C., Truman, W., 2004, In-depth Study of Motorcycle Accident, Road Safety Research Report No. 54, Departmen for Transport.
Dissanayake, S., 2004, Comparison of Severity Affecting Factors Between Young and Older Drivers Involved in Single Vehicle Crashes, IATSS Research Vol.28 No.2, 48-54.
Elliot, M.A., Sexton, B., Keating, S.L. 2004, Motorcy-clist’ Behaviour and Accidents, Safety Group, UK: Transport Research Laboratory Limite.
Ichikawa, M., Chadbunchachai, W., Marui, E., 2003, Effect of The Helmet Act for Motorcyclists in Thailand, Accident Analysis and Prevention, Vol. 35, 183–189.
Keng, S.H.. 2005, Helmet Use and Motorcycle Fatalities in Taiwan, Accident Analysis and Prevention Vol. 37, 349–355
Kockelman, K.M., Kweon, Y-J., 2002, Driver injury severity: An Application of Ordered Probit Models, Accident Analysis and Prevention Vol. 34, 313 – 321.
O’Donnel, C.J, Connor, D.H., 1996, Predicting The Severity of Motor Vehicle Accident Injuries Using Models of Ordered Multiple Choice, Accident Analysis and Prevention Vol. 28, No.6, 739 – 753.
Quddus, M.A., Noland, R.B., Chin, H.C., 2002, An Analysis of Motorcycle Injury and Vehicle Damage Severity Using Ordered Probit Models, Journal of Safety Research Vol. 33, 445-462.
State Police of Bali Province, 2008, Accident Data Report.
Statistics of Bali Province, 2008, Bali in Figures.
Ulfarsson, G.F., Mannering, F.L., 2004, Differences in Male and Female Injury Severities in Sport Utility Vehicle Minivan, Pickup and Passenger Car Accidents, Accident Analysis and Prevention 36, 135-147.