STRATEGIC UNCERTAINTY AND ENVIRONMENTAL SCANNING PATTERN OF SMALL AND MEDIUM SERVICE FIRMS IN WEST SUMATERA
Herri
Professor on Strategic Management, Andalas University Weni Sadli
Magister Management, Andalas University
Abstract
There are three basic objectives of this research which can be traced by (1) investigating the managers perceived strategic uncertainty and environmental scanning pattern of service industry, (2) examining the difference of executive scanning behavior with different level of perceived strategic uncertainty, and (3) analyzing the differences of scanning activities between higher and lower performance firms. Sample of this research are 54 managers of small and medium industry in West Sumatra whose include in operated service industry. Using simple regression and correlation analysis, this study produced some important results. First, this study indicate that managers perceived a different level of uncertainty. Second, it confirmed that task environment creates a higher uncertain Second, it confirmed that task environment creates a higher uncertainty than general or remote environment perceived by managers. Third, perceived strategic uncertainty positively related to the scope of scanning. This paper also discussed the implications of the findings and suggestions for future research.
Key word:Strategic management, Environmental scanning, developing countries
Introduction
Organizations have experienced a shift in both the rate of change and the degree of change in the last two decade. This shifting is contribution of globalization and technological advancement among others (Kotter & Schlesinger, 1979). To understand the change of external forces, organizations scan the environment so that they may develop effective responses which secure or improve their position in the future. They scan in order to avoid surprises, identify threats and opportunities, gain competitive advantage, and improve long-term and short-term planning (Sutton, 1988).
To the extent that an organization's ability to adapt to its outside environment is depends on knowing and interpreting the external changes that are taking place, environmental scanning constitutes a primary mode of organizational learning (Choo, 1999). Effective scanning of the environment is seen as necessary to the successful alignment of competitive strategies with the environments requirements and the achievement of outstanding performance (Beal and Yasai-Ardekani, 2001)
Executives can learn about environmental sectors in several ways (Layman, 2005). They may scan the environment directly or learn from others in the organization. They may increase and decrease the frequency with which they scan, and they may select among information modes and channels. The tendency and pattern of environmental scanning that conducted by manager is influenced by their perception about level of strategic uncertainty and importance of each sector in environment (Boulding and Staelin, 1993).
Related to the issues explain above, this research try to answer the following questions: How executive and manager of small and Medium service firms in West Sumatera perceive the level of strategic uncertainty and their environmental scanning behavior. What is the difference of executive scanning behavior who perceives higher and lower level of uncertainty . And to know if there is a difference between high performing firms and low performing firms in terms of their scanning activities.
REVIEW OF LITERATURE Business Environment
social factors outside the boundary of organization that are taken into consideration during organizational decision making.
The environment can be conceptualized as having several factors that exist in two layers (Duncan, 1972; Elenkov, 1997), they are task environment and general environment. However, David (2001) divided external force (environment) into five broad category : economic forces, social, culture demographic, and environment forces, political, governmental, legal forces technological forces and competitive forces. Some sectors in environment affect the company directly and some of them affect indirectly (Duncan, 1972), and further, he explains that environments vary in the level of their complexity and rate of change.
Complexity refers to heterogeneity of external events that are relevant to the organization (Child, 1972). The larger number of diversity in external events, the higher level of complexity is. Dynamism describes the rate and the unpredictability of change in a firm’s external environment (Dess & Beard, 1984), and is particularly important because of its influence on relationship between a variety of firm level construct and performance (Garg and Priem, 2003).
The organization-environment relationship
Organization has tentacles of influence which help form and given shape to the business environment. In other words there is not one-way causal relationship between environment and organization, but it is interrelationship exist. Hence, it would be rather naive to assume that organizations themselves do not play a major part in influencing their own environment (Brooks and Weatherston, 1997). In open system paradigm, each organization will life together with other parties, and among them will have interrelationship.
STRATEGIC UNCERTAINTY
Environmental uncertainty is inability to predict an organization’s environment (Milliken, 1987; May et. al, 2000: Huber & Daft (1987). Perception is a process by which individuals organize and interpret their sensory impression in order to give meaning to their environment. What one perceives can be substantially different from others perceive an objective reality (Robbins, 2003).
David (2001) wrote that strategists are individuals who are most responsible for the success or failure of an organization. They help organization gather, analyze, and organize information. Managers act and react base on their perception toward environment. So, strategic uncertainty that will affect executive’s scanning pattern is constructed by their perception about the level of uncertainty and how important any sector for them.
Determinant Factors of Strategic Uncertainty
The degree of uncertainty in the environment has been measured using both objective and perceptual measures (Burgouis, 1980; Koberg, Lindsay and Rue, 1980). Some use objective measures because researches result indicate a weak link between manager’s perceptions and objective measures of environment.. Others use perceptual measure because firms respond to environment as what the managers and decision maker’s perception about environment, so that firm has different respond toward the same environment attributes. Both measures have inherent weakness, objective measures assumes all organization perceived environment in the same way oppositely if we use perceptual measures, there are others variables besides environment also influence perception ( Yasai and Ardekani, 1996).
Duncan (1972) proposed that perceived strategic uncertainty is the difference between available information and derived information. On the other hand, Pfeffer et al, (1978) proposed sector importance is related to the notion of resources dependency, which is the extent to which the sector provides resources for attainment of organizational goals.
Environmental Scanning
Environmental scanning includes both looking at information (viewing) and looking for information (searching). According to Choo (1999), environmental scanning can take many forms and mode. Environmental Scanning is the first step in this problem solving sequence (Daft & Weick,1984 ; Hambrick, 1982).
scanning as the systematic collection of external information in order to (1) lessen the randomness of information flowing into the organization and (2) provide early warnings for managers of changing external conditions.
Scanning behaviour is about how executives conduct their environmental scanning, frequency of scanning, source of information, scope of scanning, and modes of their scanning. The most popular and often dimensions researcher in measures scanning behaviour is frequency and scope of environmental scanning which conducted by managers (Daft et al. 1988;
Beal and Yasai-Ardekani, 2001). On the other hand Garg (2003) proposed that firm in
dynamic environment tend to give more attention and focus to sectors on external environment especially task environment because they need innovation to survive and they nee to know information about new customer taste, competitor’s product and innovation-support Technology. Oppositely, firm in stable environment tend to focus on internal environment to increase efficiency (Daft & Weick, 1984). Environmental information is obtained from internal or external resources, and from personal and impersonal (Lengel, 1986; Keegan 1974).Effective scanning emphases remain a perquisite to successful organizational adaptation. As Hambrick (1981) has noted, an organization’s executives can only act on those phenomena to which their attention is drawn. The scope and frequency of scanning (Scanning Behaviour) will affect the firm’s ability to align its competitive strategy with its environment (Yasai-Ardekany & Nystrom, 1996). Frequent scanning of environmental sectors provide the firm with current information and allows it to verify the accuracy of the information to adapt to changing environmental condition more rapidly than does infrequent scanning. Obtaining information about several different sectors furnishes the CEO with more relevant in formations in aligning the firm’s competitive strategy with environmental condition
THEORITICAL FRAMEWORK Environment and Organization
Organization exists in a system which has many sectors that always change and interact each others create uncertainty that influence their responsibility as decision maker. High uncertainty makes manager hard to take any choice and make any decision because possible risk comes from their unknown about what will happen later. Company interacts with many sectors of environment in their daily operation. Each sector in environment (customers, supplier, competitors, etc) affects the company partially and together. Manufacturing firm buy all of materials they need to produce their product from supplier, and then sells their product to customers. In the market, company will compete with other company (competitors) to attract and retain its customer. In general environment, deregulation can create opportunity, threat, or both.
Perceptual Filters and Organization’s Actions
Perceptual filters explain how organizations and their employees can assist in the ‘creation of their own business environment such that the actual nature of the business environment remains as much one of human interpretation as of hard ‘reality’. It will suggest that different organization in the same industry often ‘view’ environmental forces quite differently from one another, even though those forces may in fact be very similar. Finally, it will explain how organizations ‘filter’ and ‘interpret’ incoming information about the environment and how managerial cognition and organizational culture and politics can influence this process (Brooks and Weatherston, 1997). Miller (1988) argues that managers’ perception of their environment has a greater influence on organizational decision making and eventual strategic direction than does more objective information The process of perceptual filters based on subjective judgment of the environment; however , many organizations attempt to form and utilize more objective environmental measures.
Environmental Condition and Perceived Strategic Uncertainty
When faced with a complex, uncertain and dynamic environment some organizations and many individual managers attempt to simplify that environment, at least in their own minds. Bourgeois (1985), however, recommends that organizations face up to and actively confront that difficult environment. As the concept of environment proposed by Duncan (1972), sectors in environment are categorized into two category based on their effects toward organization which are the task environment. Daft and colleagues (1988) proposed that sectors in task environment would create greater perceived strategic uncertainty than sectors in general environment because task environment directly affect firms operation and performance and change rapidly, complex and perceived more important.
perceived environmental uncertainty will be significantly higher for political and economics sectors than five others environmental sectors in environment with unstable political condition and economic (Sawyer, 1993).
H1. Sectors in task environment create greater perceived strategic uncertainty than sectors in general environment
Perceived Strategic Uncertainty and Scanning Behavior
Organizational action is the result of gathering and interoperating information from environment (Daft and Weick, 1984). Each time organization take action, the environment is change, thus begins the cycle of organization adaptation, information gathering, interpretation, and adaptation. Administrator who are experiencing of high degree of state uncertainty will spent a greater amount of time resources on environmental scanning than will administrator who are more confident in their understanding of the environment (Milliken, 1987; May et. al, 2000) Scanning activity will increase in response to increasing of environmental uncertainty. Under low uncertainty condition (stable environment) decision making can rely their existing knowledge and experience, so they often expend limited effort on scanning. Scanning activity is linearly related to environmental uncertainty with the amount of scanning increasing as the environment becomes more dynamic. However, scanning activity decreases at high and low level of uncertainty since useful in formation is either unattainable or already known.
H2a. Perceived strategic uncertainty across sectors will have positive relationship with executive scanning frequency
H2b. The level of perceived strategic uncertainty across sectors will have positive relationship with scope of scanning
Environmental Scanning and Performance
Fahey and Narayanan (1986) suggest that an effective environmental scanning program should enable decision makers to understand current and potential changes taking place in their institutions' external environments. Scanning provides strategic intelligence useful in determining organizational strategies (Jogaratnam and Wong, 2oo9),”. The consequences of this activity include fostering an understanding of the effects of change on organizations, aiding in forecasting, and bringing expectations of change to bear on decision making.
Learning about uncertainties across all sectors may provide a richer information display for the incremental decision needed strategy formulation. Effective scanning of the environment it seen as necessary to the successful alignment of competitive strategy with environmental requirement and the achievement of outstanding performance. Biel (1992) in his research proved that more frequent scanning will increase the strategy alignment. H3. Executives of higher performance firms scan more frequent than executive in lower performance firms
Conceptual Framework
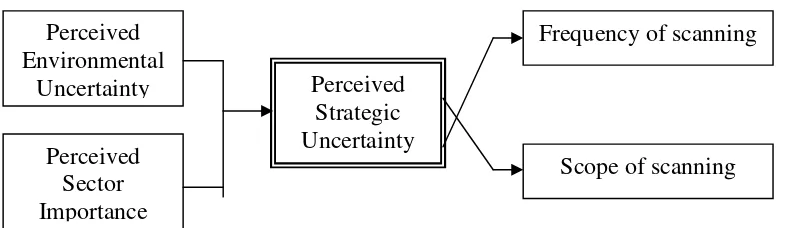
Based on previous explanation, theoretical framework for this research can be drawn as can be seen from the Figure 1. This figure explains that perceive strategic uncertainty will affect manager’s scanning behavior. However, managers behavior will be influenced by perceived environmental uncertainty and perceived sector importance
Each sector has different characteristics and unique way in influencing the company. So, different sector will create different level of uncertainty and different level of importance for each company. The sector that always changes in term of rate and frequency will create higher uncertainty for executives. Any sector which has direct and higher impact into a company will more important perceived by executives.
Perceived
Strategic
Uncertainty
Perceived
Environmental
Uncertainty
Scope of scanning
Frequency of scanning
Perceived
Sector
Importance
The mix of both uncertainty and level of importance of any sector will create a particular level of strategic uncertainty of this sector. The level of this strategic uncertainty will influence the information seeking activity that we call as environmental scanning of any firm.
The scope and frequency of scanning will affect the firm’s ability to align its competitive strategy with its environment (Yasai-Ardekany & Nystrom, 1996). Frequent scanning of environmental sectors provide the firm with current information and allows it to verify the accuracy of the information to adapt to changing environmental condition more rapidly than does infrequent scanning. Obtaining information about several different sectors furnishes the CEO with more relevant in formations in aligning the firm’s competitive strategy with environmental condition (Nutt, 1984;
Beal and Yasai-Ardekani, 2001)
RESEARCH METHOD Population and sample
Unit of analysis of this study is individual and its object are anybody who take the strategic position in the company and decision making is a part of their job, so that the object of research could be as chief executive officer, president, owner, chair of the board. Many prior researches investigate executives and managers of manufacturing firm, but the population of this research is executives and managers of service firms include hotel, radio station, laundry, catering, leasing and etc in West Sumatera.
Sampling
The sampling technique used is the simple random sampling which every possible sample of a given size has the same chance of selection. Sampling criteria are medium-sized, and single-business companies. Based on the criteria above, 54 manager participated on this study.
Data Collection Method
The data used for this research is divided into primary and secondary data. Primary data collection is thru questioner and secondary data is collected from publications or data that have gathered already by other parties (Sekaran, 2003) . This type of data is obtained from library, internet, prior study, journals related with the dynamics of business environment, perception, decision making, strategic uncertainty and scanning behavior.
Variables
Environmental uncertainty. Environmental uncertainty is inability to predict an organization’s environment. A dilemma created by a lack of information about organization, activities, and events in the environment. The level of environmental uncertainty is determined by Variability (Frequency of Change) and Complexity (Rate of Change). Sector importance is related to the notion of resources dependency, which is the extent to which the sector provides resources for attainment of organizational goals. Sector with high importance are perceived to be directly linkage to operation and performance, oppositely low importance sectors hardly affect the organization’s performance.
Environmental Scanning
Environmental scanning is the acquisition and use of information about events, trends, and relationships in an organization's external environment, the knowledge of which would assist management in planning the organization's future course of action.
Dimensions of Environmental Scanning Behaviour can be traced form some activities such as scanning frequency, scope of scanning, scanning modes: a mode of scanning, scanning emphases
Variables Measurement
Following will be explained the measurement of research variable, starting from their definition and followed by the scale used to measured them. As previously described, managerial scanning behavior affected by strategic uncertainty. Therefore, SB can be expressed as a function of the SU: SB = F (SU), where SU = Perceived Strategic Uncertainty and SB = Scanning Behavior
Two type of measurement constructs have been adopted in earlier study multiplicative ( Composing ) and decomposing method (Boyd and Fulk, 1996 : Elenkov,1997 ) this research will use the first measurement, because people act based on their perception, moreover this construct more simple and easier. The multiplicative type of measurement constructs defines SU as the multiplication of perceived environmental uncertainty (PEU) and strategic importance (I). Earlier studies defined SU as the multiplication of PEU and strategic importance (I). (Daft et al., 1988; Elenkov, 1997; Sawyer, 1993) where SU = PEU * I or SU = (C + R) * I
Perceived Environmental Uncertainty ( PEU )
The subscales corresponded to the key sectors of the external environment of their company. Each participant is given a general explanation of each part of questioner and how to fill the questionnaire. Then, the respondent is asked to rate the degree off predictability for various characteristics of environmental sector.
PEU = Complexity + Rate of Change Measurement of Complexity
The answers is measured on 5 point scales, with a rating of 1 indicating that the complexity of any sector is low and a 5 indicating that the complexity is high
Measurement of Rate of Change
The answers is measured on 5 point scales, with a rating of 1 indicating that the rate of change any sector is low (predictable) and a 5 indicating that the rate of change is high (unpredictable).
Perceived Sector Importance
The measure the perceive importance of each environmental sector, a new scale was developed. The respondents are instructed to indicate the extent to which they perceived the various items as being important of a 5 point scales. Assessing characteristics of the key seven sectors simultaneously enabled the interview managers to compare environmental sector and distinguish importance meaning fully among them.
Scanning Behavior
Dimensions of SB those will investigate in this research are frequency of scanning, scope of scanning and scanning emphases. Scanning frequency is measured using a six point scale adapted from Hambrick (1982). The scores is zero (1) for scale range is never, 1 for yearly, 3 for monthly, 4 for weekly and 1 for daily. Frequency scores for the task and remote environment is obtained by averaging the frequency score for the three task environment sectors and the four remote environment sectors.
Scope Of Scanning
The scope of scanning is measured with measurement formula constructed by Yasai-Ardekani and Nystrom (1996).The six priori scope of scanning indices contained 21 items given to respondents by to answer “Yes” or “No” to whether they used certain types of information in determining how to compete in major markets. The indices were constructed by totaling the number of information types used by managers. For example, the manager of firm A indicated that he used two of the eight types of information listed for the competitor index. Thus, firm A’s score for this index is 2. The index of seven environmental sectors to examines the scope of scanning.
Scanning Emphases
Sectors of the external environment differ in importance and uncertainty (Daft et al., 1984) and firm can benefit from emphasis of the “right” sectors. As the limitation of capacity and resources in term of time, cost, and energy, executives is better focusing their scanning on specific sectors rather than scanning broadly. Questions remain concerning which sector has significant impact on firms operation and performance, so that those sectors should be given most attention, when, and why.
Performance Measurement
RESULT AND DISCUSSION Companies Profile
The profile of samples firms that are information related to business sectors, firm’s age, and labor size of sample firms of this research . There are nine categories of samples, they are hotel 14 firms (25.9%), catering 8 firms (14.8%), laundry 5 firms (9.3%), educational institution 10 firms (18.5%), restaurant 8 firms (14.8%), radio station 4 (7.4%), and VCD rental 3 firms (5.6%). In term of age, three categories of firms age are appeared, first, where 3 firms are below five years, 21 firms between five and fifteen years, and the others 20 firms are over fifteen years.
The age range of sample firm’s age is 1 year to 32 years. The average of sample firm’s age is 12.6 years. The objects of this research are only small and Medium service firms in West Sumatera, so that the number of labors of each firms are divided into two categories small ( <15 ) and Medium( >15 ).
Companies which the number of labor below 15 labors is 26 firms and over 15 labors are 30 firms. The minimum number is 4 labors and maximum number is 45 labors. Most of sample firms are operate regionally and few nationally and internationally. Thirty eight firms are operating regionally, five firms nationally and the rest of eleven firms are operating internationally.
Managers Profile
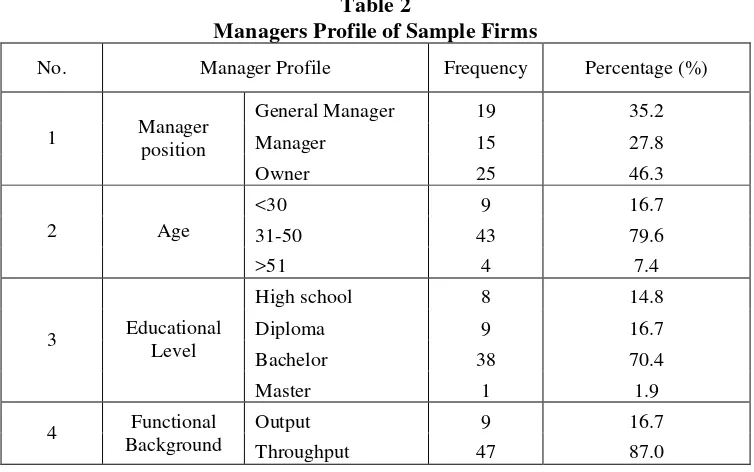
Table 2 describe profile of manager as a respondents of this research in term of their position, age, educational level and functional background.
Based on data collected from the field, the youngest manager is 24 years old and the older manager is 63 years old. The average age of sample managers is 38.4 years old. Majority or most manager are including to Medium category 31-50 years old. The higher educational level of sample managers is doctoral, but only one person. They have different academic background. Thirty eight of them are bachelors, 8 of high schools and the rest of 9 managers are diploma.
Functional background of samples divided into two categories, they are output and throughput. Manager belong to output background if they have experience in marketing and management science, meanwhile throughput background if managers have experience in finance, accounting, operational, engineering, and production technique. Manager with output background only nine person, few only high school and the rest are throughput background.
Table 2
Managers Profile of Sample Firms
No. Manager Profile Frequency Percentage (%)
General Manager 19 35.2
Manager 15 27.8
1 Manager
position
Owner 25 46.3
<30 9 16.7
31-50 43 79.6
2 Age
>51 4 7.4
High school 8 14.8
Diploma 9 16.7
Bachelor 38 70.4
3 Educational Level
Master 1 1.9
Output 9 16.7
4 Functional
Background Throughput 47 87.0
This study relies on perceptual measures of organizational performance. The respondents are asked to indicate the extent of their satisfaction with their daily operation, target attainment, profit and performance as whole. The five point scales used for this measurement range from (1) Very Dissatisfied to (5) Very Satisfied. The score for five questions in summarized and averaged to construct composite firm performance. This composite measure reflects an aggregate view of performance based on the level of executive’s satisfaction with their firm’s performance.
Table 3
Performance of Sample Firms
No. Performance Level Frequency Percentage Means Deviation Standard
1 Low : <15 5 9,3
2 Medium : 15-20 35 64,8
3 High: >20 16 29,6
18.74 2.97
T o t a l 56 100,0
Table 4 indicates, firms with low performance only five firms (9.3%) with averaged scores lower than 15 points. Most of firms is in medium category with averaged scores 15 to 20 points is 35 firms (64.8) and 16 firms is on high category with scores more than 20 points. This result show that most of executives is satisfied with their firms performance, and five executives is very dissatisfied with their firms performance.
Reliability and Validity Testing
Cronbach alpha of the instrument is greater than .60, so that the instruments of this research is valid and be used to further analysis (Nunnally, 1967). From the Corrected Item-Total Correlation of all three variable (PSU across sectors=0.426, Frequency of scanning=0.374, and Scope of scanning=0,356) are higher than 0.001, so the instrument of this research are reliable.
Hypothesis Testing
Hypothesis 1 : Sectors in task environment create greater perceived strategic uncertainty than sectors in general environment
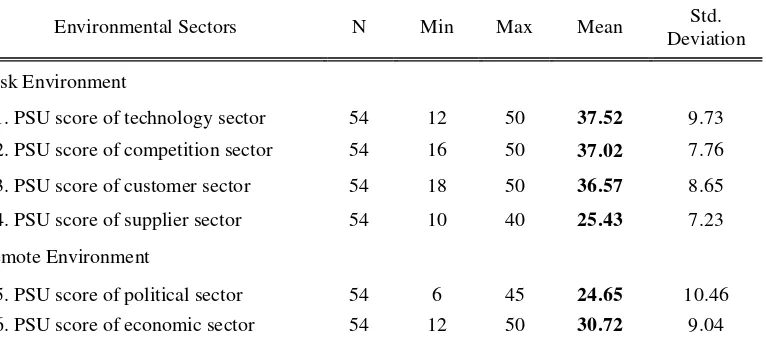
The first hypothesis is examined using Paired Sample ttest.. Table 4. below will descript the PSU scores of each environmental sector that is the multiplicative of PEU and Perceived Sector Importance (I).
The result show that the perceived strategic uncertainty for task environment was significantly higher than perceived strategic uncertainty score for remote environment (t = 10.99, p=0.001). This result support the first hypothesis sectors in task environment create greater perceived strategic uncertainty than sectors in general environment.
Table 4
Perceived Strategic Uncertainty (PSU) Scores per Sector
Environmental Sectors N Min Max Mean Std. Deviation
Task Environment
1. PSU score of technology sector 54 12 50 37.52 9.73
2. PSU score of competition sector 54 16 50 37.02 7.76
3. PSU score of customer sector 54 18 50 36.57 8.65
4. PSU score of supplier sector 54 10 40 25.43 7.23
Remote Environment
7. PSU score of social sector 54 12 40 24.04 7.52
Hypothesis 2a : Perceived strategic uncertainty across sectors will have positive relationship with executive scanning frequency
The hypothesis is tested using Pearson’s product moment correlation coefficient. Computation result of Pearson correlation between the strategic uncertainty scores and scanning frequency across sectors that are showed on Table 5 below.
The correlation coefficient between both variable is 0.355 and this value is more than 0.01, so we can state that the correlation between perceived strategic uncertainty scores and frequency of scanning is positive and significance. It is means the higher level strategic uncertainty perceived by executives, they will scan more frequent, and hypothesis 2a is accepted.
Table 5
Correlation analysis between PSU scores and Frequency of scanning
PSU across sectors
Frequency of scanning across
sectors PSU across sectors Pearson Correlation 1 .355**
Sig. (2-tailed) .000
N 378 378
Pearson Correlation .355** 1
Frequency of scanning
across sectors Sig. (2-tailed)
.000
N 378 378
**.Correlation is significant at the 0.01 level (2-tailed).
Hypothesis 2b : The level of perceived strategic uncertainty across sectors will have positive relationship with scope of scanning.
The relationship between perceived strategic uncertainty and scope of scanning is analyzed by using Pearson correlation. Coefficient correlation of perceived strategic uncertainty scores and scope of scanning is 0.344. This values is significant at the level α= 0.01 or o.344 is as showed on table 6 below, hence hypothesis is accepted.
Table 6
Correlation analysis between PSU scores and Scope of scanning
PSU across sectors
Scope of scanning across sectors
PSU across sectors Pearson Correlation 1 .334**
Sig. (2-tailed) .000
N 378 378
Pearson Correlation .334** 1
Scope of scanning across sectors
Sig. (2-tailed) .000
N 378 378
**.Correlation is significant at the 0.01 level (2-tailed).
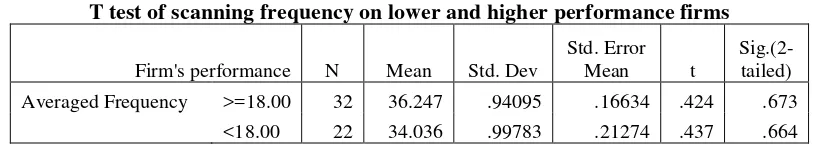
Hypothesis 3 : Higher performance firms scan more frequent than lower performance firms
Higher performance (≥18 point) attained by firms that done or get the mean scanning frequency about 36.247 and the mean score of lower performance firms is 34.36. It is means firms those done more frequent environmental scanning attain higher performance, but the difference between them is not significant (0.673>0.5). So, Hypothesis 3 is supported.
Table 7
T test of scanning frequency on lower and higher performance firms
Firm's performance N Mean Std. Dev
Std. Error
Mean t
Sig.(2-tailed) Averaged Frequency >=18.00 32 36.247 .94095 .16634 .424 .673
<18.00 22 34.036 .99783 .21274 .437 .664
DISCUSSION
Each sector in environment those influence scanning and other organizational activities emerges different level of uncertainty. Daft et all., (1988) proposed that sectors in task environment would create greater perceived strategic uncertainty than sectors in general environment because task environment directly affect firms operation and performance and change rapidly, complex and perceived more important.
The differences between the Perceived Strategic Uncertainty (PSU) scores also examined to facilitate comparison. The technology sector has the highest perceived strategic uncertainty scores. This was followed by competition sector and customer sector. The difference in the mean of the technology, competition, customer, and supplier, political, economic and social sector were not significant. The PSU score of supplier sector on environment significantly lower than other task environment sectors (technology, competition, and customer). This is caused by supplier is not take a big influence nor an important part in decision making for managers of service firms because they only need few material and supply to support service as their core business.
A research on manufacturing firms in US done by Daft et al. found that all sectors of task environment had the highest PSU scores and ascend from customer, economic, competition and technology. And the rest two sectors from six sectors investigated got the lowest PSU scores. A little difference, similar research by Sawyer (1992) on Nigerian manufacturing executives, ranked economic and political sector those are part of remote environment on second and third position below customer/ market sector. This is because when the research done, Nigeria is in economic crisis and in planned transition to duly elected civilian government after a long time army regime that creates an instable political environment. Most of the small and Medium service firms in this study operate locally, so they only impacted by local condition which is stable political and economics condition even not high growth. So that, the task environment sectors more impactful and create greater uncertainty for their business and perception.
There is significant positive correlation between PSU scores and scanning frequency for all sectors of environment, except the technology, customer, supplier, and economic sector. Daft et al. (1986) obtained similar result with the American sample. They found that perceived strategic uncertainty was predictor of the frequency with which executives scanned the sectors more frequently went uncertainty was high. Although uncertainty is high for technology and supplier, managers my not scan as frequently because these sectors are perceived low importance. Beside that, supply is only material support for service as their core business. Managers also not scan economic sector frequently because of the realization that they can not influence occurrences in this sector of environment. Managers of higher performance firms scan the environmental sectors more frequent than executives of lower performance firms. Frequent scanning of environmental sectors provides the firms with current information and allows verifying the accuracy of the information and to adapt to changing environmental conditions more rapidly than does infrequent scanning. Frequent scanning also positions the firm to stay abreast of environmental events and trends that threaten its existence or over opportunity to exploit. This opportunity can be a competitive advantage support the achievement of higher performance.
IMPLICATION
done by Sawyer on Nigerian small manufacturing firms. This object of this research is executives of small service firms in West Sumatera. These three countries have different and unique business environment characteristics like customer taste, competition, economics growth, political stability and social life condition. In Nigeria, PEU scores of political sector is high and rated number three after customer and economic sector and higher than competition sector caused by political instability. Significantly different with executives in West Sumatera who face the more stable political condition affected the scores of uncertainty perceived by managers toward political sector of environment.,
Generally, this research found that the task environment create higher uncertainty than general or remote environment perceived by executives of service firms in West Sumatera. But PSU scores of supplier sector perceived significantly lower than other three sector of task environment. This fact may be caused by the supply only supported material for service as core business of service firms. The supply for most of service firms are electricity, fuel, and telephone.
This study also found that perceived strategic uncertainty positively related to scope of scanning. Its mean executive of service firms in West Sumatera scan broader on sector with higher uncertainty. Experience shows that opportunities and threat can arise from many different sources (Jackson and Dutton 1988). Thus, obtaining information about several different sectors furnishes the executives with more relevant information in aligning the firm’s competitive strategy environmental condition. For example, obtaining and analyzing information on competitor’s lowering or raising its product price may enable a firm to formulate and implement strategic action to maintain current customer and secure additional ones.
CONLUSION AND SUGGESTION FUTURE RESEARCH Conclusion
The aim of this research to investigate the executive’s perceived strategic uncertainty and environmental scanning pattern of service industry in West Sumatera. This research also conducted to examine the difference of executive scanning behavior with different level of perceived strategic uncertainty. The differences of scanning activities between higher and lower performance firms also examined.
The result of this study indicate that executives of service firms in Went Sumatera perceived different level of uncertainty on seven sectors of environment with manufacturing firms. This is caused by each sector of environment create different level of uncertainty on different industry. Sectors in task environment create greater perceived strategic uncertainty than sectors in general environment because task environment has direct impact to organization.
Based on this investigation and analysis, frequency of scanning and scope of scanning positively related to the level of perceived strategic uncertainty. Higher level of uncertainty, executives will scan environment more frequent and broader. Executives of higher performance firms scan environment more frequent than executives of lower performance firms.
Suggestions for Future Research
This research did not examine the internal factor beside external factor those are influence the perception making process of anybody. Different background, education level, social life makes difference perception about the same object. The future research can examine the relationship of internal characteristics such as perception, values, educational background, and social life with the level of perceived uncertainty.
Perhaps the next step of research can explore the detail linkage between environment, scanning and actual strategy adjustment in order to improve higher performance. The other limitation of this research is sample size only 54 executives because the limitation of resources. So, the ability of this sample represent the actual population characteristics are weak. So, the next research should maximize the sample size to get a more acceptable result. References
Beal, R. M. and M. Yasai-Ardekani, (2001), “Outperforming the competition in each stage of the industry life cycle”,Working paper, Florida A&M University, Tallahassee, FL.
Boyd, Walker, Larrache, (1996), Marketing Management; a strategic approach”,Prentice Hall
Brooks, I., Weatherson, J., (1997),“The Business Environment”, Prentice Hall, England.
Child, J. (1972). Organizational structure, environment and performance: The role of strategic choice.Sociology,6, 1–22.
Choo, Chun Wei (1999). The Art of Scanning the Environment.Bulletin of the American Society for Information Science 25 (3):13-19.
Daft, L. Richard, Sormunen, J. Parks, D. (1988), “Chief executive scanning, environmental characteristics, and company performance: an empirical study”, Strategic Management Journal, Vol. 9, pp.123-139.
Daft, R.L. & Lengel, R. (1986). Organizational information requirements, media richness and structural design. Management Science,32(5), 554-571.
Daft, R.L. & Weick, K. (1984). Toward a model of organizations as interpretation systems. Academy of Management Review,9(2), 284-295.
David, F. R., (2001), “Strategic Management: concepts and cases”, International edition, Prentice Hall, New Jersey.
Dess, G.G. & Beard, D.W. (1984). Dimensions of organizational task environments, Administrative Science Quarterly,29, 52–73.
Duncan, R.B. (1972). Characteristics of organizational environments and perceived environmental uncertainty. Administrative Science Quarterly,17(3), 313-327.
Elenkov, D. S., (1997),“Strategic uncertainty and environmental scanning: the case for institutional influences on scanning behavior”, Strategic Management Journal, Vol. 18, pp. 287-302.
Fahey, L., & Narayanan, V. (1986).Macro environmental analysis for strategic management. St.Paul, MN: West Publishing.
Garg, V. K., Walters, B. A., Priem, R. L. (2003),“Chief executive scanning emphases, environmental dynamism, and manufacturing firm performance”, Strategic Management Journal, Vol. 24, pp. 725-744.
Hambrick, D.C. (1982),“Environmental scanning and organizational strategy”, Strategic Management Journal, Vol.3, pp. 159-74.
Hambrick, D.C., (1981)"Specialization of Environmental Scanning Within Top Management Teams," Journal of Management Studiesye, June.
Hambrick, D.C., (1981)"Environment, Strategy and Power Within Top Management Teams," Administrative Science Quarterly, June.
Hough, J. R., White, M. A., (2004), “Scanning actions and environmental dynamism: gathering information for strategic decision making”,Management Decision; 42, pp.781-793.
Jogaratnam Giri and Wong, Kevin K. F, (2oo9),” Environmental Uncertainty and Scanning Behavior: An Assessment of Top-Level Hotel ExecutivesInternational Journal of Hospitality & Tourism Administration, Volume 10, Issue 1 January 2009 , pages 44 - 67
Jorosi, B., N2008,”Environmental Scanning in Botswana’s SMEs: A Study of the Manufacturing Industry”, Libri, vol. 58, pp. 224–233
Kotter, J. P., & Schlesinger, L. A. (1979, March-April). Choosing strategies for change. Harvard Business Review. 57 (2), 106-114.
Layman, Elizabeth J, (2005),”Environmental Scanning and the Health Care Manager”,The Health Care Manager, July/September - Volume 24 - Issue 3 - pp 200-208
May, R.C., Stewart, W.H. and Sweo, R. (2000), “Environmental scanning behavior in a transitional economy: evidence from Russia”, Academy Management Journal, Vol. 43, pp. 403-27.
Milliken, F. J. (1987), “Three types of perceived uncertainty about the environment: State, effect, and response uncertainty”.Academy of Management Journal, 31: 280-308.
Nunnally J C, 1967,Psychometric Theory. New York: McGraw Hill
Nutt, P.C. (1984). "Types of Organizational Decisions," Administrative Science Quarterly 29, 414-450.
Pfeffer, Jeffrey, & Salancik, Gerald R. (1978). The external control of organizations: a resource dependence perspective.New York, NY: Harper & Row.
Robbins, S. P., (2001),“Organizational Behavior”,eight editions, Prentice Hall, New Jersey.
Sawyer, O.O. (1993), “Environmental uncertainty and environmental scanning activities of Nigerian manufacturing executives: a comparative analysis”, Strategic Management Journal, Vol. 14, pp. 287-99.
Uma Sekaran (2003), Research Methods for Business--A Skill Building Approach. John. Wiley. New York. 4th Edition
Sawyerr, O.O. (1993), “Environmental uncertainty and environmental scanning activities of Nigerian manufacturing executives: A comparative analysis”, Strategic Management Journal,14, 287–299.
Suh, W. S., Key, S. K., and Munchus, G., (2004),“Scanning behavior and strategic uncertainty; proposing a new relationship by adopting new measurement constructs”, Management Decision; 24, pp.1001-1015.
Sutton, Howard. 1988.Competitive Intelligence.New York: The Conference Board, Inc.