TRŽIŠ
TE
ORIENTATION AS BUSINESS PERFORMANCE
DRIVERS
ORIJENTACIJA MENADŽERA I PODUZEĆA
PREMA ZNANJU KAO POKRETAČ POSLOVNE
USPJEŠNOSTI
UDK 005.336+65.011.8 Prethodno priopćenje Preliminary communication
Jolanta Mazur, Ph. D.
Professor, Institute of International Management and Marketing
Warsaw School of Economics (SGH)
Ul Al. Niepodległości 162, 02-554 Warsaw, POLAND Phone: ++48 22 564 9358
E-mail: Jolanta.Mazur@sgh.waw.pl
Marianna Strzyżewska, Ph. D.
Professor, Institute of International Management and Marketing
Warsaw School of Economics (SGH)
Ul Al. Niepodległości 162, 02-554 Warsaw, POLAND Phone: ++48 22 564 9358
E-mail: mstrzy@wp.pl
Key words:
managers’ knowledge orientation, companies’ knowledge orientation, business performance Ključne riječi:
orijentacija menadžera prema znanju, orijentacija poduzeća prema znanju, poslovna uspješnost
SAŽETAK
Mnogi autori znanje smatraju važnim izvorom održive konkurentske prednosti koja pospješuje poslovnu uspješnost poduzeća. Stoga je velik broj autora pokušao opisati ulogu znanja. No, bilo je znatno manje pokušaja da se ocijeni utje-caj aktivnosti i ponašanja u pogledu znanja na rezultate poslovanja poduzeća u različitim zem-ljama. Istovremeno, gotovo niti jedno istraživanje nije utvrdilo potpuni raspon mišljenja i uvje-renja koja bi pokazala stavove menadžera o aktivnostima povezanima sa znanjem unutar njihovih poduzeća. Ovaj rad istražuje odnose između mišljenja menadžera o znanju
(orijen-ABSTRACT
Knowledge is widely considered to be the major source of sustainable competitive advantage, fo-stering companies’ business performance. The-refore, a number of authors have undertaken the eff orts at describing its role. There were, however, much fewer attempts aimed at evaluating the infl uence of knowledge activities and behaviors on companies’ business performance/results in various countries. At the same time, there was practically no research identifying the full range of opinions and beliefs, indicating company ma-nagers’ attitudes towards knowledge activities within their companies. This paper investigates
TRŽIŠ
TE
■ Vo l. X X II (2010), b r. 2, st r. 189 - 204tacija menadžera prema znanju), aktivnosti i ponašanja povezanih sa znanjem (orijentacija poduzeća prema znanju) i poslovne uspješnosti poduzeća u kontekstu srednje velikih poduzeća koja posluju u Poljskoj.
the relations between the managers’ opinions concerning knowledge (managers’ knowledge orientation), the knowledge-related activities and behaviors (companies’ knowledge orien-tation) and companies’ business performance within the context of medium-sized companies operating in Poland.
TRŽIŠ
TE
■ Vo l. X X II (2010), b r. 2, st r. 189 - 204THEORETICAL
BACKGROUND
The term company’s orientation was used by many authors before the concept was operation-alized. One of the fi rst attempts at determining what market orientation was and how it infl u-enced the performance of companies, including their profi tability, were undertaken by J.C. Narver
and S.F. Slater.1 The company’s orientation was
also operationalized by A.H. Kohli, B.J. Jaworski.2
The latter ones delineated the domain of market orientation by proposing an inventory of activi-ties and behaviors refl ecting the marketing
busi-ness philosophy. Together with A. Kumar3 they
developed the MARKOR scale, based on the at-tributes of organization’s market orientation. The list of marketing activities and behaviors refl ected three phases of a process consisting of market-ing intelligence, information dissemination and reacting to this information by a company. The mentioned activities could be undertaken more or less intensively. This way a company’s (strate-gic unit’s) market orientation level could be
high-er or lowhigh-er. A.H. Kohli and B.J. Jaworski4 were also
interested in the infl uence of market orientation on companies’ business performance and some other results of its implementation. The positive relations between market orientation and the companies’ business performance were em-pirically tested and confi rmed. The concept and the MARKOR scale were widely applied in many research projects concerning groups of
com-panies,5 branches6 and sectors.7 The construct
of company’s orientation was then widened to
include learning orientation,8 and both market
orientation and learning orientation (innova-tiveness) were expected to positively infl uence business performance, because applied together they enabled the company not only to follow the customers expectations but to lead the market. Market-based organizational learning started to
be considered the optimal orientation.9
To measure this wider knowledge orientation (beyond market orientation), the concept of
knowledge management orientation was
devel-oped by J. Darroch and R. McNaughton.10 They
implemented a modifi ed MARKOR scale to test knowledge management orientation infl uence on organizations’ innovativeness, and indirectly on their business performance. Market orienta-tion concentrates on organizaorienta-tion’s market
rela-tions11 while the enterprise’s competitiveness is
also determined by other factors, such as new technology applications, its internal strengths and weaknesses. Therefore, J. Darroch and R. McNaughton claimed that knowledge manage-ment orientation estimations should include the whole portfolio of aspects infl uencing organiza-tions’ performance. An empirical research of New Zealand medium-sized companies enabled their segmenting into four clusters, i.e. scientifi c ori-ented companies (technology oriori-ented), knowl-edge management oriented companies (imple-menting market-based organizational learning), companies responsive to knowledge (applying market orientation) and non adopters (ignoring all aspects of knowledge). The best business per-formance results were achieved by knowledge management-oriented companies; they were better than the results of the companies respon-sive to knowledge and much better than the re-sults of two other clusters.
J. Darroch and R. McNaughton did not research any external or internal factors infl uencing the adoption of certain orientations by companies. However, the publications by A.H. Kohli and B.J. Jaworski mentioned earlier raised this very problem. According to these authors, the most important factor was the managers’ attitude. The opinions on the leading role of managers, espe-cially top managers, in determining the ways in which enterprises function was shared in nu-merous other publications.
Senior management knowledge orientation, i.e. their support for data gathering and dis-seminating, knowledge generating, sharing and implementing is treated as the major con-dition of knowledge project success. According
TRŽIŠ
TE
■ Vo l. X X II (2010), b r. 2, st r. 189 - 204“…transforming the company through knowl-edge and learning requires top management standing on the front lines of knowledge man-agement”. Organizational leadership was also considered crucial for any knowledge
manage-ment programaccording to K. Bell De Tienne,
G. Dyer, C. Hoopes and S. Harris13 „Because
lead-ers set the example for othlead-ers in the company, they have a direct impact on the organization’s culture and on how the company approaches and deals with knowledge management”. The importance of managers in deciding on com-panies’ knowledge practices resulting in their performance was also underlined by H. Hasan
and M. Al-hawari.14 They concentrated on four
knowledge management styles understood as managers’ personal attributes. They claimed that the best companies’ performance was a result of the optimal combination of knowledge man-agement styles.
A leading role of managers in developing knowl-edge processes in the companies was confi rmed
in empirical research projects. K.Y. Wong15
sug-gested that knowledge supporting managers of SMEs are followed by other company staff mem-bers, developing an organization’s knowledge
culture. J.D.Poltis16 claimed there was a
relation-ship between various leaderrelation-ship styles and the application of knowledge activities. In this sense he identifi ed a link between managers’ attitudes and companies’ practices.
CURRENT STUDY
In this paper, the knowledge orientation con-struct includes the features of both market and learning orientations. According to our concept, all knowledge-related activities determine the level of company’s knowledge orientation (CKO). Another construct applied in this study, named managers’ knowledge orientation (MKO), is aimed at refl ecting the managers’ attitudes towards knowledge processes. It is introduced to
appre-ciate the leading role of managers as a factor de-termining companies’ knowledge orientation. The third construct describes enterprise busi-ness performance (P). Target levels of busibusi-ness performance are achieved thanks to compa-nies’ competitive advantages, and knowledge is widely considered in literature to be their major
source.17
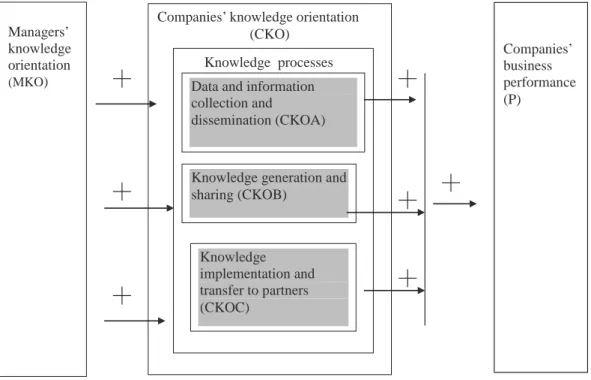
The main purpose of the study is to test the cor-relation between major constructs i.e. managers’ knowledge orientation, companies’ knowledge orientation and companies’ business perform-ance. The infl uence of managers on knowledge-related activities and behaviors, suggested in a literature, should be well-illustrated by the relationships between managers’ knowledge orientation and companies’ knowledge orienta-tion. Subsequently, knowledge-related activities and behaviors as a competitive advantage gen-erator should be related to enterprise business performance. The relations to be tested are illus-trated by the model (see Figure 1).
Knowledge processes are classifi ed by various authors into numerous categories. G. Probst, S.
Raub, K. Romhardt18 distinguished: knowledge
localization, knowledge collection, knowledge generation, knowledge sharing and dissemina-tion, knowledge implementation and storing.
J. Darroch and R. McNaughton19 mentioned
knowledge acquisition, knowledge dissemi-nation and responsiveness to knowledge. The model presented in Figure 1 also identifi es three categories of knowledge processes, i.e. data and information collection and dissemina-tion (CKOA), knowledge generadissemina-tion and sharing (CKOB), knowledge implementation and transfer to partners (CKOC).
The model suggests that managers’ knowledge orientation (MKO) positively infl uences each of the three processes of companies’ knowledge orientation (CKO), which in turn have a positive impact on companies’ business performance (P). This leads us to hypothesize:
TRŽIŠ
TE
■ Vo l. X X II (2010), b r. 2, st r. 189 - 204H1. The greater the level of managers’ knowl-edge orientation (MKO) the higher the compa-nies’ knowledge orientation (CKO).
H2. The higher the companies’ knowledge orien-tation (CKO) the better the companies’ business performance (P).
The model was simplifi ed by assuming one-way relationships between the constructs while, in fact, they are interdependent. For example, a good company’s fi nancial performance could infl uence both investing in knowledge infra-structure and manager’s attitude towards these activities. Another simplifi cation lies in assuming a linear character of the relationships. Therefore, the analysis will not tell us whether increasing knowledge orientation beyond a certain level will decrease company’s economic performance. MKO and CKO are latent constructs and cannot be directly observed; therefore, they have to be
identifi ed by measuring knowledge orienta-tion descriptors (attributes). There is no univer-sally accepted inventory of knowledge activities and behaviors just as there is no one inventory of managers’ attitudes, which combine rational and emotional elements as well as intentions to act in a certain way. Therefore, our initial task was to determine the descriptors of MKO and CKO based on a literature review and discussions with managers.
According to S.P. Myers20 cited by C.A. Conley and
W. Zheng,21 companies’ business performance is
determined by the interactions between their strategies, the context of their implementation and the behavior of people which is also infl u-enced by the context. In this situation, strategies and the context (conditions of their application) are the factors which matter. R. Snyman and C.J.
Kruger22 presented D. Logan’s23 opinion on
suc-cess factors of knowledge management. The list
Figure 1: Relationships between managers’ knowledge orientation, companies’ knowledge
orienta-tion and companies’ business performance
Source: Authors Managers’ knowledge orientation (MKO) Companies’ business performance (P)
Companies’ knowledge orientation (CKO) Knowledge processes Knowledge implementation and transfer to partners (CKOC)
Knowledge generation and sharing (CKOB)
Data and information collection and
TRŽIŠ
TE
■ Vo l. X X II (2010), b r. 2, st r. 189 - 204included: linking knowledge management to the overall strategy, developing an organization-al culture and discipline supporting knowledge sharing, collaboration and innovation, basing knowledge management on robust business and human processes, creating a compelling technology environment and assuring an ex-tended enterprise view on company’s processes, people and content. In other words, to succeed in knowledge management (to be knowledge oriented), the company should treat the knowl-edge strategy as an important part of an overall strategy, develop a knowledge-supporting cor-porate culture and organization, apply technol-ogy-supporting formal and informal information fl ows and relationships, and incorporate all the personnel members and all the activities under-taken into the knowledge system.
The presented views suggest, in our opinion, that knowledge processes should not be lim-ited exclusively to strategic decision-making. So, both strategic and operational perspectives are taken into consideration in our study, as strategic knowledge management requires operational support to plan, implement and control knowl-edge-related activities. This approach contra-dicts the idea of distinction between intellectual capital management and knowledge
manage-ment which was proposed by K.M. Wiig.24
Ac-cording to this author, knowledge management supports the creativity of intellectual capital as tactical/operational support. Intellectual capital consists of all kinds of intangible value drivers. Some authors divide intellectual capital into
hu-man capital and structural capital25 while others
consider human capital one of the three con-structs of intellectual capital, composed also of
structural capital and relational capital.26
Accord-ing to some other sources, intellectual capital consists of human capital, customer capital and
organizational capital.27 In the literature on
intel-lectual capital human capital is usually described as “a collection of knowledge and competences possessed by employees individually and
col-lectively in fi rms”.28 But it is not only the stock of
knowledge which matters. The fl ow of
knowl-edge seems more important than its stocks. And we claim that knowledge management is about managing this fl ow, including creating condi-tions to support knowledge-related activities.
According to O.A. Aliaga,29 knowledge-related
activities are both strategic and operational. We support this view.
Examination of the existing literature suggested fi nally that, while developing the questionnaire scales, the following descriptors (attributes) of knowledge orientation should be taken into consideration:
• managers’ involvement in knowledge-related
activities
• other staff involvement in knowledge-related
activities
• incorporating operational activities into
knowledge processes
• incorporating strategic activities into
knowl-edge processes
• organizational culture supporting
knowl-edge-related activities
• organizational structure supporting
knowl-edge-related activities
• technical infrastructure supporting
knowl-edge-related activities.
RESEARCH DESIGN
To consider the relationships between manag-ers’ knowledge orientation, companies’ knowl-edge orientation and company performance, quantitative methods were applied. The analysis was based on the data from the medium-sized companies operating in Poland. We expected that knowledge processes would diff er in enter-prises of various sizes, therefore we decided to concentrate only on the companies employing between 50 and 250 people. The population of companies to be researched was additionally re-duced by excluding high-tech branches, which we considered unique from the point of view of our topic. The sample then included the compa-nies representing the following branches:
TRŽIŠ
TE
■ Vo l. X X II (2010), b r. 2, st r. 189 - 204 • manufacturing • wholesale trade • retailing• hotels and restaurants
• companies engaged in cultural, recreational
and sports services
• surface transportation.
A proportional (by the branch and the region of Poland) sample, consisting of 40% of companies out of the 5250 meeting the required criteria, was drawn. A total of 852 interviews were conducted by telephone with top managers or their depu-ties (Computer Assisted Telephone Interview-ing). No full reply ratio amounted to 41.1% and was caused mostly by the refusal to declare sales value (29.3%) and the number of staff members (1.4%), which increased estimation errors. The interviews were based on a questionnaire. The fi rst part included the items addressing managers’ knowledge orientation while the second consist-ed of the items aimconsist-ed at determining the levels of companies’ knowledge orientation. The second part was subdivided into the blocks addressing three phases of the knowledge processes (data and information collecting, knowledge creation and sharing and knowledge implementation and transfer to partners). In both parts the same com-position of seven knowledge orientation descrip-tors (attributes) was applied (2-3 items per each descriptor). Additionally, in the fi rst part of the questionnaire three items describing the general managers’ opinions on the role of knowledge in achieving business goals were included. The third part of the questionnaire concerned the compa-nies’ business performance.
There are various measures of business perform-ance, which can be conceptualized in a number of ways. Many researches use the simple meas-ure, such as sales growth dynamics, while others argue that organizational performance is
multi-faced30 and that it should include both fi nancial
and non-fi nancial performance.31 The
informa-tion on precise fi nancial indicators is usually dif-fi cult to obtain from companies. Moreover, even
when researchers manage to get it, they can-not be sure whether certain results declared by companies are the consequence of the process-es being analyzed. Therefore, it is suggprocess-ested that the performance evaluation should be based on the opinions of well-informed respondents, who are aware of the performance changes in time and are able to make comparisons with
compet-itors.32 This suggestion was applied in a research
of knowledge management orientation of
com-panies in New Zealand.33
Both groups of performance indicators were used in the current study. The interviewed man-agers declared annual sales values and also com-pany results with regard to the following:
• actual companies' position versus
competi-tors' position (the stronger the position the better the performance),
• changes of the companies' economic
situa-tion in time (positive changes meant better performance),
• meeting the market and fi nancial targets (the
lower the realization to plan ratio the worse the business performance).
The companies' performance instrument con-sisted of a twelve-item scale (four items per cat-egory). The items in all three parts were scored on a fi ve-point response format, from strongly disagree (scored one) to strongly agree (scored fi ve). Some items were negatively scored. At the end of the interview the managers were asked to share information on their companies which would allow classifying the sample according to various criteria.
Although an instrument to measure the levels of MKO, CKO were to a certain extent grounded in the publications on market orientation and knowledge management orientation, the statis-tical methods applied to identify the construct values were diff erent than those applied by oth-er authors. To detoth-ermine the levels, a fuzzy sets
theory by L.A.Zadeh34 was implemented. Its core
concept is the membership function. The grades of the membership function are expected to
TRŽIŠ
TE
■ Vo l. X X II (2010), b r. 2, st r. 189 - 204belong to <0;1> set (0 - means no managers’ knowledge orientation, no companies’ knowl-edge orientation and 1- means the managers’ full knowledge orientation, and the companies’ full knowledge orientation; the higher the level of knowledge orientation the bigger the grade of membership to the set).
If the construct is defi ned by k attributes
(de-scriptors) of equal importance, the member-ship function which includes all of them may be compounded in the form of a mean of individual attributes’ membership functions.
f x
k
jf x
j k( )
=
( )
=∑
1
1 .The idea of implementing the fuzzy sets theory in the statistical analysis came from Rószkiewicz. She was also responsible for all the data
calcula-tions.35
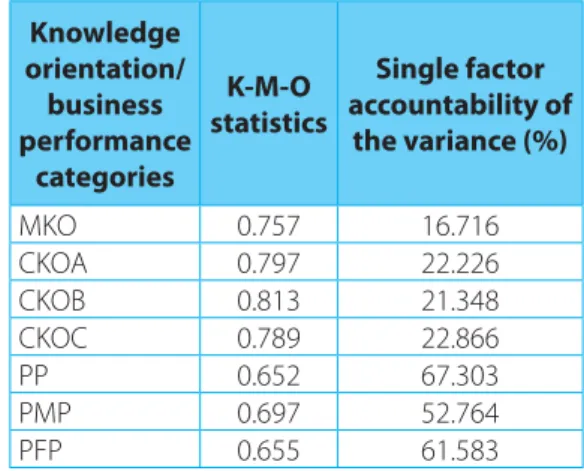
Quantifi cation of a latent construct is possible when the descriptors (scale items) are accept-ably reliable and valid. The scale’s theoretical validity, meaning its accuracy in defi ning the described category, was reviewed based on the literature review. Additionally, it was verifi ed by explanatory and confi rmatory factor analyses. The scale’s reliability was evaluated statistically. The alpha-Cronbach and Kaiser-Mayler-Olkin
co-effi cients were calculated.
Table 1:Alpha-Cronbach coeffi cients for the
scales measuring MKO, CKOA, CKOB, CKOC and PP, PMP, PFP Orientation / Business performance category Alpha-Cronbach coeffi cient MKO 0.471 CKOA 0.693 CKOB 0.680 CKOC 0.722 PP 0.837 PMP 0.685 PFP 0.788 Source: Research
Almost all the alpha-Cronbach coeffi cient values
suggest that the proposed items will properly re-fl ect the latent constructs. Only the
alpha-Cron-bach coeffi cient concerning the scales
measur-ing the managers’ knowledge orientation fell be-low the acceptable level, suggesting that some items only partially explain the latent structure. However, if some other combination of scale positioning is applied, the alpha-Cronbach coef-fi cient increases to 0.62, which still is not a high but can be accepted.
The latent constructs were also confi rmed by K-M-O statistics, suggesting the items’ loading consistently onto a single factor (see Table 2).
Table 2: Kaiser-Mayler-Olkin statistics and single
factor accountability of the variance
Knowledge orientation/ business performance categories K-M-O statistics Single factor accountability of the variance (%) MKO 0.757 16.716 CKOA 0.797 22.226 CKOB 0.813 21.348 CKOC 0.789 22.866 PP 0.652 67.303 PMP 0.697 52.764 PFP 0.655 61.583 Source: Research
All K-M-O statistics values were acceptable, as they exceeded 0.5. A low accountability of the variance by a single factor in the case of man-agers’ knowledge orientation was a result of the weak correlation of descriptors in question. Confi rmatory factor analysis enabled verify-ing the quality of the construct modelverify-ing. The model approximation goodness was then iden-tifi ed by calculating the following indicators: chi-square statistics, GFI, AGFI, RMSEA, HOELTER. The verifi cation procedure brought satisfactory
TRŽIŠ
TE
■ Vo l. X X II (2010), b r. 2, st r. 189 - 204RESEARCH RESULTS
Managers’ knowledge
orientation levels (MKO)
The average level of the managers’ knowledge orientation was relatively high and it amounted
to 0.8134. The managers turned out to be very ho-mogeneous in their attitudes towards knowledge (10% variation rate). The lowest level declared was 0.5 and the highest 1.0 (total orientation). The companies where the managers showed lower than average knowledge orientation account-ed for 42.6% of the sample, and the amount of their orientation represented 38.6% of the total sample amount. Other managers, whose level of
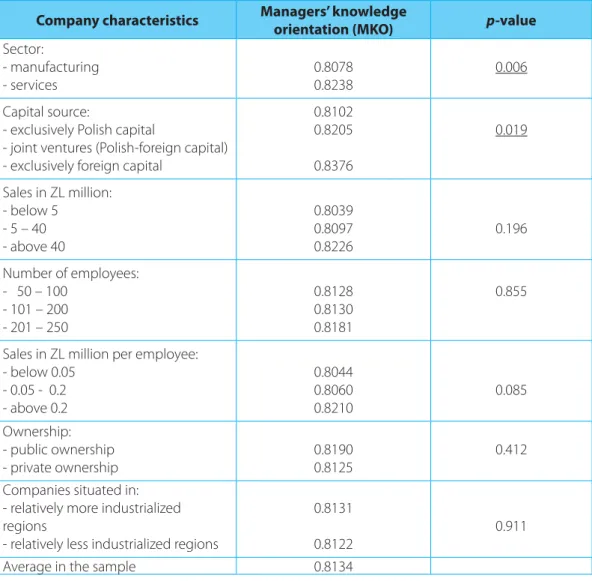
Table 3: Average levels of managers’ knowledge orientation in the groups of companies
Company characteristics Managers’ knowledge
orientation (MKO) p-value
Sector: - manufacturing - services 0.8078 0.8238 0.006 Capital source:
- exclusively Polish capital
- joint ventures (Polish-foreign capital) - exclusively foreign capital
0.8102 0.8205 0.8376 0.019 Sales in ZL million: - below 5 - 5 – 40 - above 40 0.8039 0.8097 0.8226 0.196 Number of employees: - 50 – 100 - 101 – 200 - 201 – 250 0.8128 0.8130 0.8181 0.855
Sales in ZL million per employee: - below 0.05 - 0.05 - 0.2 - above 0.2 0.8044 0.8060 0.8210 0.085 Ownership: - public ownership - private ownership 0.8190 0.8125 0.412 Companies situated in:
- relatively more industrialized regions
- relatively less industrialized regions
0.8131 0.8122
0.911
Average in the sample 0.8134
A result is said to be statistically signifi cant when the p-value is less than the present threshold value (in our case p=0.05). The p-values or less than 0.05 are underlined.
TRŽIŠ
TE
■ Vo l. X X II (2010), b r. 2, st r. 189 - 204knowledge orientation was above the sample av-erage, accounted for 57.4% of the total number researched, and the amount of their orientation accounted for 61.4% of the total sample amount. Table 3 presents the levels of MKO in the groups of companies classifi ed according to various cri-teria.
Major observations:
• The average level of the managers'
knowl-edge orientation in the service companies ex-ceeded the level of the managers' knowledge orientation in the manufacturing companies.
• The larger the share of foreign capital in the
company the higher the level of the manag-ers' knowledge orientation.
• Other criteria used to classify the groups of
companies did not noticeably infl uence the managers' knowledge orientation levels.
Companies’ knowledge
orientation levels (CKO)
The average level of CKO in the sample amount-ed to 0.6797. The companies turnamount-ed out to be
Table 4: Average levels of companies’ knowledge orientation in the groups of companies
Company characteristics Companies’ knowledge
orientation (CKO) p-value
Sector: - manufacturing - services 0.6726 0.6930 0.014 Capital source:
- exclusively Polish capital
- joint ventures (Polish-foreign capital) - exclusively foreign capital
0.6757 0.6855 0.7140 0.026 Sales in ZL million: - below 5 - 5 – 40 - above 40 0.6578 0.6840 0.6962 0.036 Number of employees: - 50 – 100 - 101 – 200 - 201 – 250 0.6736 0.6839 0.6984 0.140
Sales in ZL million per employee: - below 0.05 - 0.05 - 0.2 - above 0.2 0.6638 0.6758 0.6967 0.039 Ownership: - public ownership - private ownership 0.6852 0.6788 0.575 Companies situated in:
-relatively more industrialized regions - relatively less industrialized regions
0.6720
0.6827 0.384
Total 0.6797
A result is said to be statistically signifi cant when the p-value is less than the present threshold value (in our case p=0.05). The p-values of less than 0.05 are underlined.
TRŽIŠ
TE
■ Vo l. X X II (2010), b r. 2, st r. 189 - 204quite homogeneous in their knowledge activi-ties and behaviors (17% variation rate). The low-est level identifi ed was 0.21 and the highlow-est 0.98. The companies showing CKO below the sample average accounted for 52.7% of the sample number, and the amount of their orientation accounted for 45.8% of the total sample value. Other companies, whose level of knowledge orientation exceeded the sample average, ac-counted for 47.3% of the total sample number and the amount of their orientation represented 54.2% of the total sample value. Table 4 presents
structs. It amounted to 0.371 (p<0.001), which positively verifi es the hypothesis suggesting that the higher the level of MKO the higher the level of CKO.
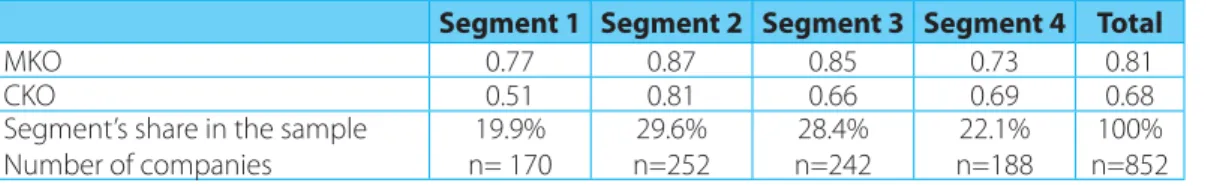
In order to deepen understanding of the relation-ship between MKO and CKO, the whole sample was segmented into four groups of companies. The k-average method was implemented to classify the companies according to the levels of both constructs. Table 5 presents the results of this classifi cation.
the levels of CKO in the groups of companies classifi ed according to various criteria.
Major observations:
• The average level of the companies'
knowl-edge orientation in the service companies exceeded slightly the level of companies' knowledge orientation in the manufacturing companies.
• The larger the share of foreign capital in the
company the higher the level of the compa-nies' knowledge orientation.
• The bigger the value of sales value and per
employee sales the higher the level of the companies' knowledge orientation.
• Other criteria used to classify the groups of
companies did not noticeably infl uence the companies' knowledge orientation levels.
MKO – CKO relationship
The Pearson correlation index was estimated to describe the relationship between the two
con-The highest levels of MKO and CKO were cal-culated in the case of segment 2, the lowest in segments number 1 and number 4. It is interest-ing to compare the MKO and CKO estimated for segment 3. The results show that in spite of the managers’ positive attitude towards knowledge (high MKO level), the knowledge activities and behaviors in the companies they manage are not intensive (low CKO level).
CKO - P relationship
The Pearson correlation index was estimated to describe the relationship between the two con-structs. In the case of CKO - P relationship r = 0.33 (p<0.01). The results of correlations concerning the relationship between CKO and three cate-gories of business performance were as follows: CKO - PP, r= 0.281 (p<0.001); CKO - PMP, r = 0.287 (p<0.001); CKO - PFP, r = 0.246 (p<0.001). They positively verify the second hypothesis, suggest-ing that the higher the companies’ knowledge orientation (CKO) the better the companies business performance (P).
Table 5: Average MKO and CKO levels in four company segments
Segment 1 Segment 2 Segment 3 Segment 4 Total
MKO 0.77 0.87 0.85 0.73 0.81
CKO 0.51 0.81 0.66 0.69 0.68
Segment’s share in the sample Number of companies 19.9% n= 170 29.6% n=252 28.4% n=242 22.1% n=188 100% n=852 Source: Research
TRŽIŠ
TE
■ Vo l. X X II (2010), b r. 2, st r. 189 - 204To understand how the combination of MKO and CKO aff ects the companies’ business perform-ance, the business performance levels achieved by the companies classifi ed earlier into four seg-ments – in total and according to three diff erent performance attributes – were calculated. They are presented in Table 6.
MKO in the case of some enterprises were not refl ected in high values of CKO. This suggested certain barriers to a transformation of the com-panies into knowledge-based comcom-panies by their highly knowledge oriented managers. The barriers can include:
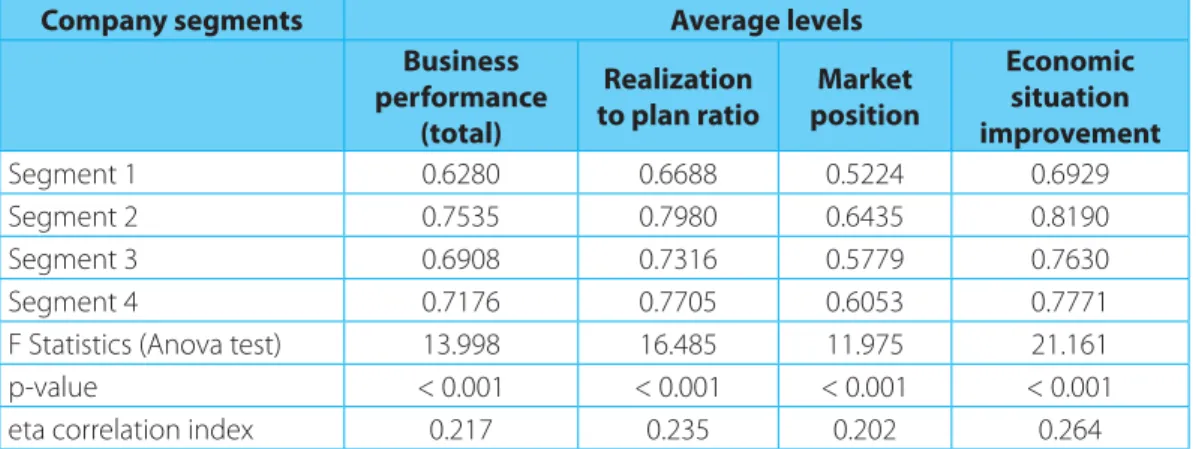
Table 6: Business performance levels in four segments of companies classifi ed by MKO, CKO levels
Company segments Average levels
Business performance (total) Realization to plan ratio Market position Economic situation improvement Segment 1 0.6280 0.6688 0.5224 0.6929 Segment 2 0.7535 0.7980 0.6435 0.8190 Segment 3 0.6908 0.7316 0.5779 0.7630 Segment 4 0.7176 0.7705 0.6053 0.7771
F Statistics (Anova test) 13.998 16.485 11.975 21.161
p-value < 0.001 < 0.001 < 0.001 < 0.001
eta correlation index 0.217 0.235 0.202 0.264
Source: Research
The p-value suggests that the segments explicit-ly diff er one from another and, at the same time, that both MKO and CKO infl uence the compa-nies’ business performance. The best business performance levels were registered in the com-panies with the highest levels of MKO and CKO (segment 2). Low levels of both MKO and CKO, or only CKO resulted in worse business perform-ance levels.
DISCUSSION
Both hypotheses suggesting the relationship between the managers’ knowledge orienta-tion (MKO) and the companies’ knowledge ori-entation (CKO), and between the companies’ business orientation (CKO) and their business performance (P) were supported. However the investigation of the relationship between the fi rst two constructs indicated that high levels of
• managers' reservations or inability to
imple-ment knowledge behaviors and activities in practice in spite of their positive attitude to-wards knowledge,
• human resource characteristics (educational
and cultural standards) restricting or delaying the implementation of certain knowledge behaviors and activities,
• external reasons (economic or legal
environ-ment).
The explanation of the situations in which the levels of MKO and CKO are not matched is spec-ulative and requires further research.
It is necessary to note that the current study concentrated on the intensiveness of knowl-edge processes in the companies, ignoring their quality. Therefore, relatively low correlation in-dexes between CKO and P could have been a consequence of the inferior quality of activities and behaviors connected with knowledge. For
TRŽIŠ
TE
■ Vo l. X X II (2010), b r. 2, st r. 189 - 204example, collecting a lot of information does not mean that the necessary information was gath-ered or that the information reached the right target. Also, intensive knowledge generation does not have to be the strength of a company if it does not increase the company’s competi-tive position or if it cannot be commercialized. Finally, in spite of wide knowledge implementa-tion the business performance may be restricted
by high investments and/or ineffi cient
innova-tion investments.
So, as the knowledge-related activities do not always increase the fi rm’s competitiveness, the problem of the quality of knowledge processes deserves further research.
Even though the links between MKO, CKO and P were weak, they still showed the benefi ts of knowledge orientation. This indicates to the managers that rational investments in knowl-edge are worthwhile.
CONCLUSION
The paper describes an instrument for assess-ing important managerial constructs: managers’ knowledge orientation and companies’ knowl-edge orientation. The research adds empirical evidence to the assertion that the managers’ attitudes towards knowledge, the companies’ knowledge orientation and their business per-formance are related. Managers with the high levels of knowledge orientation are expected to facilitate information fl ows, support employee development, encourage risk-taking and ex-perimenting, and include the staff members in strategic and operational decision-making. (The research results indicated, however, that some of them do not behave this way.) Subsequently, the high levels of knowledge-related activities and behaviors positively infl uence business perform-ance by enabling companies to take advantage of the innovativeness of their employees.
LITERATURE
1. Abhayawansa, S., Abeysekera, I.: An explanation of human capital disclosure from the
resource-based perspective, Journal of Human Resource Costing and Accounting, Vol. 12, No. 1, 2008,
pp. 51-64.
2. Aliaga, O.A.: Knowledge Management and Strategic Planning, Advances in Developing
Human Resources, No. 2, 2000, pp. 91-104.
3. Baker, W.E., Sinkula, J.M.: Learning Orientation, Market Orientation, and Innovation: Integrating
and Extending Models of Organizational Performance, Journal of Market-Focused
Manage-ment, Vol. 4, No. 4, 1999, pp. 295-308.
4. Baker, W.E., Sinkula, J.M.: The Synergistic Eff ect of Market Orientation and Learning Orientation on
Organizational Performance, Journal of the Academy of Marketing Science, Vol. 27, No. 4,
1999, pp. 411-427.
5. Bell De Tienne, K., Dyer, G., Hoopes, C., Harris, S.: Toward a Model of Eff ective Knowledge
Manage-ment and Directions for Future Research: Culture, Leadership, and CKO’s, Journal of Leadership
and Organizational Studies, Vol. 10, No. 4, 2004, pp. 26-43.
6. Bontis, N.: Assessing knowledge assets; a review of the models used to measure intellectual
capi-tal, International Journal of Management Reviews, Vol. 3, No. 1, 2001, pp. 41-60.
7. Chang, T.Z., Mehta, R., Chen, M.Y., Polsa, P., Mazur, J.: The Eff ects of Market Orientation on Eff
ec-tiveness and Effi ciency: The Case of Automotive Distribution Channels in Finland and Poland,
TRŽIŠ
TE
■ Vo l. X X II (2010), b r. 2, st r. 189 - 2048. Conley, C.A., Zheng, W.: Factors Critical to Knowledge Management Success, Advances in
De-veloping Human Resources, Vol. 11, No. 3, 2009, pp. 334-348.
9. Connor, K.R., Prahalad, C.K.: A resource-based theory of the fi rm: knowledge versus opportunism, Organization Science, Vol. 7, No. 5, 1996, pp. 477-501.
10. Logan, D.: Knowledge management scenario: measuring and managing intellectual asset- In:
Proceedings of the Gartner Symposium/ITexpo Africa, Sandton, South Africa, unpublished paper, 2001.
11. Darroch, J., McNaughton, R.: Beyond market orientation. Knowledge management and the
in-novativeness of New Zealand fi rms, European Journal of Marketing, Vol. 37, No. 3-4, 2003, pp.
407-429.
12. Darroch, J.: Developing a measure of knowledge management behaviors and practices, Journal
of Knowledge Management, Vol. 7, No. 5, 2003, pp. 41-54.
13. Edvinson, L., Malone, M.S.: Intellectual Capital: Realizing Your Company’s True Value by
Finding its Hidden Brainpower, Harper Business, New York, NY, 1997.
14. Hasan, H., Al-hawari, M.: Management styles and performance: a knowledge space framework, Journal of Knowledge Management, Vol. 7, No. 4, 2003, pp. 15-28.
15. Hooley, G., Fahy, J., Greenley, G., Beracs, J., Fonfara, K., Snoj, B.: Market orientation in the service
sector of the transition economies of central Europe, European Journal of Marketing, Vol. 37,
No. 1-2, 2003, pp. 86-106.
16. Jaworski, B.J., Kohli, A.K., Sahay, A.: Market driven versus driving markets, Journal of Academy of
Marketing Science, Vol. 28, No. 1, 2000, pp. 45-54.
17. Khatri, N., Ng, H.A.: The Role of Intuition in Strategic Decision-making, Human Relations, Vol. 53,
No. 1, 2000, pp. 57-86.
18. Kohli, A.K., Jaworski, B.J., Kumar, A.: MARKOR: A Measure of Market Orientation, Journal of
Mar-keting Research, Vol. 30, 1993, pp. 467-477.
19. Kohli, A.K., Jaworski, B.J.: Market Orientation: The Construct, Research Propositions and
Manage-rial Implications, Journal of Marketing, Vol. 54, 1990, pp. 1-18.
20. Kwaku, A.A., Satyendra, S.: Market orientation and Performance: An Empirical Study of British
SMEs, Journal of Entrepreneurship, Vol. 7, No. 1, 1998, pp. 27-47.
21. Lambin, L.L., Chumpitaz, R.: Being customer-driven is not enough, European Business, No. 2,
2000, pp. 28-34.
22. Mazur, J., Rószkiewicz, M., Strzyżewska, M.: Orientacja na wiedzę a wyniki ekonomiczne
przedsiębiorstwa, Warsaw School of Economics, Warsaw, 2008.
23. Morgana, R.E.: Market-Based Organisational Learning – Theoretical Refl ections and Conceptual
Insights, Journal of Marketing Management, Vol. 20, 2004, pp. 67-103.
24. Myers, S.P.: Knowledge management and organizational design, Butterworth-Heinemann,
Boston, MA, 1996.
25. Narver, J.C., Slater, S.F.: The Eff ect of a Market Orientation on Business Profi tability, Journal of
Marketing, Vol. 54, 1990, pp. 20-35.
26. Politis, J.D.: The relationship of various leadership styles to knowledge management, Leadership
& Organization Development Journal, Vol. 22, No. 8, 2001, pp. 354-364.
27. Probst, G., Raub, S., Romhardt, K.: Zarządzanie wiedzą w organizacji, Ofi cyna Ekonomiczna,
TRŽIŠ
TE
■ Vo l. X X II (2010), b r. 2, st r. 189 - 20428. Snyman, R., Kruger, C.J.: The interdependency between strategic management and strategic
knowledge management, Journal of Knowledge Management, Vol. 8, No. 1, 2004, pp. 5-19.
29. Venkatraman, R., Ramanujam,V.: Measurement of Performance in Strategy Research: A
Compari-son of Approaches, Academy of Management Review, Vol. 11, No. 4, 1986, pp. 801-814.
30. Warkentin, M., Sugumaran, V., Bapna, V.R.: E-knowledge networks for inter-organizational
collabo-rative e-business, Logistics Information Management, Vol. 14, No 1-2, 2001, pp. 149-162.
31. Wawrzyniak, B.: Zarządzanie wiedzą w przedsiębiorstwie, Wydawnictwo Wyższej Szkoły
Przedsiębiorczości i Zarządzania im, Leona Koźmińskiego, Warsaw, 2003.
32. Wiig, K.M.: Integrating intellectual capital and knowledge management, Long Range Planning,
Vol. 30, 1997, pp. 399-405.
33. Wong, K.Y.: Critical success factors for implementing knowledge management in small and medium
enterprises, IndustrialManagement and Data Systems, Vol. 105, No. 3-4, 2005, pp. 261-279.
34. Zadeh, L.A.: Fuzzy Sets, Information and Control, No. 8, 1965, pp. 338-353.
References
1 Narver, J.C., Slater, S.F.: The Eff ect of a Market Orientation on Business Profi tability, Journal of
Marketing, Vol. 54, 1990, pp. 20-35.
2 Kohli, A.K., Jaworski, B.J., Kumar, A.: MARKOR: A Measure of Market Orientation, Journal of
Mar-keting Research, Vol. 30, 1993, pp. 467-477.; Kohli, A.K., Jaworski, B.J.: Market Orientation: The
Construct, Research Propositions and Managerial Implications, Journal of Marketing, Vol. 54,
1990, pp. 1-18.
3 Kohli, A.K., Jaworski, B.J., Kumar, A.: op. cit., pp. 467-477.
4 Ibid.
5 Kwaku, A.A., Satyendra, S.: Market orientation and Performance: An Empirical Study of British
SMEs, Journal of Entrepreneurship, Vol. 7, No. 1, 1998, pp. 27-47.
6 Chang, T.Z., Mehta, R., Chen, M.Y., Polsa, P., Mazur, J.: The Eff ects of Market Orientation on
Eff ectiveness and Effi ciency: The Case of Automotive Distribution Channels in Finland and Poland,
Journal of Services Marketing, Vol. 13, No. 4-5, 1999, pp. 407-418.
7 Hooley, G., Fahy, J., Greenley, G., Beracs, J., Fonfara, K., Snoj, B.: Market orientation in the service
sector of the transition economies of central Europe, European Journal of Marketing, Vol. 37,
No. 1-2, 2003, pp. 86-106.
8 Baker, W.E., Sinkula, J.M.: Learning Orientation, Market Orientation, and Innovation: Integrating and
Extending Models of Organizational Performance, Journal of Market-Focused Management,
Vol. 4, No. 4, 1999, pp. 295-308.; Baker, W.E., Sinkula, J.M.: The Synergistic Eff ect of Market
Orientation and Learning Orientation on Organizational Performance, Journal of the Academy
of Marketing Science, Vol. 27, No. 4, 1999, pp. 411-427.
9 Morgana, R.E.: Market-Based Organisational Learning – Theoretical Refl ections and Conceptual
Insights, Journal of Marketing Management, Vol. 20, 2004, pp. 67-103.
10 Darroch, J., McNaughton, R.: Beyond market orientation. Knowledge management and the
in-novativeness of New Zealand fi rms, European Journal of Marketing, Vol. 37, No. 3-4, 2003, pp.
407-429.; Darroch, J.: Developing a measure of knowledge management behaviors and practices, Journal of Knowledge Management, Vol. 7, No. 5, 2003, pp. 41-54.
11 Jaworski, B.J., Kohli, A.K., Sahay, A.: Market driven versus driving markets, Journal of Academy of
TRŽIŠ
TE
■ Vo l. X X II (2010), b r. 2, st r. 189 - 20412 Warkentin, M., Sugumaran, V., Bapna, V.R.: E-knowledge networks for inter-organizational
collabo-rative e-business, Logistics Information Management, Vol. 14, No 1-2, 2001, pp. 152.
13 Bell De Tienne, K., Dyer, G., Hoopes, C., Harris, S.: Toward a Model of Eff ective Knowledge
Management and Directions for Future Research: Culture, Leadership, and CKO’s, Journal of
Leadership and Organizational Studies, Vol. 10, No. 4, 2004, pp. 34.
14 Hasan, H., Al-hawari, M.: Management styles and performance: a knowledge space framework,
Journal of Knowledge Management, Vol. 7, No. 4, 2003, pp. 15-28.
15 Wong, K.Y.: Critical success factors for implementing knowledge management in small and medium
enterprises, IndustrialManagement and Data Systems, Vol. 105, No. 3-4, 2005, pp. 261-279.
16 Politis, J.D.: The relationship of various leadership styles to knowledge management, Leadership
& Organization Development Journal, Vol. 22, No. 8, 2001, pp. 354-364.
17 Connor, K.R., Prahalad, C.K.: A resource-based theory of the fi rm: knowledge versus opportunism,
Organization Science, Vol. 7, No. 5, 1996, pp. 477-501.
18 Probst, G., Raub, S., Romhardt, K.: Zarządzanie wiedzą w organizacji, Ofi cyna Ekonomiczna,
Kraków, 2002, pp. 42.
19 Darroch, J., McNaughton, R.: op. cit., pp. 407-429.
20 Myers, S.P.: Knowledge management and organizational design, Butterworth-Heinemann,
Boston, MA, 1996.
21 Conley, C.A., Zheng, W.: Factors Critical to Knowledge Management Success, Advances in
Developing Human Resources, Vol. 11, No. 3, 2009, pp. 334-335.
22 Snyman, R., Kruger, C.J.: The interdependency between strategic management and strategic
knowledge management, Journal of Knowledge Management, Vol. 8, No. 1, 2004, pp. 11.
23 Logan, D.: Knowledge management scenario: measuring and managing intellectual asset- In:
Proceedings of the Gartner Symposium/ITexpo Africa, Sandton, South Africa, unpublished paper, 2001.
24 Wiig, K.M.: Integrating intellectual capital and knowledge management, Long Range Planning,
Vol. 30, 1997, pp. 400.
25 Edvinson, L., Malone, M.S.: Intellectual Capital: Realizing Your Company’s True Value by
Finding its Hidden Brainpower, Harper Business, New York, NY, 1997.
26 Bontis, N.: Assessing knowledge assets; a review of the models used to measure intellectual
capi-tal, International Journal of Management Reviews, Vol. 3, No. 1, 2001, pp. 41-60.
27 Wawrzyniak, B.: Zarządzanie wiedzą w przedsiębiorstwie, Wydawnictwo Wyższej Szkoły
Przedsiębiorczości i Zarządzania im, Leona Koźmińskiego, Warsaw, 2003, pp. 199.
28 Abhayawansa, S., Abeysekera, I.: An explanation of human capital disclosure from the resource-based
perspective, Journal of Human Resource Costing and Accounting, Vol. 12, No. 1, 2008, pp. 51.
29 Aliaga, O.A.: Knowledge Management and Strategic Planning, Advances in Developing
Human Resources, No. 2, 2000, pp. 96.
30 Venkatraman, R., Ramanujam,V.: Measurement of Performance in Strategy Research: A Comparison
of Approaches, Academy of Management Review, Vol. 11, No. 4, 1986, pp. 801-814.
31 Khatri, N., Ng, H.A.: The Role of Intuition in Strategic Decision-making, Human Relations, Vol. 53,
No. 1, 2000, pp. 57-86.
32 Lambin, L.L., Chumpitaz, R.: Being customer-driven is not enough, European Business, No. 2,
2000, pp. 28-34.
33 Darroch, J. (2003b): op. cit., pp. 52.
34 Zadeh, L.A.: Fuzzy Sets, Information and Control, No. 8, 1965, pp. 338-353.
35 Mazur, J., Rószkiewicz, M., Strzyżewska, M.: Orientacja na wiedzę a wyniki ekonomiczne
przedsiębiorstwa, Warsaw School of Economics, Warsaw, 2008.