Full Terms & Conditions of access and use can be found at
http://www.tandfonline.com/action/journalInformation?journalCode=vjeb20
Download by: [Universitas Maritim Raja Ali Haji] Date: 11 January 2016, At: 19:12
Journal of Education for Business
ISSN: 0883-2323 (Print) 1940-3356 (Online) Journal homepage: http://www.tandfonline.com/loi/vjeb20
Overeducation and Employment Mismatch: Wage
Penalties for College Degrees in Business
Ihsuan Li, Mathew Malvin & Robert D. Simonson
To cite this article: Ihsuan Li, Mathew Malvin & Robert D. Simonson (2015) Overeducation and Employment Mismatch: Wage Penalties for College Degrees in Business, Journal of Education for Business, 90:3, 119-125, DOI: 10.1080/08832323.2014.988204
To link to this article: http://dx.doi.org/10.1080/08832323.2014.988204
Published online: 22 Dec 2014.
Submit your article to this journal
Article views: 125
View related articles
View Crossmark data
Overeducation and Employment Mismatch: Wage
Penalties for College Degrees in Business
Ihsuan Li, Mathew Malvin, and Robert D. Simonson
Minnesota State University, Mankato, Mankato, Minnesota, USA
Overeducation and underemployment are of increasing national concern. Recent research estimates that 48% of workers are overeducated for their positions. The wage penalty for overeducation varies significantly across majors by gender. Using the American Community Survey (Ruggles et al., 2010), the authors examine the extent of overeducation among business-related majors. This article contributes to the literature with detailed results of the wage penalties by gender for each of the 13 business-related majors, controlling for occupational and industry classifications. Overall, this authors find the penalty for overeducation among most business-related majors to vary from 4% to 14%. Overeducated women in business-related majors, however, appear to suffer lower wage penalties compared to other majors.
Keywords: business majors, human capital, overeducation, returns to college education
Investment in human capital is widely accepted as generat-ing positive returns to individuals as well as the nation. Generally, human capital accumulates through education leading to increased productivity and wages. Education also generates positive spillover effects leading to higher economic growth and improved standard of living (Weisbrod, 1964).
In the United States, college degree holders presently account for approximately 30.4% of the population repre-senting an almost fourfold increase since the 1960s (U.S. Census Bureau, 2013). Among the factors driving the increase in college enrollment is the widening gap between lifetime expected earnings between college graduates and those with a high school degree only, known as the college wage premium (Katz & Murphy, 1992). According to the National Center for Educational Statistics (2014), the median earnings for bachelor degree holders between 25 and 34 years old in 2010 was approximately $45,000, com-pared to $21,000 for high school graduates. The tremen-dous growth in college enrollment also resulted in increasing student loan debt.
In a major study on salaries of college graduates, Carnevale, Strohl, and Melton (2010) calculated the earn-ings of college graduates at the 25th and 75th percentile for each of 171 college majors. The survey showed some
business majors (business management, business, and accounting) earned a median income ranging from $40,000 to $95,000. As a group, business students had the third highest median income ($60,000), after computer science and mathematics ($70,000), and engineering ($75,000).
However, with a current underemployment nearing 50% among college graduates (Vedder, Denhart, & Robe, 2013) the American public has also become more concerned about the pecuniary burden of student loan debt versus the wage premium associated with a college degree. Here we seek to provide an insight into overeducation among business-related majors and by gender. Business-business-related majors repre-sent the top three most popular majors among all college graduates in the United States, and female college graduates make up approximately half of that population (Carnevale et al., 2010).
REVIEW OF THE LITERATURE
Overeducation is not a recent phenomenon. Hecker (1992) and Vedder et al. (2013) have documented evidence of overeducation since the 1970s, increasing approximately from 11% in 1970 to 48% in 2010. Substantial research has examined this trend, with improved measurement techni-ques and varied hypotheses.
Research to date has established four general findings: (a) workers who have never married have lower incidences
Correspondence should be addressed to Ihsuan Li, Minnesota State University, Mankato, Department of Economics, 150 Morris Hall, Mankato, MN 56001, USA. E-mail: [email protected]
ISSN: 0883-2323 print / 1940-3356 online DOI: 10.1080/08832323.2014.988204
of overeducation (Robst, 2008), (b) the probability of being overeducated is higher for women (Battu, Belfield, & Sloane, 2000; Buchel & Battu, 2003), and the penalty is lower (Daly, Buchel, & Duncan, 2000), (c) the effects of overeducation do not diminish with age (Battu et al., 2000), and (d) overeducation varies by profession and occu-pation. For example, managers, leaders, entrepreneurs, and workers in positions requiring communication, planning, and literacy were more likely to be overeducated (Chevalier & Lindley, 2009; Green & McIntosh, 2007). The overedu-cation penalty for individuals with the same eduoveredu-cational attainment and in jobs with similar schooling requirements has ranged between 13% (Verdugo & Verdugo, 1989) to 20% or more (Chevalier, 2003; Robst, 2008). Similarly, the overeducation penalty varies by gender, but the difference is not significant (21.6% for men and 19.1% for women; Robst, 2008).
Explanations for the causes of overeducation fall mainly into three groups: (a) individuals become overeducated to compensate for fewer advancement opportunities (the advancement hypothesis; Buchel & Mertens, 2004), (b) worker heterogeneity among college graduates (the hetero-geneity hypothesis; Chevalier, 2003), and (c) oversupply of low demand majors (Vedder et al., 2013). The heterogene-ity hypothesis argues that as access to higher education widens, lower ability students join higher ability students in the college graduate pool (Chevalier, 2003). However, research controlling for matched counterparts, including gender and ability levels cannot explain the persistence of overeducation in the data (McGuinness, 2003; McGuinness, 2006; Green, McIntosh, & Vignoles, 1999). Although some evidence supports the advancement hypothesis, more recent papers find evidence to support the signaling hypothesis. The signaling hypothesis argues that a college degree has lost its value as a signal device to prospective employers as more students graduate with college degrees (Vedder et al., 2013).
Finally, research findings are limited by the difficult of properly measuring overeducation. Subjective and objec-tive measures have been used to evaluate whether an indi-vidual is overeducated. Subjective measures estimated the incidence from 17% to 32% (Chevalier, 2003). Objective measures, such as the one used in this paper, found a slightly wider incidence range 17% to 42% (Battu et al., 2000, Daly et al., 2000; Duncan & Hoffman, 1981).
This article contributes to the literature on overeducation by controlling for industry classifications and occupational codes, and provides overeducation penalties estimates for 13 business-related majors by gender. The addition of industry and occupational classifications allows us disen-tangle the overeducation estimates by business and industry specific skills. It follows the preferred convention of mea-suring overeducation as more than one standard deviation above modal educational attainment within the occupation. Finally, we use the 2011 (annual) American Community
Survey (ACS; Ruggles et al., 2010) to better capture the effect of the growth in college enrollment experienced in the last decade.
MODEL
The dominant framework for explaining earnings distribu-tions within developed economies was established by Gary Becker (1964). The Mincerian earnings model (1974) later provided the empirical structure to assess and measure human capital. National interest in human capital accumu-lation is based on the economic theory that it leads to increased productivity, income, and economic growth.
A direct measurement of human capital is not possible. The established convention follows the Mincerian earnings equation, which explains earnings as a function of human capital accumulated through education and work experi-ence:
EarningsDf Educationð ;ExperienceÞ:
Educational attainment is measured by years of educa-tion completed and by highest degree attained (high school, college, graduate, and professional). This model assumes college education adds to human capital by enhancing time management, accountability, and critical thinking skills, which in theory make an individual more productive in the workplace. Yet, some college majors are more narrowly tai-lored in skill sets (such as Accounting compared to general business or business management). Therefore, we control for the different majors within business degrees.
Here we employ the objective measure of overeducation (Battu et al., 2000). To derive the measure, we calculate the required education level by position, and estimate over-education with respect to the modal required over-educational level for a given position:
ReqEdu (required education): modal educational attainment plus or minus 1 standard deviation
Edu (matched-education): EduDReqEdu
OverEdu (overeducation): OverEdu D Edu–ReqEdu if Edu>ReqEdu
UnderEdu (undereducation): UnderEduD ReqEdu–Edu if
ReqEdu>Edu.
Following the model specified by Verdugo and Verdugo (1998), the theoretical expression is as follows:
Wage IncomeDf Education;Experience;Major;Xij
;
Where Xij is a vector consisting of observable indi-vidual characteristics, such as race (Robst, 2001), mar-riage status, presence of children (Green et al., 2002),
120 I. LI ET AL.
and gender (female) to capture the significant differen-ces by gender for overeducation, especially in the pres-ence of children under 18 years old (Green et al., 2002; McGoldrick & Robst, 1996).
Interaction terms are added in the empirical equation to isolate the effect of mismatched education to employment in each of the business majors (Robst, 2001). We also construct a proxy for years of work experience by subtracting the total years of schooling from the individuals’ age. This proxy introduces measurement error in the empirical model, but as the proxy would overestimate the experience variable in the likely presence of worker heterogeneity, its effect should cancel out (Verhaest & Omey, 2012). In addition, veteran, disability, federal government employee, and citizenship are included to capture important characteristics, which affect a worker’s wage rate. For control variables, we add state dum-mies to capture state fixed effects, as well as industry (16), occupation (25), and metro area dummies.
The final expression for the model is the following:
Wage Income D f (Education, Experience, Business Degree Majors, Female, Has Young Children, Marriage Status, Race, Veteran, Disability, Federal Government Employee, Citizenship, Metro, Occupation and Industry Classifications).
DATA
The data were obtained from the 2011 annual ACS (Rug-gles et al., 2010). The ACS is an annual and multiyear sur-vey conducted by the U.S. Census Bureau. The sample used in this study included individuals who had worked at least 40 hr a week in the previous year and earned nonzero wage income. We limited our analysis to individuals with a bachelor degree and holding one of the 13 business-related majors (see Table 1).
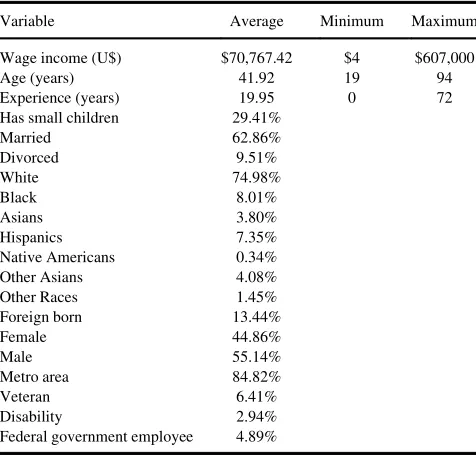
The summary statistics is based on weighted data. The sample consists of 20,659,080 observations. The average individual in this sample is 43 years old, has 21 years of experience; 28.5% of surveyed individuals has kids youn-ger than 13 years old; 60.7% are married; 77.3% are White, 6.6% are Hispanic, 6.6% are Black; 45% are women; and 81% live in a metropolitan area. Among all individuals sur-veyed, 20.25% have a bachelor’s degree (highest attained educational level). In this study, we define an individual to be overeducated for his or her position if workers in the same position are more than one standard deviation from the mode. According to this definition, among all individu-als who have attained a bachelor’s degree, 5.7% are said to be overeducated for their position. Among the control vari-ables, the dataset includes all 50 states, 16 industries, and 25 occupational codes. We coded variable has young chil-dren to equal one if the individual has chilchil-dren younger than 13 years old. Among Asian individuals (race) we
included Chinese, Indian, and Korean individuals. Other Asian individuals includes all other Asian ethnic groups. We also control for the presence of federal government employees, those with disabilities, veterans, and living in metropolitan areas.
We analyze wage differential data for 13 business-related majors by gender; to our knowledge, this is the most detailed research on overeducation of this type. We coded the fol-lowing majors: economics, general business, accounting, actuarial science, business and management administration, operations logistic and e-commerce, business economics, marketing and marketing research, finance, human resources and personnel management, international business, hospital-ity management, management information system, and mis-cellaneous business administration (see Table 2).
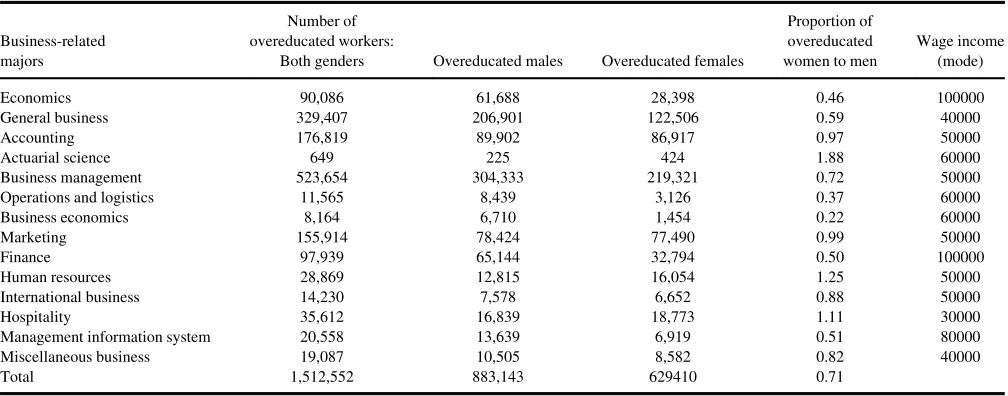
The modal wage income by majors range $30,000 (hos-pitality) to $100,000 (finance and economics). In the sam-ple, 4.7% of individuals with a bachelor degree are overeducated for their position. The incidence of overedu-cation among business-related majors is less than doubled (7.2%). Women in business-related majors make up about half (3%), and they major mostly in business management, general business, marketing, and accounting. The top four majors among all overeducated individuals in this sample were business management, general business, accounting, and marketing. The major with the least overeducated major was actuarial science.
METHODOLOGY
Since we are interested in the penalty from overeducation on wage income growth, we estimated the following
TABLE 1
Sociodemographic Summary Statistics (Weighted Averages)
Variable Average Minimum Maximum Wage income (U$) $70,767.42 $4 $607,000 Age (years) 41.92 19 94 Experience (years) 19.95 0 72 Has small children 29.41%
empirical equation:
CB43DisabilityCB44FederalGovernmentEmployee
CBð45¡94ÞStateDummiesCBð95¡110ÞIndustryDummies
CBð111¡135ÞOccupationDummies:
We estimated two sets of regressions: (a) the bench-mark linear model (with and without the full set of con-trols) using ordinary least squares (OLS) with robust standard errors; and (b) a two-stage least-squared method (2SLS; with and without the full set of con-trols). The predicted variable is log of wage income. The predictor variables include standard socioeconomic measures (SEM), indicator variables for individuals who are overeducated for their position by their college major, interaction term of the female variable with each of the indicator variables for overeducated individuals by major, and other control variables (states, industries, and occupations). Omitted in the equation, and therefore serving as benchmarks, are variables White (race) and male (gender), non–foreign born, Hawaii (state), mining (industry), and active military (occupation). We used Stata (ver. 13, StataCorp LP, College Station, TX) to run the regressions.
RESULTS AND DISCUSSIONS
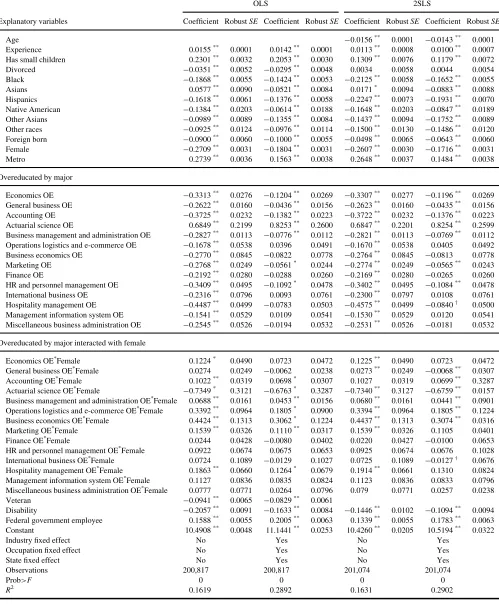
We discuss the results of the 2SLS regressions because OLS estimates are biased in the presence of endogeneity. The set of results from the 2SLS regression controls for state of residence, industries, occupations, and other socio-economic background. The overall fit of the model is .29 (R2). We estimated the coefficients with robust standard errors. The results of the full regressions are available upon request. Among the overeducated business-related majors, the penalties range from 4.4% (general business) to 13.8% (accounting). Two majors enjoyed a premium for overedu-cation (actuarial sciences and operations logistics). The estimated coefficients were significantly different from zero for economics (–12%), general business (–4.4%), busi-ness management (–7.7%), marketing (–5.7%), hospitality (¡8.4%), and human resources (–11%). These values fall within the range established by previous research (see Table 3).
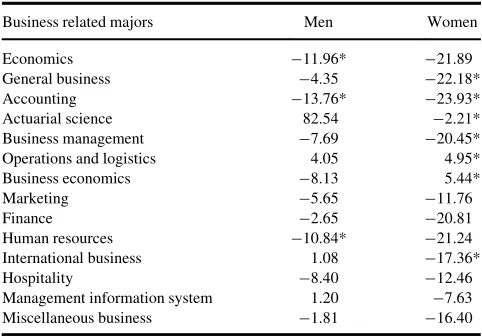
Ceteris paribus, females experience a 17.17% lower wage relative to men. However, among the overeducated in busi-ness-related majors (excluding actuarial science, interna-tional business, and general business), women in accounting, business management, logistics, and business economics realized a smaller wage penalty. Once we collect the coefficients for (a) overeducation by major and gender, (b) women, (c) overeducation by majors, the penalty from overeducation is reduced for some, and increased for others. Despite the overeducation premium for all actuarial science majors, once gender is considered, an overeducated female actuarial science major enjoys only a 2% premium over all other majors and male individuals. Conversely, women in
TABLE 2
Summary Statistics of Business-Related Majors by Gender
Business-related majors
Number of overeducated workers:
Both genders Overeducated males Overeducated females
Proportion of overeducated women to men
Wage income (mode) Economics 90,086 61,688 28,398 0.46 100000 General business 329,407 206,901 122,506 0.59 40000 Accounting 176,819 89,902 86,917 0.97 50000
Actuarial science 649 225 424 1.88 60000
Business management 523,654 304,333 219,321 0.72 50000 Operations and logistics 11,565 8,439 3,126 0.37 60000 Business economics 8,164 6,710 1,454 0.22 60000 Marketing 155,914 78,424 77,490 0.99 50000
Finance 97,939 65,144 32,794 0.50 100000
Human resources 28,869 12,815 16,054 1.25 50000 International business 14,230 7,578 6,652 0.88 50000 Hospitality 35,612 16,839 18,773 1.11 30000 Management information system 20,558 13,639 6,919 0.51 80000 Miscellaneous business 19,087 10,505 8,582 0.82 40000 Total 1,512,552 883,143 629410 0.71
Note: The sample (weighted) includes only individuals who worked full time (usual work hours of 40 or more per week), earned nonzero wage income, and whose highest educational attainment includes only a bachelor’s degree.
122 I. LI ET AL.
TABLE 3
Summary Regression Results
OLS 2SLS
Explanatory variables Coefficient RobustSE Coefficient RobustSE Coefficient RobustSE Coefficient RobustSE
Age ¡0.0156** 0.0001 ¡0.0143** 0.0001 Experience 0.0155** 0.0001 0.0142** 0.0001 0.0113** 0.0008 0.0100** 0.0007 Has small children 0.2301** 0.0032 0.2053** 0.0030 0.1309** 0.0076 0.1179** 0.0072 Divorced ¡0.0351** 0.0052 ¡0.0295** 0.0048 0.0034 0.0058 0.0044 0.0054 Black ¡0.1868** 0.0055 ¡0.1424** 0.0053 ¡0.2125** 0.0058 ¡0.1652** 0.0055
Asians 0.0577** 0.0090 ¡0.0521** 0.0084 0.0171* 0.0094 ¡0.0883** 0.0088
Hispanics ¡0.1618** 0.0061 ¡0.1376** 0.0058 ¡0.2247** 0.0073 ¡0.1931** 0.0070
Native American ¡0.1384** 0.0203 ¡0.0614** 0.0188 ¡0.1648** 0.0203 ¡0.0847** 0.0189
Other Asians ¡0.0989** 0.0089 ¡0.1355** 0.0084 ¡0.1437** 0.0094 ¡0.1752** 0.0089
Other races ¡0.0925** 0.0124 ¡0.0976** 0.0114 ¡0.1500** 0.0130 ¡0.1486** 0.0120
Foreign born ¡0.0900** 0.0060 ¡0.1000** 0.0055 ¡0.0498** 0.0065 ¡0.0643** 0.0060
Female ¡0.2709** 0.0031 ¡0.1804** 0.0031 ¡0.2607** 0.0030 ¡0.1716** 0.0031
Metro 0.2739** 0.0036 0.1563** 0.0038 0.2648** 0.0037 0.1484** 0.0038
Overeducated by major
Economics OE ¡0.3313** 0.0276 ¡0.1204** 0.0269 ¡0.3307** 0.0277 ¡0.1196** 0.0269
General business OE ¡0.2622** 0.0160 ¡0.0436** 0.0156 ¡0.2623** 0.0160 ¡0.0435** 0.0156
Accounting OE ¡0.3725** 0.0232 ¡0.1382** 0.0223 ¡0.3722** 0.0232 ¡0.1376** 0.0223
Actuarial science OE 0.6849** 0.2199 0.8253** 0.2600 0.6847** 0.2201 0.8254** 0.2599 Business management and administration OE ¡0.2827** 0.0113 ¡0.0776** 0.0112 ¡0.2821** 0.0113 ¡0.0769** 0.0112 Operations logistics and e-commerce OE ¡0.1678** 0.0538 0.0396 0.0491 ¡0.1670** 0.0538 0.0405 0.0492 Business economics OE ¡0.2770** 0.0845 ¡0.0822 0.0778 ¡0.2764** 0.0845 ¡0.0813 0.0778 Marketing OE ¡0.2768** 0.0249 ¡0.0561* 0.0244 ¡0.2774** 0.0249 ¡0.0565** 0.0243 Finance OE ¡0.2192** 0.0280 ¡0.0288 0.0260 ¡0.2169** 0.0280 ¡0.0265 0.0260 HR and personnel management OE ¡0.3409** 0.0495 ¡0.1092* 0.0478 ¡0.3402** 0.0495 ¡0.1084** 0.0478 International business OE ¡0.2316** 0.0796 0.0093 0.0761 ¡0.2300** 0.0797 0.0108 0.0761 Hospitality management OE ¡0.4487** 0.0499 ¡0.0783 0.0503 ¡0.4575** 0.0499 ¡0.0840y 0.0500
Management information system OE ¡0.1541** 0.0529 0.0109 0.0541 ¡0.1530** 0.0529 0.0120 0.0541
Miscellaneous business administration OE ¡0.2545** 0.0526 ¡0.0194 0.0532 ¡0.2531** 0.0526 ¡0.0181 0.0532
Overeducated by major interacted with female
Economics OE*Female 0.1224* 0.0490 0.0723 0.0472 0.1225** 0.0490 0.0723 0.0472
General business OE*Female 0.0274 0.0249 ¡0.0062 0.0238 0.0273** 0.0249 ¡0.0068** 0.0307
Accounting OE*Female 0.1022** 0.0319 0.0698* 0.0307 0.1027 0.0319 0.0699** 0.3287
Actuarial science OE*Female ¡0.7349* 0.3121 ¡0.6763* 0.3287 ¡0.7340** 0.3127 ¡0.6759** 0.0157
Business management and administration OE*Female 0.0688** 0.0161 0.0453** 0.0156 0.0680** 0.0161 0.0441** 0.0901
Operations logistics and e-commerce OE*Female 0.3392** 0.0964 0.1805* 0.0900 0.3394** 0.0964 0.1805** 0.1224
Business economics OE*Female 0.4424** 0.1313 0.3062* 0.1224 0.4437** 0.1313 0.3074** 0.0316
Marketing OE*Female 0.1539** 0.0326 0.1110** 0.0317 0.1539** 0.0326 0.1105 0.0401
Finance OE*Female 0.0244 0.0428 ¡0.0080 0.0402 0.0220 0.0427 ¡0.0100 0.0653
HR and personnel management OE*Female 0.0922 0.0674 0.0675 0.0653 0.0925 0.0674 0.0676 0.1028
International business OE*Female 0.0724 0.1089 ¡0.0129 0.1027 0.0725 0.1089 ¡0.0127y 0.0676 Hospitality management OE*Female 0.1863** 0.0660 0.1264* 0.0679 0.1914** 0.0661 0.1310 0.0824 Management information system OE*Female 0.1127 0.0836 0.0835 0.0824 0.1123 0.0836 0.0833 0.0796 Miscellaneous business administration OE*Female 0.0777 0.0771 0.0264 0.0796 0.079 0.0771 0.0257 0.0238 Veteran ¡0.0941** 0.0065 ¡0.0829** 0.0061
Disability ¡0.2057** 0.0091 ¡0.1633** 0.0084 ¡0.1446** 0.0102 ¡0.1094** 0.0094 Federal government employee 0.1588** 0.0055 0.2005** 0.0063 0.1339** 0.0055 0.1783** 0.0063 Constant 10.4908** 0.0048 11.1441** 0.0253 10.4260** 0.0205 10.5194** 0.0322
Industry fixed effect No Yes No Yes
Occupation fixed effect No Yes No Yes
State fixed effect No Yes No Yes
Observations 200,817 200,817 201,074 201,074
Prob>F 0 0 0 0
R2 0.1619 0.2892 0.1631 0.2902
Note: The sample data include only individuals who were sampled in the annual ACS 2011 survey, worked full time, earned nonzero income, and had only a bachelor’s degree. The regressions are unweighted.
yp.10.*p.05.**
p.01.
accounting, economics, general business, business manage-ment, finance, and human resources all suffer a net wage penalty of approximately 20% relative to all men and majors. There are two exceptions that are significant and positive: females who are overeducated for their positions and majored in operations and logistics and business eco-nomics enjoy a net premium of 5% and 5.4%, respectively, over all men and other majors (see Table 4).
Other variables that are significant in the results are dis-ability (penalty of 11%), and federal government employee (premium of 17.8%).
Once industry and occupation classifications are con-trolled (albeit a rough approximation), the wage penalties for overeducated business majors are significantly reduced (compared to previous literature and regression results with-out controls). In general, the estimates of overeducation are within the range found in the literature but narrower. How-ever, the extent of the impact is not homogenous across busi-ness majors, especially for women. One potential explanation for the unequal impact by major is the inability of college graduates to clearly signal potential productivity due to pooling in the labor market. Another possible expla-nation is the specialized nature of some business majors, such as actuarial science and accounting, which require licensure to practice the profession as actuary and certified public accountant. Licensing exams may serve as a screen-ing mechanism, which eliminates weaker candidates from seeking the degree, therefore thinning the lower end of the abilities distribution tail. Interestingly, overeducated women who majored in business economics and operations logistics do not suffer any wage penalties but rather enjoy a premium for overeducation compared to men and all other majors (which suggests need for further investigation). Finally, females in most business majors suffer a lower wage penalty
for being overeducated compared to overeducated males in the same business-related majors.
CONCLUSION AND IMPLICATIONS
Overeducation and the associated wage penalty have been studied extensively. The literature finds that the individuals who are overeducated in fields that were not related to their studies were subjected to three times the penalty of those whose degree majors were related (Chevalier, 2003). How-ever, among business-related majors, overeducation carries dissimilar wage penalties. Further, when gender is taken into account, female workers who are overeducated in a busi-ness-related major suffer a lower wage penalty relative to females in other majors. Two majors in this paper are of par-ticular interest: women overeducated in operations logistics and business economics majors enjoyed a net premium of about 5%.
This paper examined ACS data for business-related majors to answer the question of whether overeducation wage penalty is still present and whether gender has an addi-tional impact on the penalty. The results for some of the 13 overeducated business-related majors were not significantly different from zero. For most majors, the penalty was nar-rower than found in previous literature. There is heterogene-ity across business-related majors, with actuarial science, business economics, and operation logistics showing unusual values. The implication of the results suggest that while over-education in general penalizes the worker for a given posi-tion, females in business and related majors are not penalized as heavily compared to females in other majors who are over-educated for their positions. Future researchers should con-sider additional control variables for detailed occupational ranks as well as a more precise measure of years for work experience for more robust results.
REFERENCES
Battu, H., Belfield, C., & Sloane, P. (2000). How well can we measure graduate over education and its effects?National Institute Economic Review,171, 82–93.
Battu, H., & Sloane, P. J. (2002). To what extent are ethnic minorities in Britain overeducated.International Journal of Manpower,23, 192–207. Becker, G. (1964).Human capital: A theoretical and empirical analysis
with special reference to education.New York, NY: Columbia
Univer-sity Press.
Buchel, F., & Battu, H. (2003). The theory of differential over-qualifica-tion: Does it work?Scottish Journal of Political Economy,50, 1–16. Buchel, F., & Mertens, A. (2004). Over-education, undereducation, and the
theory of career mobility.Applied Economics,36, 803–816.
Carnavale, A. P., Strohl, J., & Melton, M. (2011).What’s it worth? The
economic value of college majors. Washington, DC: Georgetown
Uni-versity Center on Education and the Workforce.
Chevalier, A. (2003). Measuring over-education.Economica,70, 509–531. Chevalier, A., & Lindley, J. (2009). Over-education and the skills of UK
graduates.Journal of the Royal Statistical Society,172, 307–337.
TABLE 4
Summary of Wage Penalties for Overeducated Business Related Majors by Gender
Business related majors Men Women Economics ¡11.96* ¡21.89 General business ¡4.35 ¡22.18* Accounting ¡13.76* ¡23.93* Actuarial science 82.54 ¡2.21* Business management ¡7.69 ¡20.45* Operations and logistics 4.05 4.95* Business economics ¡8.13 5.44* Marketing ¡5.65 ¡11.76 Finance ¡2.65 ¡20.81 Human resources ¡10.84* ¡21.24 International business 1.08 ¡17.36* Hospitality ¡8.40 ¡12.46 Management information system 1.20 ¡7.63 Miscellaneous business ¡1.81 ¡16.40
Note: Wage differential (in percent) relative to all other majors. *Signif-icant at 10% level.
124 I. LI ET AL.
Daly, M. C., Buchel, F., & Duncan, G. J. (2000). Premiums and penalties for surplus and deficit education: Evidence from the United States and Germany.Economics of Education Review,19, 169–178.
Duncan, J., & Hoffman, S. (1981). The incidence and wage effects of over-education.Economics of Education Review,1, 75–86.
Green, F., & McIntosh, S. (2007). Is there genuine underutilization of skills amongst the over-qualified.Applied Economics,39, 427–439.
Green, F., McIntosh, S., & Vignoles, A. (1999).Over-education and skills:
Clarifying the concepts. London, England: Center for Economic
Performance.
Green, F., McIntosh, S., & Vignoles, A. (2002). The utilization of educa-tion and skills: Evidence from Britain.The Manchester School,70(60), 792–811.
Hecker, D. E. (1992). Reconciling conflicting data on jobs for college grad-uates.Monthly Labor Review,115, 3–12.
Katz, L., & Murphy, K. M. (1992). Changes in relative wages, 1963–1987: Sup-ply and demand factors.The Quarterly Journal of Economics,107, 35–78. McGoldrick, K., & Robst, J. (1996). Gender differences in over-education:
A test of the theory of differential over-qualification.The American
Eco-nomic Review,86(2), 280–284.
McGuinness, S. (2003). Graduate over-education as a Sheepskin effect: Evidence from Northern Ireland.Applied Economics,35, 597–608. McGuinness, S. (2006). Over-education in the labour market.Journal of
Economic Surveys,20, 387–418.
National Center for Education Statistics. (2014).The condition of
educa-tion 2014 (NCES 2014-083), annual earnings of young adults.
Washing-ton, DC: National Center for Education Statistics, U.S. Department of Education.
Robst, J. (2001). Post school investment and wage differntials: Some fur-ther evidence.Southern Economic Journal, 121–132.
Robst, J. (2008). Over-education and college major: Expanding the defini-tion of mismatch between schooling and jobs.The Manchester School,
76, 349–368.
Ruggles, S., Alexander, J. T., Genadek, K., Goeken, R., Schroeder, M. B., & Sobek, M. (2011).Integrated public use microdata series: Version 5.0[Machine readable database]. Minneapolis, MN: Minnesota Popula-tion Center.
Sloane, P., Battu, H., & Seaman, P. (1996). Over-education and the formal education/experience and training trade-off.Applied Economics Letters,
3, 511–515.
Sloane, P., Battu, H., & Seaman, P. (1999). Over-education, underedu-cation and the Brittish labour market. Applied Economics, 31, 1437–1453.
Verdugo, R. R., & Turner Verdugo, N. (1988). The impact of surplus schooling on earnings. The Journal of Human Resources, 24, 629–643.
Verhaest, D., & Omey, E. (2012). Over-education, undereducation and earnings: Further evidence on the importance of ability and measure-ment bias.Journal of Labor Resources,33, 76–90.
Vedder, R., Denhart, C., & Robe, J. (2013, January 24).Why are recent college graduates underemployed? University enrollments and labor
market realities. Center for College Affordability and Productivity.
Retrieved from http://centerforcollegeaffordability.org/uploads/ Underemployed%20Report%202.pdf
Weisbrod, B. A. (1964).External benefits of public education: An
eco-nomic analysis. Princeton, NJ: Princeton University.