Full Terms & Conditions of access and use can be found at
http://www.tandfonline.com/action/journalInformation?journalCode=vjeb20
Download by: [Universitas Maritim Raja Ali Haji], [UNIVERSITAS MARITIM RAJA ALI HAJI Date: 12 January 2016, At: 17:49
Journal of Education for Business
ISSN: 0883-2323 (Print) (Online) Journal homepage: http://www.tandfonline.com/loi/vjeb20
An Empirical Assessment of Peer Review
Reliability: The Ipsitive Instrument Paradox
Mark A. Ward
To cite this article: Mark A. Ward (2005) An Empirical Assessment of Peer Review Reliability: The Ipsitive Instrument Paradox, Journal of Education for Business, 81:1, 35-40, DOI: 10.3200/ JOEB.81.1.35-40
To link to this article: http://dx.doi.org/10.3200/JOEB.81.1.35-40
Published online: 07 Aug 2010.
Submit your article to this journal
Article views: 32
View related articles
ABSTRACT. This empirical study
examines methodologies used to
assess individual contributions to
group performance, with a special
emphasis on ipsitive instruments. Five
project management teams were
formed in a graduate-level business
course. At the conclusion of the
projects, individuals were asked to
assess both themselves and group
peers by using a variety of evaluation
methods. It is interesting to note that
these data seemed to show a
paradoxi-cal relationship between ipsitive
instrument accuracy and perceived
importance. The author discusses
other important ramifications for both
the academic community and project
management in general. He concludes
with lessons learned from the study
and posits avenues for future research.
imely and accurate evaluations of individual contributions to group performance are critically important. Indeed, researchers have conducted numerous studies on the importance and difficulties involved in group project evaluation (especially individual contri-butions in these groups) in both the schol-arly community and private sector (e.g., Bourner, Hughes, & Bourner, 2001; Chen & Lou, 2004; Lejk & Wyvill, 2001; Li, 2001; Reagan & Rohrbaugh, 1990; Saavedra & Kwun, 1993; Stubblebine, 2001). Study results have shown that peer evaluation is an effective way to evaluate people who work in groups. Peers usual-ly work in closer proximity to each other and have more frequent interactions with each other than individual team members have with a project supervisor. For that reason, peer evaluations typically pro-duce more distinctive results than do those that simply reflect the project supervisor’s impressions of individual team member performance (Chen & Lou). In the present study, I examined the role of two basic forms of peer and self-evaluation by using ipsitive and nonipsi-tive instruments in group projects.
Literature Review
The results of previous research have shown that when individuals in groups are informed that they will receive an evaluation for tasks they are about to
perform, they tend to perform better than do those in groups who believe they will not receive an evaluation (Harkins, White, & Utman, 2000; Szy-manski & Harkins, 1987; White, Kjel-gaard, & Harkins, 1995). At the same time, however, if individuals believe they are being unfairly evaluated, they may adopt strategies that will mediate these unfair (from their perspective) appraisals. Hence, inappropriate or inefficient appraisal methods can lead to dysfunctional teams by creating unhealthy intermember competition (Boud, Cohen, & Sampson, 1999), which is why the study of assessment methods is so important.
One of the most widely accepted and cited theories concerning the impor-tance of peer evaluations is the ego-task theory, which posits that individuals attempt to boost their self-esteem by eliciting positive evaluations from group evaluations (Greenwald & Breck-ler, 1985; Parker, 2001). Although this perspective is gaining wide acceptance, precisely how one should attempt to accurately gauge a person’s contribution has been and continues to be the subject of numerous, often conflicting, studies. For example, one of the most significant problems with performance evaluations is that they tend to be inflated (Ilgen & Feldman, 1983; Landy & Farr, 1983; Longenecker, Sims, & Gioia, 1987). It is important to note that this inflation
An Empirical Assessment of
Peer Review Reliability:
The Ipsitive Instrument Paradox
MARK A. WARD
SOUTHERN ILLINOIS UNIVERSITY AT EDWARDSVILLE EDWARDSVILLE, ILLINOIS
T
does not generally occur from an inabil-ity to conduct accurate assessments. Instead, high-stakes incentive systems (e.g., grades, monetary inducements, peer pressure) encourage individuals to report disingenuous results (Murphy & Cleveland, 1991).
Some researchers have argued that a secret peer assessment system (in which an individual’s ratings of others are not shared with them) that does not include self-evaluations tends to remove these inflationary tendencies and, indeed, may be an accurate and fair group per-formance appraisal method (Lejk & Wyvill, 2001). The logic of such a per-spective is instructive. For example, in previous research, the inclusion of self-evaluations when rating peers in a group has yielded results that suggest the self-evaluations are not as accurate when compared with the peer evaluations (Goldfinch, 1994). Some research results also suggest that participants who make the least contribution to a project tend to overinflate their own evaluations (i.e., self-evaluations) in comparison to their peers’ evaluations of them. Conversely, individuals who make the most significant contributions to a project tend to underinflate their ratings in comparison to their peers’ evaluations of them (Lejk & Wyvill, 2001). The ramifications of these empir-ical studies are relatively straightfor-ward. In a rating system that does not include a self-assessment, the generous group member is penalized because he or she will tend to inflate peer ratings while simultaneously incurring relative-ly lower ratings from his or her peers (Goldfinch).
Fairness and accuracy are perennial issues in any evaluation system. These constructs are correlated, but they are not identical. Indeed, the choice of eval-uation instruments can emphasize one of these elements over the other. An ipsitive method, which mandates a rank ordering of individual performances, illustrates these differences. Notably, in an ipsitive evaluation scheme, it is not possible for an individual to be overgen-erous in his or her evaluations because the system eliminates the possibility of inflation in that the summation of all ratings will always, by design, be aver-aged. At the same time, a high-stakes
ipsitive or rank-ordering system (more accurately, the expectation of a rank ordering) will tend to reduce coopera-tion among team members. That is, when individuals are involved in a zero-sum ranking system, an inherently (and arguably unhealthy) competitive envi-ronment is created because the system will invariably create winners and losers (Boud et al., 1999).
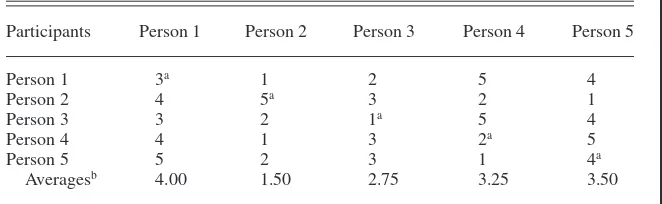
Another potential difficulty with ipsi-tive rating systems occurs when a major-ity of the assessments should fall into one extreme (high contributions) or the other (low contributions). For example, consider the following scenario: Team A consists of five highly motivated team members, all of whom made a signifi-cant contribution to a project. If each team member views each participant’s involvement as equally laudatory, then it would be nearly impossible for a team member to rank order his or her fellow team members in any meaningful way. As a result, because each team member is forced to rank order the other partici-pants, he or she should randomly assign the rank orderings. Table 1 illustrates the Team A example (ratings were created by a random number generator). The minimum and maximum scores using this particular methodology are 1 and 5, respectively. The average score across all participants is 3.00. In this example, the ipsitive process produced a low score of 1.50 and a high score of 4.00—both of which were randomly generated. It is important to note that all five team mem-bers have made a significant contribu-tion to the project. However, three indi-viduals receive ratings below the average. In these three cases, the rating is a reflection of the evaluation method-ology and is neither accurate nor fair.
In less extreme cases, it might be pos-sible for a team member to delineate between peers in a group made up of exclusively highly motivated and pro-ductive individuals. Returning to the Team A example, imagine these delin-eations are valid from the perspective that Person 4 (3.25) made a slightly less, but still significant, contribution than Person 5 (3.50), and so on. In this instance, it might be possible to accu-rately rank order people in this group. However, to assign a mediocre ranking to an individual who has made a signif-icant contribution (although less than his or her peers) to a group project would be both accurate (valid ranking) and unfair (meriting a higher rating than mediocre). A nonipsitive rating system could be more effective in this case. If a team member believes every person in the group has made a significant contri-bution but with some minor variations in involvement, this individual could still assign a high rating to every team member, deducting or adding a small number of points to reflect these small distinctions.
METHOD
Thirty graduate students in a medium-sized Midwestern university were enrolled in a business course designed to assist them in exploring ways to manage technology. One of the primary objec-tives of the course was to develop and improve each participant’s capacity to work in groups and effectively use theo-retical principles (that they gathered through project studies, instruction, and class discussions) with respect to tech-nology management. The project man-agement case study required students to
TABLE 1. Team A: Peer-Review (Random) Ratings
Participants Person 1 Person 2 Person 3 Person 4 Person 5
Person 1 3a 1 2 5 4
Person 2 4 5a 3 2 1
Person 3 3 2 1a 5 4
Person 4 4 1 3 2a 5
Person 5 5 2 3 1 4a
Averagesb 4.00 1.50 2.75 3.25 3.50
aSelf-evaluations. bAverages do not include self-evaluations.
form and join one of five teams, select projects, perform analyses, and report their findings. Membership in any par-ticular team was voluntary, but each stu-dent had to become a member of a team by a specified deadline. Notably, by design, no group leaders or supervisors were assigned. If group members chose to appoint a group leader or if a de facto group leader emerged from the member-ship during the project, the activity was neither encouraged nor discouraged by the professor. At the conclusion of their presentations (which coincided with the conclusion of the course), each team had to conduct performance evaluations. Before the surveys were distributed, the respondents were briefed as follows: “All results will be kept strictly confi-dential. Results will be aggregated and not attributed to any single individual.”
I developed a basic template for both instruments. The template asked for demographic information and to include number of years of work, management, and project management experience. I gathered this information to ascertain what influence, if any, these factors might have had on peer-review rank-ings. The first instrument asked partici-pants to rate their peers by using a (non-ipsitive) Likert-type scale, which is a common approach to measuring peer performance (e.g., Lei & McBride-Chang, 1997; Norcini, 2003). In addi-tion, some research results suggested that in certain situations, peer assess-ment surveys should be both “low stakes” and “anonymous” (Norcini, p. 542). The Likert-type instrument assured anonymity, but the results were used, in part, to calculate students’ grades. Hence, it seemed likely that there would be a tendency toward infla-tion because of the high-stakes nature of the survey. In an attempt to both mea-sure and mediate this inflation, I gave a second (ipsitive) instrument that was low stakes in the sense that it would not be used to calculate students’ grades. The particulars of these instruments fol-low hereinafter.
Two assessment methods (ipsitive and nonipsitive instruments) were used to gauge individual performance on each team. The first survey (nonipsi-tive) distributed to participants asked each respondent to rate his or her
con-tribution (e.g., a self-evaluation) and each team member’s contribution to the project. A Likert-type scale, rang-ing from 1 (low contribution) to 10 (high contribution), was used. By design, the respondents were allowed to define “contribution” in any way they saw fit. Several important pieces of information were provided to respondents before they made these assessments on the first survey. First, each team member was asked to give as honest and fair an evaluation as pos-sible of all participants on his or her team (including himself or herself). Second, there was no quota on how individuals scored their peers. That is, they could rank any or all participants as 1 or 10, or anything in between. Third, the self-assessment portion of the survey would not be used to deter-mine the student’s grade. That is, the evaluation that an individual gave him-self or herhim-self would not be used in any grade calculation. Instead, the average of the participant’s project team mem-bers’ peer evaluations would be used to determine the individual’s participa-tion grade. Fourth, all survey respons-es would remain completely confiden-tial. Because the student’s contribution grade was an average of the aggregate of all of his or her team members, it would be almost impossible to ascribe a particular ranking to any one individ-ual. Finally, although this survey was technically a high-stakes assessment in that it influenced each person’s score in the course, the peer review account-ed for only 5% of each student’s over-all grade.
After the participants had filled out the first survey, they were given a sec-ond survey. The secsec-ond instrument used an ipsitive coding scheme. The respon-dents were again advised that all results would be kept strictly confidential; results would be aggregated and not attributed to any single individual. The participants were then briefed that they should rank order each person on their team with respect to how much of a con-tribution each person made. For exam-ple, the person who made the biggest contribution would be assigned a value of 1. The person who made the second biggest contribution to the project should be assigned a 2, and so on. Each respondent was also asked to include himself or herself in the ranking. One should note that the participants were also notified that not only would these results not be used for any grading pur-poses, but also that the results would be kept strictly confidential.
I created several models to analyze data collected from the two surveys. Among these models, I used a Pearson product-moment correlation coefficient to assess the degree of correlation between the nonipsitive and ipsitive peer-review results. I used this statistic to eval-uate to what extent, if any, inflation was present in the nonipsitive high-stakes rat-ings. I correlated self-assessments to peer-assessment averages by using the same correlation coefficient technique. I conducted this test to try to determine the level of agreement between how individ-uals viewed their own contributions ver-sus how their peers viewed each individ-ual’s contribution to the project.
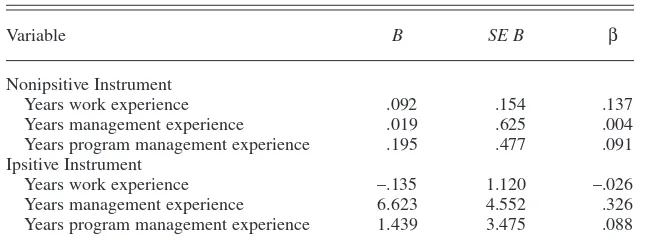
TABLE 2. Summary of Enter Regression Analysis for Variables Predict-ing Peer Assessments (N= 30)
Variable B SE B β
Nonipsitive Instrument
Years work experience .092 .154 .137 Years management experience .019 .625 .004 Years program management experience .195 .477 .091 Ipsitive Instrument
Years work experience –.135 1.120 –.026 Years management experience 6.623 4.552 .326 Years program management experience 1.439 3.475 .088
Note. R2= .038 for nonipsitive instrument. R2= .131 for ipsitive instrument. B= unstandardized
coefficients; SE B= standard error of B.
RESULTS
I collected data from all 30 respon-dents at the completion of the project. All participants turned in usable surveys.
Demographics and Nonipsitive Instrument Results
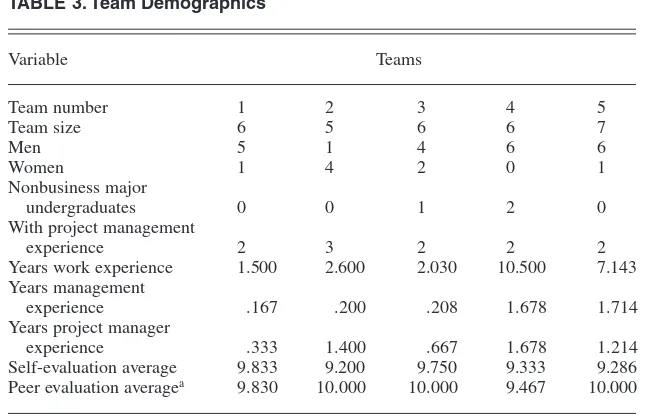
Table 2 contains regression statistics that revealed no significant correlation between the assessment rating as the dependent variable and work experi-ence, management experiexperi-ence, and pro-gram management experience (in years) as independent variables. I per-formed this calculation twice, using Likert-type assessments in one model and ipsitive assessments in the other. Table 3 lists the demographics of the 30 participants and the overall averages associated with each team’s nonipsitive peer ratings. Overall peer evaluation averages were high. Three of the five teams evaluated everyone as a perfect 10 with respect to contribution. The remaining two teams also posted signif-icantly high averages of 9.467 and 9.830. Self-assessments were similarly high, with an overall average of 9.48. When comparing the peer assessment averages to the self-evaluations, it pro-duced a statistically insignificant corre-lation coefficient, r = .146. Hence, although both peer assessment averages and self-assessment ratings were rela-tively high, there does not seem to be
any significant correlation between the two. However, one should use caution in interpreting this result. From a pure-ly statistical perspective, one could argue that in general, an individual’s self-assessment does not correspond with peers’ evaluations of that individ-ual. However, all of the ratings were relatively high, and this lack of agree-ment may actually reflect a lack of vari-ation (from a statistical perspective) as opposed to substantive disagreement between peers and individual ratings.
Comparing Ipsitive to Nonipsitive Instrument Results
A comparison of the ipsitive with the nonipsitive peer assessment averages produced a statistically insignificant correlation coefficient,r= .338. That is, it seemed as if the relatively high peer assessment averages from the nonipsi-tive ratings were not correlated with the rank-ordered ratings produced by the ipsitive peer evaluation averages. There are several possibilities for these high ratings from the nonipsitive survey. On the one hand, it is feasible that each team member felt that every person on the team made a substantive contribu-tion to their project. On the other hand, it is possible that because these peer evaluations were associated with each student’s grade, the students may have felt pressured to inflate their peers’ rat-ings. That is, students may have wanted
to abdicate their responsibility to assess their peers. One should recall that this methodology (nonipsitive) allows stu-dents to inflate other stustu-dents’ ratings without hurting their individual evalua-tions. One should note, however, that although students knew they would be required to evaluate their peers at the completion of the project, they were not informed about the particular methodol-ogy that was to be used until the moment the surveys were administered. Hence, it is unclear if there was any sort of pre-evaluation collusion between stu-dents on how to evaluate each other. One should also note that students were not allowed to collaborate during the actual peer evaluation process of filling out the surveys.
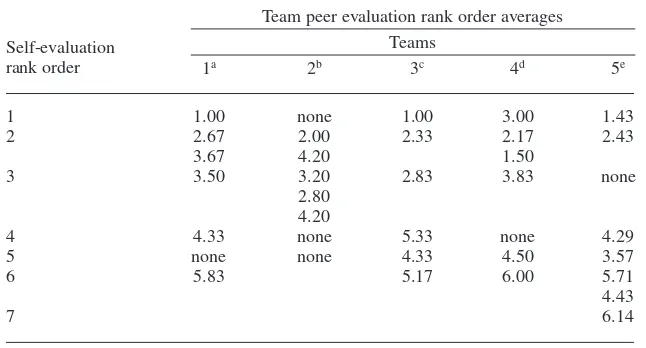
If students did not inflate their rat-ings, and they felt every person made a substantive contribution to the project, then it seems to follow that it should have been difficult for team members likewise to discern significant differ-ences in these contribution levels. (This same issue would be raised if all team members ranked each other low.) As stated previously, when students are forced to rank order their peers without discernible differences in contribution levels, it should produce a random rat-ing for each team member. However, the results of the ipsitive instrument in Table 4 show strong agreement on who made the most significant contributions to the project. Indeed, when evaluating the correlation of self-assessment evalu-ations and peer-assessment averages, it produced a statistically significant cor-relation coefficient,r= .881 (p< .001).
DISCUSSION
One of the most striking results from this study is the agreement between self-assessments and peer assessment averages. When the high-stakes element is removed from the analysis and all assessments are done in secret, individ-uals seem to be in substantive agree-ment with their peers with respect to how their (the individuals) relative con-tributions are perceived. Of course, this honesty in self-reporting is mediated by the fact that individuals realized these ratings would have no impact on their grade. In other words, this ipsitive para-TABLE 3. Team Demographics
Variable Teams
undergraduates 0 0 1 2 0
With project management
experience 2 3 2 2 2
Years work experience 1.500 2.600 2.030 10.500 7.143 Years management
experience .167 .200 .208 1.678 1.714 Years project manager
experience .333 1.400 .667 1.678 1.214 Self-evaluation average 9.833 9.200 9.750 9.333 9.286 Peer evaluation averagea 9.830 10.000 10.000 9.467 10.000
Note. For averages, 1 = low; 10 = high. aDoes not include self-evaluations.
dox points out the irony that individuals may largely agree with their peers in a rank-ordering system and also candidly report this agreement about their per-sonal contributions when these evalua-tions will have no impact on them (the individuals) or anyone else (their peers). Hence, these particular ratings are accu-rate, but impotent, nonetheless. Not-withstanding this fact, these results tend to add credence to the notion that a secret peer assessment that does not include a self-evaluation tends to remove inflationary tendencies and, indeed, may be an accurate performance appraisal method (Freeman & McKen-zie, 2002; Lejk & Wyvill, 2001; Liu, Lin, & Yuan, 2002).
Of course, the previous observation leads to the question: How does one know if nonipsitive results are inflated? One should recall that, if the individual members were really as outstanding as their (nonipsitive) ratings seem, then the ipsitive results should have been assigned in a random way. However, although three of the five teams had per-fect scores (and the other two nearly so), these teams had no difficulty construct-ing a rank orderconstruct-ing of individual contri-butions. Hence, it seems likely that they significantly inflated the ratings.
The ramifications of the results are sig-nificant for practitioners and scholars
alike. Consistent with previous research (e.g., Johnson & Smith, 1997), this study suggests that individuals may inflate rat-ings (when they can) when immersed in a high-stakes environment. However, what may be more important is that in an ipsi-tive scheme, when individuals are con-fronted with a secret assessment scheme in which their self-assessment has no practical impact, these individuals large-ly agree with their peers’ evaluations (i.e., no under- or overinflation of self-evalua-tions). What this could mean is that peers may have a particularly keen insight into how much a person contributed to a pro-ject, and, more important, most individu-als largely agree with their peers’ assess-ments. If such agreement exists, it could mean that individuals might be rather accepting of these peer ratings, which could boost the use of these particular methodologies in group assessment strategies.
These results have generated other important observations and questions. Again, where true variation exists in how to rank order each person’s contri-bution to a group activity, secret peer assessment without a self-evaluation may accurately reflect members’ percep-tions about contribution levels. Howev-er, it seems that all of the groups in the present study probably inflated their rat-ings in the nonipsitive survey. Future
research may want to still address how an ipsitive rating methodology would fare when assessing team members who are all extremely productive (or unpro-ductive). Another subject not directly broached in the present study is the asso-ciation, if any, between peer perceptions and project success. The results of previ-ous studies (e.g., Pope, 2005) suggest that there is such a connection. Future research might try to analyze how strong that link is (i.e., between peer assess-ments and project success). Given the growing popularity of group projects in both the private sector and academic institutions, future studies that attempt to address these issues will likely be of paramount importance.
REFERENCES
Boud, D., Cohen, R., & Sampson, J. (1999). Peer learning and assessment. Assessment & Evalu-ation in Higher EducEvalu-ation, 24(4), 413–426. Bourner, J., Hughes, M., & Bourner, T. (2001).
First-year undergraduate experiences of group project work. Assessment and Evaluation in Higher Education, 26(1), 19–39.
Chen, Y., & Lou, H. (2004). Students’ perceptions of peer evaluation: An expectancy perspective.
Journal of Education for Business, 79(5), 275–282.
Freeman, M., & McKenzie, J. (2002). SPARK, a confidential Web–based template for self and peer assessment of student teamwork: Benefits of evaluating across different subjects. British Journal of Educational Technology, 33(5), 551–569.
Goldfinch, J. (1994). Further developments in peer assessments of group projects.Assessment and Evaluation in Higher Education, 19(1), 29–35. Greenwald, A. G., & Breckler, S. J. (1985). To
whom is the self presented? In B. Schlenker (Ed.),The self and social self(pp. 126–145). New York: McGraw-Hill.
Harkins, S. G., White, P. H., & Utman, C. H. (2000). The role of internal and external sources of evaluation in monitoring task perfor-mance. Personality and Social Psychology Bul-letin, 26(1), 100–117.
Ilgen, D. R., & Feldman, J. M. (1983). Perfor-mance appraisal: A process focus. In L. Cum-mings & B. Straw (Eds.),Research in organi-zational behavior: Vol. 5 (pp. 141–197). Greenwich, CT: JAI Press.
Johnson, C. B., & Smith, F. I. (1997). Assessment of a complex peer evaluation instrument for team learning and group processes. Accounting Education, 2(1), 21–40.
Landy, F. J., & Farr, J. L. (1983). The measure-ment of work performance: Methods, theory, and applications. New York: Academic Press. Lei, C., & McBride-Chang, C. (1997). Self- and
peer-ratings of female and male roles and
attributes. Journal of Social Psychology,
137(4), 527–529.
Lejk, M., & Wyvill, M. (2001). The effect of the inclusion of self-assessment with peer assess-ment of contributions to a group project: A quantitative study of secret and agreed
assess-TABLE 4. Ipsitive Contribution Levels: Self-Evaluation Versus Team Peer Evaluation Rank Order
Team peer evaluation rank order averages Teams
4 4.33 none 5.33 none 4.29
5 none none 4.33 4.50 3.57
6 5.83 5.17 6.00 5.71
4.43
7 6.14
Note. More than one figure in a cell indicates a self-evaluation tie between two or more individu-als on one team. “None” indicates that no individuindividu-als on a given team ranked themselves in that position.
an= 6. bn= 5. cn= 6. dn= 6. en= 7.
Self-evaluation rank order
ments. Assessment & Evaluation in Higher Education, 26(6), 551–561.
Li, L. (2001). Some refinements on peer assess-ment of group projects. Assessment and Evalu-ation in Higher EducEvalu-ation, 26(1), 5–18. Liu, E. Z., Lin, S. J., & Yuan, S. M. (2002).
Alter-natives to instructor assessment: A case study of comparing self and peer assessment with instructor assessment under a networked inno-vative assessment procedures. International Journal of Instructional Media, 29(4), 395–404. Longenecker, C. O., Sims, H. P., & Gioia, D. A. (1987). Behind the mask: The politics of
employee appraisal. Academy of Management
Executive, 1(3), 183–193.
Murphy, K. R., & Cleveland, J. N. (1991). Perfor-mance appraisal: An organizational perspec-tive. Boston: Allyn & Bacon.
Norcini, J. J. (2003). Peer assessment of compe-tence. Medical Education, 37(6), 539–543. Parker, R. J. (2001). The effects of evaluative
con-text on performance: The roles of self- and social-evaluations. Social Behavior & Personal-ity: An International Journal, 29(8), 807–822. Pope, N. K. (2005). The impact of stress in
self-and peer assessment. Assessment & Evaluation in Higher Education, 30(1), 51–63.
Reagan, P., & Rohrbaugh, J. (1990). Group decision process effectiveness: A competing values
approach. Group and Organization Studies,
15(1), 20–43.
Saavedra, R., & Kwun, S. K. (1993). Peer evalua-tion in self-managing work groups. Journal of Applied Psychology, 78(3), 450–462. Stubblebine, P. C. (2001). Perception and
accep-tance of evaluations by supervisors and peers.
Current Psychology, 20(1), 85–94.
Szymanski, K., & Harkins, S. G. (1987). Social loafing and self-evaluation with a social stan-dard. Journal of Personality and Social Psy-chology, 53(5), 891–897.
White, P. H., Kjelgaard, M. M., & Harkins, S. G. (1995). Testing the contribution of self-evalua-tion to goal-setting effects. Journal of Personal-ity and Social Psychology, 69(1), 69–79.