Full Terms & Conditions of access and use can be found at
http://www.tandfonline.com/action/journalInformation?journalCode=cbie20
Download by: [Universitas Maritim Raja Ali Haji] Date: 18 January 2016, At: 20:06
Bulletin of Indonesian Economic Studies
ISSN: 0007-4918 (Print) 1472-7234 (Online) Journal homepage: http://www.tandfonline.com/loi/cbie20
SURVEY OF RECENT DEVELOPMENTS
Sadayuki Takii & Eric D. Ramstetter
To cite this article: Sadayuki Takii & Eric D. Ramstetter (2007) SURVEY OF RECENT DEVELOPMENTS, Bulletin of Indonesian Economic Studies, 43:3, 295-322, DOI: 10.1080/00074910701727571
To link to this article: http://dx.doi.org/10.1080/00074910701727571
Published online: 18 Apr 2008.
Submit your article to this journal
Article views: 115
View related articles
ISSN 0007-4918 print/ISSN 1472-7234 online/07/030295-28 © 2007 Indonesia Project ANU DOI: 10.1080/00074910701727571
SURVEY OF RECENT DEVELOPMENTS
Sadayuki Takii and Eric D. Ramstetter
International Centre for the Study of East Asian Development, Kitakyushu
SUMMARY
Notwithstanding improvements in Indonesia’s political and institutional infra-structure, growth remains slower than in pre-crisis years, and there is much dis-cussion about reinvigorating the economy. To this end, the government introduced its fourth major policy package in June 2007, risking scepticism about its under-lying resolve to implement reforms that confl ict with the interests of infl uential
bureaucrats. The abandonment of previous attempts at labour market reform was perhaps the most conspicuous element of the new package.
Economic growth continued to accelerate, reaching 6.3% in the second quarter. Most fi rst-half growth was driven by net exports and investment, even though
construction activity slowed noticeably in this period. On the production side, output of non-tradables continues to outstrip that of tradables. Consumer price infl ation rose in the September quarter to the top of the central bank’s target
range, and seems likely to increase further. The stock market boom continued in the year to September, notwithstanding a brief correction in August. Bank Indo-nesia’s exchange rate and monetary policies have created an arbitrage opportu-nity that appears to be contributing signifi cantly to private capital infl ow. The
2008 budget maintains a modest defi cit, but contains seemingly unrealistic plans
for large increases in certain categories of spending and in tax revenue. Moreover, the projected world oil price is so low as to call into question the transparency of
fi scal policy.
There is concern that Indonesia’s recent growth has depended too heavily on commodity prices, but real export growth was in fact substantial in the fi rst half
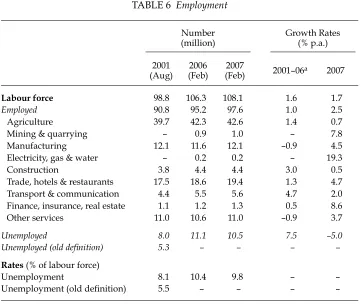
of 2007. Moreover, although Indonesia’s share of non-fuel exports as a whole in the world market has been eroded somewhat in recent years, this masks large variations in shares across major markets and product categories. Its market share rose conspicuously for key primary products in some markets, while it has been losing market share in a number of labour-intensive manufactures, adding weight to concern about the impact of labour market policies on employment growth. Employment in fact grew strongly in the year to February 2007, pushing unem-ployment down a little, and contributing to a reduction in poverty incidence. However, employment growth has been conspicuously slow in manufactur-ing—particularly in labour-intensive industries. Meanwhile, newly announced closures of certain industries to particular kinds of investors have done little to improve the business environment.
cbieDec07b.indb 295
cbieDec07b.indb 295 24/10/07 3:59:11 PM24/10/07 3:59:11 PM
POLITICAL DEVELOPMENTS
In recent months it has been common for Southeast Asian scholars and media commentators to look back over the decade since the Asian economic crisis began in Thailand and spread to Indonesia, Malaysia, South Korea and other countries. Although Indonesia’s economic growth rate continued to recover in the year to June 2007, it was still slower than in the several years before the crisis. Much of the related discussion concerns how to accelerate growth further. Some observers suggest that slower growth during the post-crisis period is related to less effective economic policy making (McLeod 2005), and indeed the government’s capacity to dictate policy has been heavily constrained by a more powerful national parlia-ment (DPR) and more powerful local governparlia-ments (Perdana and Friawan 2007). Private interest groups have also become more diverse and vocal, often engaging in rent-seeking activity at the local as well as the national level.
In addition, President Susilo Bambang Yudhoyono (SBY) has a relatively weak power base and, from the outset, had to forge a multi-party coalition of diverse interests to stay in power. His government has introduced four major policy packages over the last two years in the hope of boosting growth, and perhaps also of galvanising political support for his policy agenda. The newest package appeared in June 2007 (box 1), but the proliferation of supposedly major policy packages—which have so far brought little substantive change to the business environment—has led to a growing belief that the government and its bureauc-racy are much better at talking about reform than at implementing it.
Opposition from the DPR and interest groups has made the government hesi-tant to pursue imporhesi-tant policy reforms, and some feel the president has failed to exploit fully the strong support he received from voters in 2004. A notable example of this hesitancy is the omission from the new policy package of fur-ther measures to increase competition in Indonesia’s formal labour market.1 Most
economists believe such competition is too constrained by high minimum wages (which price relatively low-productivity workers out of the market) and by oner-ous regulations on severance pay and other working conditions (which protect existing employees from new competitors).
Although the dispersion of power sometimes frustrates efforts to improve eco-nomic policies, and failure to make policy improvements probably contributes to economic hardship for many households and fi rms, Indonesia continues to
con-solidate its important post-Soeharto political and institutional achievements. In the decade since the crisis, there have been four changes of national government and two national elections, as well as several hundred local elections. In almost all cases, this has brought about non-violent changes of leadership. The peace agreement in Aceh appears to be holding, while sectarian tensions in Ambon and other parts of Maluku have remained dormant in recent months. The police have recently thwarted further terrorist attacks by Jemaah Islamiyah (JI) and arrested two of its top leaders (JP, 16/6/2007); two years have passed since the last major attack. Success against JI has resulted from policies emphasising good intelligence and international cooperation.
1 See Manning and Roesad (2007) for details of labour market reforms proposed in 2006, and Narjoko and Jotzo (2007) for a summary of the political gridlock that caused their abandonment, at least for the present.
cbieDec07b.indb 296
cbieDec07b.indb 296 24/10/07 3:59:11 PM24/10/07 3:59:11 PM
BOX 1 THENEWECONOMICPOLICYPACKAGE
The government launched yet another economic policy package (Presidential Instruction 6/2007) in June 2007, with the aim of accelerating policy improve-ments in four areas: the investment climate; the fi nancial sector; infrastructure;
and micro, small and medium enterprises (MSMEs). This package integrates and continues the three economic packages previously issued by the SBY administration, but measures to promote the MSME sector are included as a major fi eld for the fi rst time. The package aims to ‘empower’ MSMEs by
providing better access to fi nancial resources; promoting development of
entrepreneurship and human resources; improving market access; and imple-menting other regulatory reforms that will help such fi rms.
The urge to encourage MSMEs is understandable, given that they collec-tively generate substantial employment and that employment growth has generally been slow. However, it is both counter-productive and unneces-sary to favour particular kinds of fi rms over others. MSMEs are naturally
competitive in many sectors where economies of scale are unimportant; in such sectors, they need no special assistance. On the other hand, to restrict the participation of larger fi rms in sectors where economies of scale are
signifi cant—which is a notable effect of the new negative list of activities
closed to certain categories of investors, discussed below—is to encour-age ineffi ciency. Policies aimed at improving the entrepreneurial skills and
access to fi nance of small fi rms have long had a degree of political appeal in
Indonesia that far exceeds their effectiveness.
A notable difference between this and previous packages is clearer
speci-fi cation of expected outcomes, and more transparent ways of evaluating
them. The three earlier packages had common problems with implementa-tion (Basri and Patunru 2006), and the new approach is intended to address this and related concerns: the tables summarising the policies, programs and actions contained in the package include an additional column specifying the expected outcome for each action (Government of Indonesia 2007). Actual outcomes will then be examined by an independent external team that is to monitor progress on package goals for the Coordinating Ministry for Eco-nomic Affairs; the new format will allow this team to perform objective evalu-ations by surveying businesses on specifi c points.
This change of approach partly signals the government’s recognition that effective monitoring of policy implementation is important for the pack-age’s credibility. It also probably refl ects the growing view that the
govern-ment must do better at persuading the public and the legislature to support such packages. However, despite the new procedures for evaluating out-comes, there is no indication that the government will face consequences other than loss of face should it fail to meet its stated objectives. This creates scepticism about whether the new package will have any more impact than its predecessors. The underlying problem is the lack of strong incentives for the bureaucracy to implement policy reforms that are often in confl ict
with its own interests. It is not clear that this new approach does anything to change those incentives.
cbieDec07b.indb 297
cbieDec07b.indb 297 24/10/07 3:59:11 PM24/10/07 3:59:11 PM
There is still much debate on the role of religion (McGibbon 2006; Salim 2007), illustrated by recent exchanges between fringe groups arguing for establishment of a caliphate based on Islamic (syariah) law and mainstream observers who con-tend that Indonesia should continue to emphasise pluralism—acceptance of, and mutual respect for, its numerous religions and cultures (JP, 21/8/2007). Notwith-standing this debate, the more moderate groups that celebrate Indonesia’s diver-sity have continued to prevail in the last decade, and the government has begun to adopt the profi le of a leading supporter of democratic values and human rights in
Southeast Asia. Its support was critical to the July 2007 agreement to establish an ASEAN Charter (expected to be adopted formally in November), which purports to transform ASEAN into a rules-based organisation promoting democracy, human rights, regional security, regional economic cooperation and related principles.
MACROECONOMIC TRENDS AND POLICIES Economic growth
The year-on-year quarterly economic growth rate continued the acceleration evi-dent since the third quarter (Q3) of 2006, reaching 6.3% in Q2 of 2007 (table 1)—the highest rate since Q4 of 2004. In its draft budget for 2008 the government assumes that growth will continue to accelerate in the second half to reach 6.3% for 2007 as a whole, and then increase further to 6.8% in 2008 (Ministry of Finance 2007b). However, both of these forecasts, especially the optimistic 2008 forecast, are higher than those by private research organisations and the central bank (Bank Indonesia, BI).2 Although the growth rate has been increasing, it is still below pre-crisis rates
(7.5–8.2% in 1994–96), and the government is often criticised for not being able to achieve more on this front. Accelerating economic growth remains a high priority primarily because it is the most effective way of raising living standards for the large number of Indonesians living on very low incomes.
Private consumption is by far the largest expenditure component of real GDP, accounting for just under three-fi fths of the total in recent years. Although this
component’s growth rebounded from 3.0% or less in the fi rst three quarters of 2006
to 4.7% in the fi rst two quarters of 2007, it has lagged behind that of other
expendi-ture categories, and its contribution to overall growth has therefore been relatively small. A more detailed analysis than that shown in table 1 indicates that increased growth in expenditure on food was particularly conspicuous, rising from 1.6–1.8% in the fi rst two quarters of 2006 to 3.8–3.9% in the same period in 2007, while growth
of non-food expenditures also rose, from 4.1–4.2% to 5.4%. Meanwhile, the growth of government consumption was quite slow in the last half of 2006, although it accelerated in the fi rst half of 2007, reaching 3.8% in the second quarter.
In contrast, fi xed investment, the second largest component of domestic
demand, has grown more rapidly than GDP since Q4 of 2006, though it deceler-ated from 8.2% in that quarter to 6.9% in Q2 of 2007. Over three-quarters of invest-ment is in construction activity, and this component has been growing far more rapidly than GDP over the last six quarters—though it, too, slowed noticeably in
2 In August 2007, the average forecasts by 14 private think-tanks summarised in Consen-sus Economics (2007) were 6.1% for 2007 and only 6.2% for 2008. BI’s forecasts are reported as 6.2% for 2007 and 6.5% for 2008.
cbieDec07b.indb 298
cbieDec07b.indb 298 24/10/07 3:59:12 PM24/10/07 3:59:12 PM
the fi rst half of 2007. Other investment (mainly in machinery and transport
equip-ment) has been much less buoyant, contracting sharply in the fi rst three quarters
of 2006 and growing relatively slowly thereafter, before recovering to a moderate rate of 4.0% in Q2 of 2007. These observations amplify concerns that the share of investment in GDP, particularly investment in machinery and transport equip-ment, remains too low to support high growth rates such as those achieved before the crisis.3 On the other hand, the slowdown in construction activity in the fi rst
3 For example, the share of fi xed investment in real GDP was 25–27% in 1994–96. Construc-tion’s large share of investment in Indonesia is in marked contrast with some other Asian economies: recent shares in Thailand were only a little over one-third (CEIC Asia Database).
TABLE 1 Components of GDP Growth (2000 prices; % p.a. year on year)
Mar-06 Jun-06 Sep-06 Dec-06 Mar-07 Jun-07
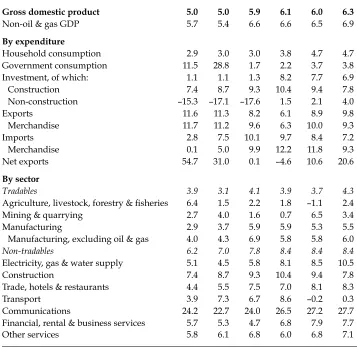
Gross domestic product 5.0 5.0 5.9 6.1 6.0 6.3
Non-oil & gas GDP 5.7 5.4 6.6 6.6 6.5 6.9
By expenditure
Household consumption 2.9 3.0 3.0 3.8 4.7 4.7
Government consumption 11.5 28.8 1.7 2.2 3.7 3.8
Investment, of which: 1.1 1.1 1.3 8.2 7.7 6.9
Construction 7.4 8.7 9.3 10.4 9.4 7.8
Non-construction –15.3 –17.1 –17.6 1.5 2.1 4.0
Exports 11.6 11.3 8.2 6.1 8.9 9.8
Merchandise 11.7 11.2 9.6 6.3 10.0 9.3
Imports 2.8 7.5 10.1 9.7 8.4 7.2
Merchandise 0.1 5.0 9.9 12.2 11.8 9.3
Net exports 54.7 31.0 0.1 –4.6 10.6 20.6
By sector
Tradables 3.9 3.1 4.1 3.9 3.7 4.3
Agriculture, livestock, forestry & fi sheries 6.4 1.5 2.2 1.8 –1.1 2.4
Mining & quarrying 2.7 4.0 1.6 0.7 6.5 3.4
Manufacturing 2.9 3.7 5.9 5.9 5.3 5.5
Manufacturing, excluding oil & gas 4.0 4.3 6.9 5.8 5.8 6.0
Non-tradables 6.2 7.0 7.8 8.4 8.4 8.4
Electricity, gas & water supply 5.1 4.5 5.8 8.1 8.5 10.5
Construction 7.4 8.7 9.3 10.4 9.4 7.8
Trade, hotels & restaurants 4.4 5.5 7.5 7.0 8.1 8.3
Transport 3.9 7.3 6.7 8.6 –0.2 0.3
Communications 24.2 22.7 24.0 26.5 27.2 27.7
Financial, rental & business services 5.7 5.3 4.7 6.8 7.9 7.7
Other services 5.8 6.1 6.8 6.0 6.8 7.1
Source: CEIC Asia Database.
cbieDec07b.indb 299
cbieDec07b.indb 299 24/10/07 3:59:12 PM24/10/07 3:59:12 PM
half of 2007 has helped alleviate concern that an economy-wide speculative bub-ble may be developing (see below).
After contracting in the last half of 2006, net exports resumed a robust expan-sion in the fi rst half of 2007 (table 1). The 2006 contraction was not the result
of low export growth, but of strong growth in imports, which continued into the fi rst half of 2007. However, there is a substantial discrepancy between the
national accounts and wholesale price indices. The former suggest relatively low export price infl ation, with the merchandise export defl ator rising by only
0.8% in 2006 and by 2.8% in the fi rst half of 2007 compared with the fi rst half of
2006. The latter indicate more rapid increases in export prices in these periods (5.8% and 5.0%, respectively). Correspondingly, the national accounts estimates show that real export growth (9.6% in both 2006 and the fi rst half of 2007) was
more rapid than is suggested by alternative estimates constructed from mer-chandise trade data, exchange rates and export price indices (5.0% and 8.3%, respectively).4 Although these discrepancies are rather large for 2006, both
esti-mates suggest that export quantities grew much faster than export prices in the fi rst half of 2007, and almost as fast (wholesale price estimates) or faster
(national accounts estimates) in 2006. Thus, despite concern that recent export growth has resulted primarily from trends toward higher commodity prices, the data indicate that quantity increases have also been robust.
On the production side, growth of the tradables sectors (comprising, roughly speaking, agriculture, livestock, forestry and fi sheries; mining and quarrying; and
manufacturing) has been consistently much slower than that of non-tradables (all other sectors) during the six quarters shown in table 1. Growth rates for both groups of sectors have increased a little over this period, but non-tradables have grown roughly twice as fast throughout. Agriculture registered negative growth in the fi rst quarter of 2007 owing to unfavourable climatic conditions, while the
brief burst of relatively high growth in mining and quarrying in Q1 dissipated in Q2. Manufacturing growth has fallen back below the rate of GDP growth as a whole. More detailed analysis of the national accounts data shows that in the fi rst
half of 2007 the fastest growing manufacturing industries were paper and print-ing (11%); food, beverages and tobacco (8.2%); machinery (7.2%); and chemicals (7.0%). Production of cars also started recovering in March 2007, and total produc-tion in the fi rst seven months of the year was 53% higher than in the same period
of 2006—yet still one-third below the level recorded in the fi rst seven months
of 2005 (Gaikindo;5 CEIC Asia Database). Within the non-tradables sectors,
com-munications continued to stand out, with the already very high rate of growth increasing even further over the last three quarters to reach almost 28% p.a. By contrast, growth in the transport sector fell abruptly from healthy levels to around zero in the fi rst half of 2007.
4 The alternative estimate is the growth rate of real exports, calculated as the dollar value of merchandise exports converted into rupiah at period average exchange rates, and de-fl ated by the wholesale price index for exports.
5 Gaikindo (Association of Indonesian Automotive Industries), <http://www.gaikindo. org/>, data downloaded from ‘Statistics’, August 2007.
cbieDec07b.indb 300
cbieDec07b.indb 300 24/10/07 3:59:13 PM24/10/07 3:59:13 PM
Trends in prices and money supply
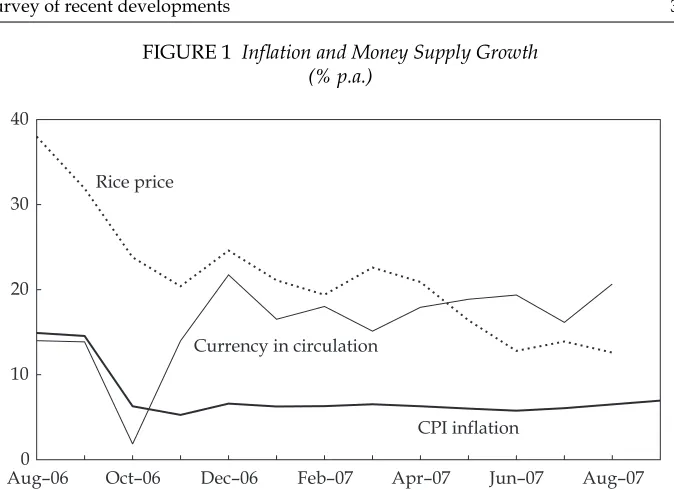
The downward trend in consumer price infl ation established from April to
June 2007, when the rate fell from 6.3% to 5.8% p.a., was subsequently reversed (fi gure 1). By September the rate had risen modestly, to 7.0%, which is at the top
of BI’s infl ation target range for 2007 (5–7%), and above the 6.5% rate assumed
in the revised budget for 2007. Shortages of rice and other foodstuffs (often weather-related: JP, 18/9/2007) have kept infl ation high in this large category,
which accounts for about 25% of the basket of goods and services used to calculate the consumer price index (CPI). The slowing of rice price infl ation from
the extraordinarily high levels recorded in 2006 is due partly to increases in rice imports (JP, 16/6/2007) into this highly regulated market. Price rises for cooking oil and related products have resulted from buoyant international demand for crude palm oil. In an effort to insulate poor households from the effects of rising world prices, the government announced its intention to scrap the 10% value added tax (VAT) for this commodity, having already imposed a tax on palm oil exports in August (Reuters, 18/9/2007).6
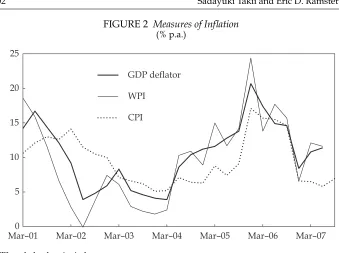
Two alternative measures of infl ation, the wholesale price index (WPI) and the
implicit GDP defl ator, are shown for a longer time period in fi gure 2, and
com-pared with CPI infl ation. At least for the period under consideration there is a
close correlation between infl ation rates as indicated by the GDP defl ator and the
WPI. The CPI is less closely correlated with both of these measures, but appears
6 Tinkering with export taxes and the VAT in this piecemeal manner is distortionary. Re-moving the VAT seems as likely to benefi t producers as consumers, and the announcement appears to be motivated by populist sentiment.
FIGURE 1 Infl ation and Money Supply Growth (% p.a.)
Aug–060 Oct–06 Dec–06 Feb–07 Apr–07 Jun–07 Aug–07 10
20 30 40
CPI inflation Currency in circulation
Rice price
Sources: CEIC Asia Database; Bank Indonesia, Laporan Mingguan [Weekly Report], various issues.
cbieDec07b.indb 301
cbieDec07b.indb 301 24/10/07 3:59:13 PM24/10/07 3:59:13 PM
to follow them with a (somewhat variable) lag.7 Of particular interest is that infl
a-tion as indicated by both the GDP defl ator and the WPI had jumped to
double-digit levels by the middle of 2007; this suggests that CPI infl ation is also likely to
continue accelerating in the near future. The GDP defl ator and WPI data
under-score the fact that infl ation has been relatively high in agriculture, which is linked
to the fairly rapid rise of food prices observed in the CPI data .
Another reason why CPI infl ation seems likely to increase before long is that
the money supply—specifi cally, currency in circulation, the major component
of base money—has been growing at an average rate of almost 18% p.a. since November 2006 (fi gure 1). This is signifi cantly higher than is compatible in the
long run with infl ation within the target range of 5–7% combined with real
growth of about 6%. The loose stance of monetary policy is likely to have con-tributed to the signifi cant depreciation of the rupiah from late May through the
end of August, during which period the rupiah’s dollar value declined by almost 8%. Infl ationary pressure was expected to rise in September and beyond, mainly
because of increased demand for food during and after Ramadhan, which started in mid-September. Given these perceptions of increasing infl ationary pressures,
BI decided to slow the pace at which it had been lowering its benchmark interest rate, the BI rate, and kept it at 8.25% in August and September; despite this, the annual growth rate of base money increased to over 20% in August (fi gure 1).
7 The differences arise, of course, because of the different coverage of goods and services contained in these three indices. For example, the WPI gives higher weights to the prices of raw materials and intermediate goods, and none at all to services, while the GDP defl ator takes into account capital (as distinct from consumer) goods, as well as goods and services sold to foreigners.
FIGURE 2 Measures of Infl ation (% p.a.)
Mar–010 Mar–02 Mar–03 Mar–04 Mar–05 Mar–06 Mar–07 5
10 15 20 25
GDP deflator WPI
CPI
WPI = wholesale price index.
Source: CEIC Asia Database.
cbieDec07b.indb 302
cbieDec07b.indb 302 24/10/07 3:59:13 PM24/10/07 3:59:13 PM
Financial markets
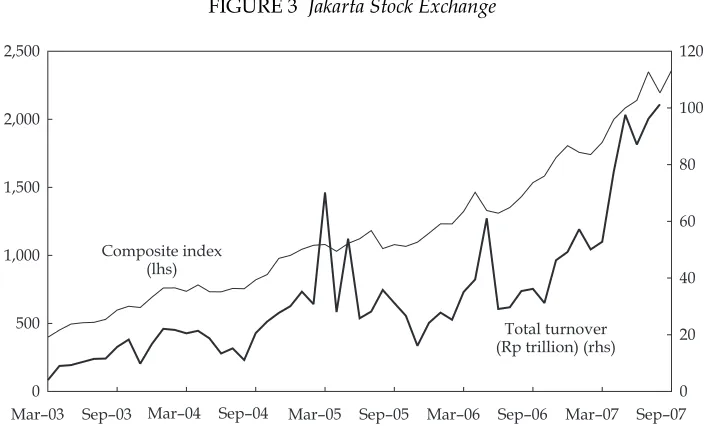
From early 2003 the Jakarta Stock Exchange (JSX) experienced a very strong bull run, which continued well into the fi rst three quarters of 2007 (fi gure 3). The
JSX composite index increased by no less than 54% in the 12 months through September, despite a sharp 7% decline during August, after turmoil in the US and European markets related to emerging problems with sub-prime mortgage lending in the US. Mining and property were among the most buoyant sec-tors during the 12 months to September, gaining 166% and 190%, respectively.8
The average value of monthly turnover doubled from less than Rp 43 trillion in April 2006 through March 2007 to Rp 96 trillion between May and August 2007. Foreign portfolio investment has contributed very strongly to recent stock price increases: net purchases by foreign investors rose to Rp 22.4 trillion (around $2.5 billion) in the six months through August, a 220% increase over the six months through February.
The bull run partly refl ects perceived improvements in Indonesia’s economic
prospects, but such a rapid increase in stock prices inevitably creates some concern that an asset bubble may be developing—and that a signifi cant downward
correc-tion may follow—though it is very diffi cult to know when or if that will happen.
Uncertainty associated with the sub-prime loans problem in the US increases this possibility, because it may encourage foreign fund managers to withdraw funds if they need to boost their liquidity, or if they feel that Indonesian fi nancial
institu-tions are themselves exposed to excessive risk. Large fl uctuations in stock prices do
not necessarily cause concern, but the 1997 crisis illustrated how a large sell-off of
8 Bapepam-LK (Capital Market and Financial Institutions Supervisory Agency), <http:// www.bapepam.go.id/web/bej/index.asp>, accessed September 2007.
FIGURE 3 Jakarta Stock Exchange
Mar–03 Sep–03 Mar–04 Sep–04 Mar–05 Sep–05 Mar–06 Sep–06 Mar–07 Sep–07 0
500 1,000 1,500 2,000 2,500
0 20 40 60 80 100 120
Total turnover (Rp trillion) (rhs) Composite index
(lhs)
Source: CEIC Asia Database.
cbieDec07b.indb 303
cbieDec07b.indb 303 24/10/07 3:59:14 PM24/10/07 3:59:14 PM
assets can have severe consequences in economies such as Indonesia’s. Balance of payments indicators discussed below suggest Indonesia is now more vulnerable to such a withdrawal than in recent years. On the other hand, even if there is a bubble in the stock market, there is little indication of a similarly worrisome bubble in the real sector, because growth is moderate and the ratio of fi xed investment to GDP
is not large. Spending on construction has been quite high, but the growth rate declined to a reasonable level in the fi rst half of 2007, as noted above.
Reactions of monetary authorities can have a crucial impact when there are large falls in asset prices. Recent moves by certain central banks to increase sys-tem liquidity—notably the US Federal Reserve and the Bank of England—refl ect
the view that such actions can help insulate economies from the effects of price swings in fi nancial markets. On the other hand, many commentators worry about
the moral hazard effect of investors coming to believe that the authorities will step in to prevent losses even when investments have been imprudent. Such con-siderations may be academic, however, because the scope that BI has to fi ne-tune
liquidity conditions in response to nervousness in the capital market is limited, for at least two important reasons. First, if foreign portfolio investors are occupied with conditions in their home markets or other larger markets, rather than with the Indonesian market, BI may have little infl uence over their decisions.
Second, the possible benefi ts of increasing liquidity are constrained by relatively
high infl ation and associated fears of rupiah depreciation. There is also concern
about contributing to any bubble that may exist or be emerging. For all of these reasons, BI’s recent decision to slow the pace at which it had been lowering its intervention interest rate appears well grounded.
Since the fi nancial turmoil during and following the crisis of the late 1990s,
most East Asian developing economies have been trying to develop bond markets as an alternative means of deepening fi nancial markets and reducing
vulnerability to large swings in stock prices. However, Indonesia’s ratio of out-standing bonds to GDP was only 15% at the end of June 2007.9 Among the East
Asian countries listed, only Vietnam had a lower ratio (11%), and the ratio of the third lowest economy (the Philippines, at 36%) was much higher than that of Indonesia. Thus, Indonesia lags far behind many other East Asian economies in bond market development. Moreover, government bonds dominate the bond market in Indonesia, accounting for 85% of the outstanding total. The corpo-rate bond market is correspondingly small, though it started growing faster in the fi rst half of 2007. According to the Surabaya Stock Exchange, where many
bonds are listed, the total value of outstanding corporate bonds increased by 24% from Rp 62 trillion in December 2006 to Rp 81 trillion in July 2007.10 Most of
the companies issuing new bonds in 2007 were fi nance companies. Government
bond markets have also been attractive to foreign investors recently. The share of outstanding tradable bonds11 held by foreign banks and fi nancial institutions
9 Asian Development Bank (ADB), Asian Bonds Online, <http://asianbondsonline.adb. org/asiabondindicators/lcy_market_size.php#>, accessed September 2007.
10 Surabaya Stock Exchange, <http://www.bes.co.id/about/listing.asp>, accessed Sep-tember 2007.
11 On the distinction between tradable and non-tradable bonds, see McLeod (2000): 28–9.
cbieDec07b.indb 304
cbieDec07b.indb 304 24/10/07 3:59:14 PM24/10/07 3:59:14 PM
rose from 1.6% in 2003 to 13% in 2006, before a more rapid increase to 18% in June 2007 (BI 2007b).12
In some respects, conditions in the fi nancial markets in mid-2007 were similar
to those just before the 1990s economic and fi nancial crisis (McLeod 1997: 7). BI
has been an active buyer in the foreign exchange market, presumably acting on the belief that it needs to support exporters by preventing appreciation of the cur-rency—or even by causing it to depreciate.13 To this end, it purchased some $21
bil-lion worth of foreign exchange in the period September 2005 through August 2007, and there are frequent self-congratulatory reports from BI in the media about the latest increase in Indonesia’s international reserves. But such purchases have an expansionary monetary impact that needs to be sterilised if they are not to result in accelerating infl ation. Thus, during the same period, BI’s outstanding stock of
cer-tifi cates of deposit (SBIs) (valued at contemporaneous exchange rates) increased
by roughly the same amount. Continuation of these policies is bound to create a signifi cant problem for the central bank itself, because the interest earnings on its
international reserves are signifi cantly less than the interest it has to pay out on its
certifi cates. US government securities are yielding a little over 4% p.a., while the
interest rate on SBIs is over 8%. The cost to BI of the 4% negative spread on this additional $21 billion of reserves fi nanced by the issue of SBIs is of the order of
$840 million annually. In qualitatively identical circumstances in 1997, the central bank abruptly ceased issuing SBIs to fi nance its purchases of foreign exchange.
Before much longer, presumably, it will again come to the same conclusion: that its combined exchange rate and interest rate policies are creating an extraordinar-ily attractive international arbitrage opportunity for private sector investors at its own expense—hence the dramatic rise in stock prices, and the recent eagerness to invest in Indonesian bonds and central bank certifi cates. Allowing the rupiah to
appreciate somewhat would put an end to this, permitting a greater proportion of Indonesia’s productive resources to be reallocated to the production of goods and services to satisfy domestic demand rather than that of foreigners.
The budget and fi scal policy
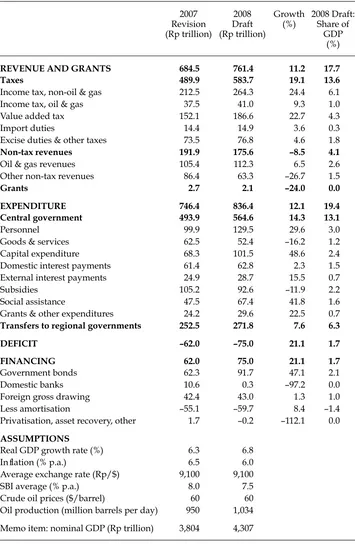
The government’s draft budget for 2008 was presented by the president as part of his independence day speech to the DPR in August (table 2). While the expected growth rate of 6.8% appears somewhat optimistic, infl ation of 6.0% is certainly
achievable. However, it may not be compatible with the assumed decline of the average SBI rate to 7.5% p.a.—and the hoped-for reduction in this rate to 8% p.a. in 2007 now seems most unlikely to be achieved. The assumption of an exchange rate of Rp 9,100/$ remains unchanged from the 2007 revised budget, while the government is counting on a signifi cant increase (around 9%) in oil production as
12 The average yield of all government bonds declined from 9.4% in December 2006 to 7.6% in July 2007, before increasing to 8.2% in August (Surabaya Stock Exchange, <http:// www.bes.co.id/about/listing.asp>, accessed September 2007). This will remove some of the pressure on the government budget, in which a large portion of revenue has been al-located to interest payments on government debt, 40% of which consists of bonds with variable interest rates (Lindblad and Thee 2007).
13 In contrast, the law on the central bank states clearly that its objective is simply to safe-guard the value of the currency.
cbieDec07b.indb 305
cbieDec07b.indb 305 24/10/07 3:59:15 PM24/10/07 3:59:15 PM
new oil fi elds come on stream. The defi cit remains small, and is expected to rise
slightly from 1.6% of GDP in the revised 2007 budget to 1.7% in 2008.
The draft budget retains an implausibly low oil price estimate of only $60 per barrel. By mid-October actual world oil prices were far higher—close to $90 per barrel. The only obvious reason why the budget would include such a low estimate is to hide the magnitude of fuel subsidies that will be paid out in 2008 if the price stays somewhere near recent levels (on the assumption that domestic prices will not be adjusted). Wasteful and inequitable subsidies to fuel consumption accounted for roughly half of budgeted subsidy expenditures in 2007 and 2008 (Ministry of Finance 2007b), but the $60 per barrel forecast allows the government to show both fuel and total subsidies as declining signifi cantly in
2008. This creates questions about the transparency of fi scal policy.
The maintenance of small budget defi cits demonstrates the government’s
determination to reduce the size of its debt relative to GDP over time. It is interest-ing, however, to look more closely at the details of the fi nancing of these defi cits,
since quite large changes in the composition of government debt are occurring. In particular, at a time when private sector investors are arbitraging the large dif-ference between domestic and foreign interest rates (albeit sometimes exposing themselves to the risk of depreciation), the government is moving in the opposite direction. In 2008, it plans to borrow some Rp 92 trillion in the domestic mar-ket (about $10 billion, net, after repayment of principal on existing debt), well in excess of the amount of the defi cit. This is a 47% increase over the amount in the
revised budget for 2007, and is to occur at the same time as the government is running down its stock of foreign debt (indicated by the excess of amortisation over foreign gross drawing) by Rp 17 trillion (about $1.8 billion). To some extent it has no choice about when to repay foreign borrowings undertaken in the past, but it always has the option of borrowing in world markets rather than domesti-cally to cover these cash outfl ows. Rolling over $1.8 billion of foreign debt at, say,
6%, rather than replacing it with the same quantity of domestic debt at, say, 9%, would result in a budgetary saving of some $54 million.14 Beyond this, the
issu-ing of additional bonds in overseas markets rather than domestically would add signifi cantly to this potential saving in interest costs.
Perhaps the most notable features of the draft 2008 budget are the projected large increases in capital spending (49%), social assistance (42%) and personnel outlays (30%), together with large increases in non-oil and gas income tax and VAT collections (24% and 23%, respectively), and a signifi cant decline in
gov-ernment expenditure on goods and services (16%). Increases in capital spend-ing are focused on economic infrastructure, especially transport infrastructure. It is often plausibly asserted that infrastructure defi ciencies have contributed to
a decline in Indonesia’s competitiveness (JP, 15/8/2007), and the government hopes that increased spending on infrastructure will ease related problems and create more employment, thereby helping to alleviate poverty. Increased social assistance includes expenditure on improving public health care, funding rural development programs, and providing subsidies to the poor for rice, cooking oil
14 These interest rates approximate the yields on 7-year Indonesian government bonds denominated in dollars and rupiah, respectively, at the end of September 2007 (ADB, Asian Bonds Online, <http://asianbondsonline.adb.org/indonesia/indonesia.php>).
cbieDec07b.indb 306
cbieDec07b.indb 306 24/10/07 3:59:15 PM24/10/07 3:59:15 PM
TABLE 2 Revised Budget 2007 and Draft Budget 2008
2007 Revision (Rp trillion)
2008 Draft (Rp trillion)
Growth (%)
2008 Draft: Share of
GDP (%)
REVENUE AND GRANTS 684.5 761.4 11.2 17.7
Taxes 489.9 583.7 19.1 13.6
Income tax, non-oil & gas 212.5 264.3 24.4 6.1
Income tax, oil & gas 37.5 41.0 9.3 1.0
Value added tax 152.1 186.6 22.7 4.3
Import duties 14.4 14.9 3.6 0.3
Excise duties & other taxes 73.5 76.8 4.6 1.8
Non-tax revenues 191.9 175.6 –8.5 4.1
Oil & gas revenues 105.4 112.3 6.5 2.6
Other non-tax revenues 86.4 63.3 –26.7 1.5
Grants 2.7 2.1 –24.0 0.0
EXPENDITURE 746.4 836.4 12.1 19.4
Central government 493.9 564.6 14.3 13.1
Personnel 99.9 129.5 29.6 3.0
Goods & services 62.5 52.4 –16.2 1.2
Capital expenditure 68.3 101.5 48.6 2.4
Domestic interest payments 61.4 62.8 2.3 1.5
External interest payments 24.9 28.7 15.5 0.7
Subsidies 105.2 92.6 –11.9 2.2
Social assistance 47.5 67.4 41.8 1.6
Grants & other expenditures 24.2 29.6 22.5 0.7
Transfers to regional governments 252.5 271.8 7.6 6.3
DEFICIT –62.0 –75.0 21.1 1.7
FINANCING 62.0 75.0 21.1 1.7
Government bonds 62.3 91.7 47.1 2.1
Domestic banks 10.6 0.3 –97.2 0.0
Foreign gross drawing 42.4 43.0 1.3 1.0
Less amortisation –55.1 –59.7 8.4 –1.4
Privatisation, asset recovery, other 1.7 –0.2 –112.1 0.0
ASSUMPTIONS
Real GDP growth rate (%) 6.3 6.8
Infl ation (% p.a.) 6.5 6.0
Average exchange rate (Rp/$) 9,100 9,100
SBI average (% p.a.) 8.0 7.5
Crude oil prices ($/barrel) 60 60
Oil production (million barrels per day) 950 1,034
Memo item: nominal GDP (Rp trillion) 3,804 4,307
Sources: Ministry of Finance (2007b); BI (2007a).
cbieDec07b.indb 307
cbieDec07b.indb 307 24/10/07 3:59:15 PM24/10/07 3:59:15 PM
and other basic commodities (JP, 24/7/2007). Personnel expenditure increases are closely related to efforts by fi nance minister Sri Mulyani Indrawati to enhance the
welfare of public servants and improve the quality of the bureaucracy (Tempo, 21–27/8/2007: 42–9). Efforts to improve government effi ciency are also refl ected
in the predicted fall in expenditure on goods and services.
The government has generally found it diffi cult to meet its spending targets
in recent years, however. In 2007, for example, less than 25% of planned capital expenditure had been realised in the fi rst seven months (JP, 18/8/2007). Delays
in infrastructure spending result from diffi culties over land
acquisition—notwith-standing the introduction of a new presidential regulation to deal with precisely that problem (McLeod 2005: 146–7); inability to coordinate the activities of central and local governments; and complicated arrangements for private–public coop-eration on infrastructure development schemes. Such problems are likely to be amplifi ed in 2008, with these expenditures planned to accelerate so rapidly. It
is also possible that the government’s continuing anti-corruption campaign will make offi cials more risk-averse and reluctant to implement spending programs.
Taking these considerations into account, together with the long lead times involved even in well-managed infrastructure projects, it is hard to see that the government will be able to increase its capital expenditures to the extent pro-posed in such a short time. It is equally diffi cult to imagine that the proposed cut
in spending on goods and services (over 22% in real terms in an economy grow-ing at 6–7%) will be achieved.
The government projects overall tax revenue to grow by 19% in 2008 (table 2). Increased tax collection efforts have resulted in a very gradual increase in the ratio of tax to GDP, from 12% in 2002 to a projected 14% in 2008, and the fi nance
minis-try is accelerating efforts to improve tax collection further (Tempo, 21–27/8/2007: 42–49). The authorities still have diffi culty meeting tax revenue targets, however.
Tax revenue collected through mid-June 2007 was only 37% of the annual total in the revised budget for 2007 (Ministry of Finance 2007a: II-16). The government attributes this to administrative problems with data on previous tax collection and the lack of standard operating procedures. Others emphasise low tax compli-ance stemming from a public view that the government’s tax collection proce-dures and related policies are unfair (JP, 14/8/2007).
In June 2007, after long debate, the parliament passed an amendment to the 2000 general taxation arrangements and procedures law. This was drafted partly in response to perceptions that Indonesia’s tax laws confer too much power on often corrupt taxation offi cials and adversely affect the investment climate. Later in 2007
the DPR is also expected to pass related revisions to the 2000 income tax law and the 2000 VAT and luxury sales tax law (JP, 30/3/2007). All of these changes were pro-posed by the government in late 2005, and became the subject of vigorous debate in the DPR, much of it focusing on the procedures for fi ling objections to tax
assess-ments. In its original bill, the government proposed that taxpayers who wanted to
fi le a formal objection to their tax assessment would have to make an initial
pay-ment, agreed on with the tax offi ce in advance. If the objection was then rejected,
the taxpayer would have to pay a fi ne amounting to 100% of the agreed amount.
Taxpayers could appeal the tax offi ce’s decision to a tax tribunal, but the fi ne would
increase to 200% in the event of a failed appeal. This proposal was rejected, and the amendment that was passed requires no advance payment in the case of
for-cbieDec07b.indb 308
cbieDec07b.indb 308 24/10/07 3:59:16 PM24/10/07 3:59:16 PM
mal objections, while fi nes have been reduced to 50% and 100%, respectively, of
the assessed amount of tax. This amendment was intended to protect taxpayers who had paid tax correctly but could not afford the cost of fi ling an objection. The
amendment to the taxation law also has provisions for punishing tax offi cials found
to have treated taxpayers unjustly, and establishes a grace period of one month (instead of a few days) to furnish information requested by tax offi cials.
The external sector
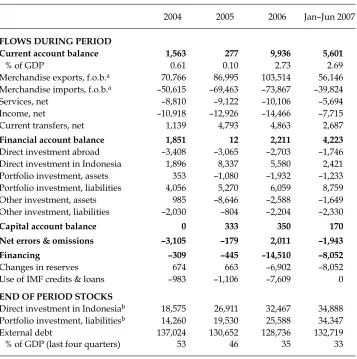
One of the largest changes in the economy over the last decade has occurred in the external sector, where moderate current account defi cits in the mid-1990s turned
to large surpluses in most subsequent years. The surplus fell close to zero in 2005 (table 3), but increased subsequently to almost 3% of GDP in 2006 and the fi rst half
TABLE 3 Balance of Payments and External Debt ($ million, except as noted)
2004 2005 2006 Jan–Jun 2007
FLOWS DURING PERIOD
Current account balance 1,563 277 9,936 5,601
% of GDP 0.61 0.10 2.73 2.69
Merchandise exports, f.o.b.a 70,766 86,995 103,514 56,146
Merchandise imports, f.o.b.a –50,615 –69,463 –73,867 –39,824
Services, net –8,810 –9,122 –10,106 –5,694
Income, net –10,918 –12,926 –14,466 –7,715
Current transfers, net 1,139 4,793 4,863 2,687
Financial account balance 1,851 12 2,211 4,223
Direct investment abroad –3,408 –3,065 –2,703 –1,746
Direct investment in Indonesia 1,896 8,337 5,580 2,421
Portfolio investment, assets 353 –1,080 –1,932 –1,233
Portfolio investment, liabilities 4,056 5,270 6,059 8,759
Other investment, assets 985 –8,646 –2,588 –1,649
Other investment, liabilities –2,030 –804 –2,204 –2,330
Capital account balance 0 333 350 170
Net errors & omissions –3,105 –179 2,011 –1,943
Financing –309 –445 –14,510 –8,052
Changes in reserves 674 663 –6,902 –8,052
Use of IMF credits & loans –983 –1,106 –7,609 0
END OF PERIOD STOCKS
Direct investment in Indonesiab 18,575 26,911 32,467 34,888
Portfolio investment, liabilitiesb 14,260 19,530 25,588 34,347
External debt 137,024 130,652 128,736 132,719
% of GDP (last four quarters) 53 46 35 33
a f.o.b. = free on board.
b Direct and portfolio investment stocks are cumulative fl ows from 1981 forward.
Source: CEIC Asia Database.
cbieDec07b.indb 309
cbieDec07b.indb 309 24/10/07 3:59:17 PM24/10/07 3:59:17 PM
of 2007. The level of external debt has stabilised at about $130 billion since 2005, and with steady output growth and infl ation, and a reasonably stable exchange
rate, the ratio of debt to GDP has fallen steadily, from 53% in 2004 to just 33% in mid-2007. One item of particular interest in the fi nancial account of the balance
of payments is inward portfolio investment, which was nearly 45% higher for the
fi rst half of 2007 than for the whole of 2006—and had increased by 15% between
2005 and 2006. This capital infl ow has not been allowed to add to resource
avail-ability in Indonesia, however, as it has been almost exactly matched by increases in central bank lending to foreign governments: total inward portfolio investment for the 18 months to mid-2007 was $14.8 billion, while the increase in BI’s inter-national reserves was $15.0 billion. Recent increases in both inward portfolio and direct investment have been taken as a sign of renewed confi dence among foreign
investors, nevertheless.
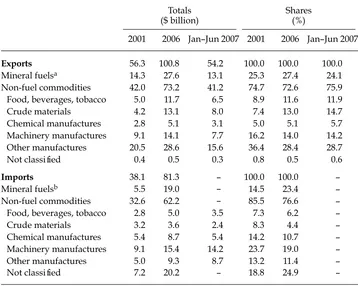
Indonesia still exports substantial quantities of oil and natural gas, and the share of these exports increased slightly to over one-fourth in 2006, but fell back some-what in the fi rst half of 2007, refl ecting fl uctuations in oil and gas prices (table 4).
Exports of crude materials (mainly mineral ores, crude rubber and cooking oil) also benefi ted from high world prices, which rose markedly in 2006 and the fi rst half
of 2007. By the fi rst half of 2007, the share of this group reached 15% of the total,
about double the 2001 level. In contrast, growth in exports of machinery, which had been rapid up to 2001, has slowed, and the share of this group fell back to 14% in 2006 and the fi rst half of 2007. The stagnation of other manufactured exports,
including exports of many labour-intensive products, is of particular concern. The picture is not entirely bleak, but the fall in the share of other manufactures to only 28–29% in 2006 and the fi rst half of 2007 from as much as 36% in 2001 is important
to understand, and will be examined in more detail below.
A large portion of Indonesia’s imports (about one-quarter in 2006) are not clas-sifi ed by commodity category, and the majority of these are imports through the
export processing zones (EPZs) in Batam and elsewhere.15 Most are probably
machinery and other manufactures used as intermediate inputs. Known imports of machinery accounted for about one-fi fth of all imports in 2006, down from
about one-quarter in 2001 and even higher levels before the crisis, when high
fi xed investment generated high imports of this kind.16 Chemicals and other
manufactures each had shares of slightly over one-tenth in 2006, while mineral fuel imports grew to account for just under one-quarter of the total as Indonesia’s increasing demand for heavily subsidised fuel products outstripped its supply capacity, and as world prices increased.
Indonesia’s largest export markets continue to be the advanced economies of Japan, the European Union and the US, which combined to account for 45% of total exports in 2006, down from 51% in 2001 (BPS-Statistics Indonesia, Foreign
15 Total imports c.i.f. (cost, insurance and freight) are estimated as the f.o.b. (free on board) fi gure reported in the balance of payments plus 10% for cost, insurance and freight. Im-ports by commodity category are taken from c.i.f. import data, and the difference, plus imports classifi ed in section 9 of the Standard International Trade Classifi cation (SITC), is reported as ‘not classifi ed’.
16 BPS-Statistics Indonesia, Foreign Trade Statistical Bulletin: Exports and Foreign Trade Sta-tistical Bulletin: Imports, December issues, 2000–06.
cbieDec07b.indb 310
cbieDec07b.indb 310 24/10/07 3:59:17 PM24/10/07 3:59:17 PM
Trade Statistical Bulletin, see note 16). In 2006, China, Singapore and Korea fol-lowed with shares of 8–9% each. Refl ecting its rapid growth, China’s share
dou-bled between 2001 and 2006, while the Singaporean and Korean shares changed little. A large portion of the exports to Singapore represents entrepôt trade bound for other economies. Although Indonesia’s dependence on Japan, the EU and the US has declined, it remains high. This creates concern because the EU and the US are most exposed to the US sub-prime mortgage lending problem. Moreover, if growth slows in these economies, it will affect Indonesia’s exports indirectly through its impact on other economies that export extensively to the US, such as Japan, China, Korea and Singapore.
By the fi rst half of 2007, Singapore had become the largest supplier of imports
reported by source (excluding those through EPZs), followed by closely by China, Europe and Japan (BPS-Statistics Indonesia, Foreign Trade Statistical Bulletin, see note 16; BI 2007a). Most of the increase in Singapore’s share occurred between 2004 and 2005 (from 7% to 17%), and most of this increase probably resulted from
TABLE 4 Merchandise Trade by Major Category
Totals ($ billion)
Shares (%)
2001 2006 Jan–Jun 2007 2001 2006 Jan–Jun 2007
Exports 56.3 100.8 54.2 100.0 100.0 100.0
Mineral fuelsa 14.3 27.6 13.1 25.3 27.4 24.1
Non-fuel commodities 42.0 73.2 41.2 74.7 72.6 75.9
Food, beverages, tobacco 5.0 11.7 6.5 8.9 11.6 11.9
Crude materials 4.2 13.1 8.0 7.4 13.0 14.7
Chemical manufactures 2.8 5.1 3.1 5.0 5.1 5.7
Machinery manufactures 9.1 14.1 7.7 16.2 14.0 14.2
Other manufactures 20.5 28.6 15.6 36.4 28.4 28.7
Not classifi ed 0.4 0.5 0.3 0.8 0.5 0.6
Imports 38.1 81.3 – 100.0 100.0 –
Mineral fuelsb 5.5 19.0 – 14.5 23.4 –
Non-fuel commodities 32.6 62.2 – 85.5 76.6 –
Food, beverages, tobacco 2.8 5.0 3.5 7.3 6.2 –
Crude materials 3.2 3.6 2.4 8.3 4.4 –
Chemical manufactures 5.4 8.7 5.4 14.2 10.7 –
Machinery manufactures 9.1 15.4 14.2 23.7 19.0 –
Other manufactures 5.0 9.3 8.7 13.2 11.4 –
Not classifi ed 7.2 20.2 – 18.8 24.9 –
a Oil and gas exports (which account for the vast majority of mineral fuels) for the fi rst half of 2007 are estimated by extrapolating from the actual fi gure for the fi rst half of 2006, using the growth rate for the period January–May 2006 to January–May 2007.
b Estimates of mineral fuel imports are not available for 2007.
Sources: BPS-Statistics Indonesia, Foreign Trade Statistical Bulletin: Exports and Foreign Trade Statistical Bulletin: Imports, December issues, 2000–2006; BI (2007a).
cbieDec07b.indb 311
cbieDec07b.indb 311 24/10/07 3:59:17 PM24/10/07 3:59:17 PM
improved data collection and reporting, rather than from an increase in imports from this source. Entrepôt trade originating elsewhere accounts for a large pro-portion of the imports from Singapore.
INDONESIAN COMPETITIVENESS AND THE WORLD TRADING SYSTEM
How competitive are Indonesia’s major non-fuel exports?
The trade data discussed above suggest that most of the recent increase in exports is accounted for by primary products, more specifi cally mineral fuels and crude
materials, and that export growth in machinery and other manufactures has been relatively slow during this period. In a similar vein, Basri and Patunru (2007) sug-gest that post-crisis rises in non-oil exports were primarily the result of increased prices for primary products, while a report by the World Trade Organization (WTO 2007b: 10) cites a Bank Indonesia fi nding that the large increase in export
values for 2005 was largely the result of price increases, not volume increases. These observations are often advanced to suggest that Indonesia has become less competitive in important export markets since the economic crisis. Much of the policy debate in recent years has focused on why Indonesia’s products are losing competitiveness to rapidly growing exporters like China and Vietnam. Labour market rigidities, infrastructure defi ciencies and a poor regulatory environment
are often cited as causes, and this is refl ected in economic policy packages directed
at these areas. However, the reality appears more complex than is implied by this rather superfi cial policy debate.
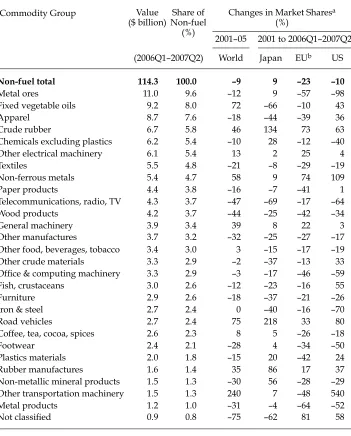
Even a moderately detailed breakdown of non-fuel exports reveals substan-tial diversity. The largest of the 28 detailed commodity categories listed in table 5 (metal ores, mainly copper and nickel) accounted for only 9.6% of non-fuel exports in 2006 and the fi rst half of 2007. Two others (fi xed vegetable oils and
apparel) had shares of 7.6–8.0% and only fi ve more (crude rubber [mainly natural
crude rubber]; chemicals excluding plastics; other electrical machinery; textiles; and non-ferrous metals) had shares of 4.7% or more.17 Together these eight
cat-egories accounted for just over one-half of the non-fuel total in this period. In addition, the two largest categories (metal ores and fi xed vegetable oils) and the
fourth largest category (crude rubber) are often classifi ed as primary products in
compilations of trade data, but related production is often carried out by fi rms or
plants usually classifi ed as manufacturers in data on the national accounts (table
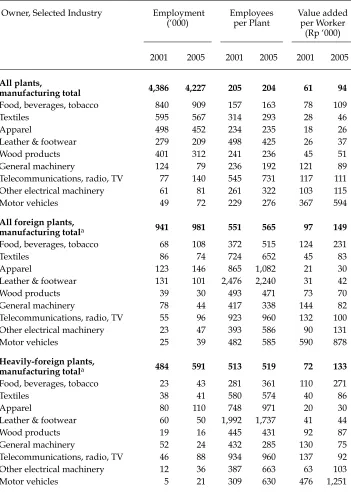
1), employment (table 6), or the manufacturing sector (table 7). This is also true for other categories in food, beverages and tobacco, as well as other crude materials.
Although Indonesia’s large shares of metal ores, fi xed vegetable oils and crude
rubber exports refl ect the fact that the country’s exports have benefi ted from high
world prices for these commodities, rapid growth in fi xed vegetable oils and crude
rubber has also been the result of Indonesia’s ability to expand its shares of export
17 The commodity categories in table 5 are defi ned to include all large export categories at the 2-digit level of the SITC. Smaller 2-digit categories are combined to make seven rela-tively small, more aggregated categories (other food, beverages and tobacco; other crude materials; chemicals; plastic materials; general machinery; other manufactures; and not classifi ed).
cbieDec07b.indb 312
cbieDec07b.indb 312 24/10/07 3:59:18 PM24/10/07 3:59:18 PM
TABLE 5 Exports and Market Shares for Large Non-fuel Groups
Commodity Group Value
($ billion)
Share of Non-fuel
(%)
Changes in Market Sharesa
(%)
2001–05 2001 to 2006Q1–2007Q2
(2006Q1–2007Q2) World Japan EUb US
Non-fuel total 114.3 100.0 –9 9 –23 –10
Metal ores 11.0 9.6 –12 9 –57 –98
Fixed vegetable oils 9.2 8.0 72 –66 –10 43
Apparel 8.7 7.6 –18 –44 –39 36
Crude rubber 6.7 5.8 46 134 73 63
Chemicals excluding plastics 6.2 5.4 –10 28 –12 –40
Other electrical machinery 6.1 5.4 13 2 25 4
Textiles 5.5 4.8 –21 –8 –29 –19
Non-ferrous metals 5.4 4.7 58 9 74 109
Paper products 4.4 3.8 –16 –7 –41 1
Telecommunications, radio, TV 4.3 3.7 –47 –69 –17 –64
Wood products 4.2 3.7 –44 –25 –42 –34
General machinery 3.9 3.4 39 8 22 3
Other manufactures 3.7 3.2 –32 –25 –27 –17
Other food, beverages, tobacco 3.4 3.0 3 –15 –17 –19
Other crude materials 3.3 2.9 –2 –37 –13 33
Offi ce & computing machinery 3.3 2.9 –3 –17 –46 –59
Fish, crustaceans 3.0 2.6 –12 –23 –16 55
Furniture 2.9 2.6 –18 –37 –21 –26
Iron & steel 2.7 2.4 0 –40 –16 –70
Road vehicles 2.7 2.4 75 218 33 80
Coffee, tea, cocoa, spices 2.6 2.3 8 5 –26 –18
Footwear 2.4 2.1 –28 4 –34 –50
Plastics materials 2.0 1.8 –15 20 –42 24
Rubber manufactures 1.6 1.4 35 86 17 37
Non-metallic mineral products 1.5 1.3 –30 56 –28 –29
Other transportation machinery 1.5 1.3 240 7 –48 540
Metal products 1.2 1.0 –31 –4 –64 –52
Not classifi ed 0.9 0.8 –75 –62 81 58
a Except for Japan, compilations are from the 2-digit level of the Standard International Trade Clas-sifi cation (SITC), revision 3; Japanese data are compiled from the closest corresponding 3- or 5-digit
categories of its ‘major commodity’ classifi cation. There are important differences between the SITC
and the Japanese classifi cation, however.
b EU data refer to changes between 2001 and January 2006 – May 2007.
Sources: BI (2007a); BPS-Statistics Indonesia, Foreign Trade Statistical Bulletin: Exports, December issues 2000–06; European Commission, Eurostat external trade database, <http://fd.comext.eurostat.cec. eu.int/xtweb/>, accessed August 2007; IMF (2007); Japan, Ministry of Finance, Trade Statistics of Japan: Country by Principal Commodity, <http://www.customs.go.jp/toukei/download/index_ d022_e.htm>, accessed August 2007; UN Statistics Division, Comtrade database, <http://comtrade. un.org/>, accessed August 2007; US International Trade Commission, USITC Interactive Tariff and Trade DataWeb, <http://dataweb.usitc.gov/scripts/user_set.asp>, accessed August 2007.
cbieDec07b.indb 313
cbieDec07b.indb 313 24/10/07 3:59:19 PM24/10/07 3:59:19 PM
markets for these commodities (table 5). For example, between 2001 and 2005, Indo-nesia’s share of world exports increased by 72% for fi xed vegetable oils (from 9.4%
to 16%). Among the ‘triad’ markets (Japan, EU, US), shares increased in the US, but declined in the EU and Japan. There were also relatively large increases in world shares (46%) and triad market shares (63–134%) for crude rubber. Similarly, market shares increased in the smaller, related category of rubber manufactures, especially in the Japanese market. In the other large primary product category, metal ores, and the smaller categories of other food, beverages and tobacco and other crude materi-als, changes in market shares varied depending on the market and the product.
On the other hand, Indonesia’s market shares have generally declined in nine groups of exports often thought to be rather labour intensive: textiles; apparel; footwear; wood products; furniture; paper products; offi ce and computing
machinery; telecommunications, radio and TV; and miscellaneous (‘other’) manu-factures. Declines in world shares were largest in telecommunications, radio and TV (47%) and wood products (44%), but there were also substantial declines in the other categories. Most triad shares also declined for these commodities—apparel in the US being the most conspicuous exception. The common characteristics of these industries seem to be their high labour intensity and the fact that competing products from China and Vietnam have often done well in these markets. How-ever, there is an important exception in another labour-intensive category—other electrical machinery (mainly parts)—where market shares have remained constant (Japan, US) or increased somewhat (World, EU). Moreover, it should be empha-sised that competitors such as China and Vietnam often produce products differ-ent from Indonesia’s in these rather diverse industries (James 2002, 2007a, 2007b), and Athukorala (2006: 207) argues that ‘there is no evidence that competition from China necessarily implies a proportionate loss in market share’ for Indonesia.
Perhaps surprisingly, Indonesia has also made gains in markets for more capital-intensive categories such as non-ferrous metals; general machinery; motor vehi-cles; and other transport machinery. Overall, Indonesia gained market share in 10 of 28 categories in the world market, 13 in Japan and 14 in the US, but only 7 in the EU. Relatively large increases (25% or more) were observed in 10 categories in the US market. On the other hand, decreases of similar magnitude were observed in 13 categories for the EU, 10 for the US, 9 for Japan and 7 for the world.
Indonesia has not lost market share across the board. Rather, trends in market shares seem highly product-specifi c, with declines most conspicuous in
labour-intensive categories. Although we cannot provide direct evidence here, increas-ing labour costs are a potentially important cause of decreased competitiveness, and are thought to have resulted from labour market regulations that mandate relatively high minimum wages and severance pay, for example (Manning and Roesad 2006, 2007; Athukorala 2006). There are also important variations across export markets, with Indonesian exports generally doing better in Japan and the US than in the EU.18
18 Reduced competitiveness in some sectors can be the result of good fortune in others; for example, a rise in export prices for some goods can cause appreciation of the real exchange rate, making other exports less competitive.
cbieDec07b.indb 314
cbieDec07b.indb 314 24/10/07 3:59:20 PM24/10/07 3:59:20 PM
Indonesia and the world trading system
In recent years Indonesia’s trade policies have undergone two important changes. First, Indonesia’s unweighted average tariff rate rose from 7.2% in 2003 to 9.9% in 2004, reversing a trend toward lower rates that began in 1996 (WTO 2007b). The proximate cause was an increase in the number of tariff lines from 7,540 in 2003 to 11,163 in 2004, as Indonesia adopted a harmonised tariff classifi cation as a
con-sequence of its commitments under the ASEAN Free Trade Agreement (AFTA). The average tariff then fell back to 9.5% in 2006, and both government and World Trade Organization (WTO) reports (WTO 2007a, 2007b) carefully document Indo-nesia’s commitments to further import liberalisation. However, the WTO reports and Basri and Patunru (2007) also document trends toward increased tariffs and non-tariff barriers for some products, and persistently high protection for oth-ers. Import licensing requirements remain in textiles and textile products, for example, though it is not known how much they affect the level of protection for intermediate goods and thus production costs in this and related industries. The automobile sector also remains highly protected.
The second important change is a shift in trade policy emphasis from negotiat-ing multilateral agreements in the WTO to enternegotiat-ing bilateral agreements, exem-plifi ed by the recent signing of an Economic Partnership Agreement (EPA) with
Japan (box 2). This shift has occurred partially because the Doha Round negotia-tions have stalled, and prospects for a new round of multilateral liberalisation are uncertain at best. It is also a response to the active pursuit of bilateral agreements by many of Indonesia’s major trading partners: the EPA with Japan resulted at least as much from Japan’s desire for a bilateral agreement as from Indonesia’s. Like most international economists, we believe that the plethora of bilateral agree-ments negotiated in recent years is likely to create a more ineffi cient world
trad-ing system than a multilateral alternative. However, bilateral agreements may be preferable to no agreement if the multilateral alternative fails.
THE NEW NEGATIVE INVESTMENT LIST
The long-awaited new ‘negative list’ of activities closed to certain categories of investors was unveiled in early July 2007. The list specifi es 25 closed sectors
and 300 industries conditionally open to investment. The list of closed sectors is designed to protect so-called ‘national interests‘, while the conditional list
speci-fi es industries in which micro, small and medium enterprises are to be promoted,
so that investment is subject to foreign equity limitations, location requirements or special licences. According to some accounts, the new negative list is not exces-sively protectionist; for example, although it tightens restrictions on 11 industries, 69 will be more open to foreign investment (JP, 24/4/2007, 6/7/2007). These accounts also emphasise that the new investment law guarantees equal treat-ment of foreign and domestic fi rms in open sectors, but not equal opportunity to
invest in all sectors. The new list is supposed to be more transparent than the old one, because it clearly specifi es the restricted industries using the 5-digit
Indo-nesian Business Classifi cation, which is very close to the International Standard
Industrial Classifi cation. Also included are clearer mechanisms for revising the
list, making it more diffi cult to increase the number of protected industries than
in the past.
cbieDec07b.indb 315
cbieDec07b.indb 315 24/10/07 3:59:20 PM24/10/07 3:59:20 PM