CHARACTERISING VEGETATED SURFACES USING MODIS MULTIANGULAR
SATELLITE DATA
Geoffrey McCamley a, *, Ian Grant b, Simon Jones a, Chris Bellman a
a
RMIT University, Melbourne Australia - ([email protected]) b Bureau of Meteorology, Melbourne Australia ([email protected])
KEY WORDS: Vegetation, Soil, Spectral, Geometry, Modelling, BRDF, NDVI
ABSTRACT
Bidirectional Reflectance Distribution Functions (BRDF) seek to represent variations in surface reflectance resulting from changes in a satellite’s view and solar illumination angles. BRDF representations have been widely used to assist in the characterisation of vegetation. However BRDF effects are often noisy, difficult to interpret and are the spatial integral of all the individual surface features present in a pixel.
This paper describes the results of an approach to understanding how BRDF effects can be used to characterise vegetation. The implementation of the Ross Thick Li Sparse BRDF model using MODIS is a stable, mature data product with a 10 year history and is a ready data source. Using this dataset, a geometric optical model is proposed that seeks to interpret the BRDF effects in terms of Normalised Difference Vegetation Index (NDVI) and a height-to-width ratio of the vegetation components. The height-to-width ratio derived from this model seeks to represent the dependence of NDVI to changes in view zenith angle as a single numeric value.
The model proposed within this paper has been applied to MODIS pixels in central Australia for areas in excess of 18,000 km2. The study area is predominantly arid and sparsely vegetated which provides a level of temporal and spatial homogeneity. The selected study area also minimises the effects associated with mutual obscuration of vegetation which is not considered by the model.
The results are represented as a map and compared to NDVI derived from MODIS and NDVI derived from Landsat mosaics developed for Australia’s National Carbon Accounting System (NCAS). The model reveals additional information not obvious in reflectance data. For example, the height-to-width ratio is able to reveal vegetation features in arid areas that do not have an accompanying significant increase in NDVI derived from MODIS, i.e. the height-to-width ratio reveals vegetation which is otherwise only apparent in NDVI derived from the higher resolution Landsat NCAS dataset.
1. INTRODUCTION
Bidirectional Reflectance Distribution Functions (BRDF) seek to represent variations in surface reflectance resulting from changes in a satellite’s view and illumination angles. BRDF representations have been widely used to assist in the characterisation of vegetation (Lovell and Graetz, 2001) (Hill et al., 2008) (Grant, 2000). Variations in BRDF effects have been observed in past studies and metrics based on BRDF effects have been developed to characterise vegetation, for example the Structural Scattering Index (SSI) (Gao et al., 2003) and the Anisotropic Factor (ANIF) (Sandmeier et al., 1998). Past studies have also shown BRDF effects to be noisy and difficult to interpret (Gao et al., 2003).
Sensors capable of sufficient angular sampling and revisit frequencies necessary for determining BRDF effects tend to have moderate to low spatial resolution. For example, BRDF effects cannot be directly derived from Landsat data due to the small variation in illumination and viewing angles and infrequent revisits of the sensor (Li et al., 2010). Other sensors with similar or higher spatial resolutions than the 30m provided by Landsat also typically have small variations in angular
sampling and infrequent revisits limit their ability to derive BRDF effects. As a consequence, BRDF effects derived from satellite data will tend to be associated with moderate resolution sensors and the results will be a spatial integral of the different surface features present in a pixel. Therefore to study BRDF effects of specific features, surfaces often need to be found that are homogeneous at a given spatial scale, but these surfaces are often difficult to find or are of limited interest, for example dried salt lakes. This paper describes an approach to interpreting the RossThickLiSparse BRDF representation as derived by observations from NASA’s Moderate Resolution Image Spectrometer (MODIS).
2. METHOD
The MODIS BRDF representation models the atmospherically corrected surface reflectance as a function of the sun and view directions. Specifically, the MODIS MCD43A1 product provides BRDF parameter weights of the RossThickLiSparse-Reciprocal BRDF model, i.e. weights of the isotropic,
volumetric and geometric kernel functions (Wanner et al., 1997). The weights are derived separately for each of the seven observed visible to mid-infrared bands, at 500-m resolution in eight-day intervals (Lucht et al., 2000). The MODIS BRDF representation has been shown to be accurate (Schaaf et al., 2002) and modelled reflectance less susceptible to noise than individual BRDF parameters (Lucht and Lewis, 2000). Further details of the MCD43 product can be obtained at the Boston University web site (http://www-modis.bu.edu/brdf/index/).
The MCD43 product is distributed by the Land Processes Distributed Active Archive Centre (LP DAAC,
https://lpdaac.usgs.gov/) as 10-degree tiles in a sinusoidal projection. For the work described here, the tiles have been mosaiced and re-projected to a Geographical grid covering the Australian continent, using the MODIS Re-projection Tool (MRT) software distributed by the LP DAAC and applied by the Australian Government’s Commonwealth Scientific and Industrial Research Organisation (CSIRO) (Paget and King, 2008). The use of an established data set is a pragmatic approach to data collection and processing, and means that any results have the potential for broad and immediate application.
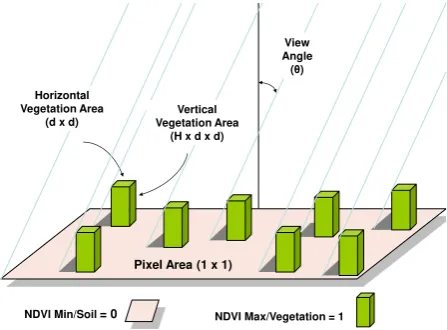
A simple model is developed to interpret the RossThickLiSparse BRDF representation by considering pixels to be a composite of just two elements; a soil layer having NDVI = 0 and vegetation components with NDVI =1. NDVI is derived from MODIS reflectance bands as (R2– R1) / (R2 + R1), where R1 and R2 are the red and near-infrared surface reflectance. The soil layer may be considered a flat surface and the vegetation components vertical prism shaped protrusions. The use of prism shaped objects to represent vegetation has the benefit of computational simplicity and the shape of protrusions should not be important, with prisms having been used in past BRDF modelling (Roujean et al., 1992). The vegetation prisms may be described in dimensions that are a proportion of a pixel’s dimensions and the model is graphically depicted in Figure 1. Considering the geometry of this surface model, an expression can be derived for changes in NDVI with increased viewing angle. Larger viewing angles will bring the vertical surfaces of vegetation into view and obscure an area of soil.
NDVI Max/Vegetation = 1
Figure 1. Prisms of vegetation are depicted on a flat surface of soil with an area of soil obscured via the vegetation prism based on the viewing geometry of the sensor.
Treating changes in NDVI across a range of viewing angles derived from the MODIS BRDF representation as ‘observations’, numerical values for the height-to-width ratio of
the vegetation prisms within this model may be derived that provides a best fit (lowest root mean square error (RMSE)) to NDVI as derived from MCD43A1 BRDF parameter weights across the same range of view angles, i.e. 0º to 57º; being at the upper limit of MODIS’s angular sampling (Wanner et al., 1997). This approach seeks to replace the wavelength specific isotropic, volumetric and geometric BRDF parameters within the MODIS model with an alternate set, namely NDVI and the height-to-width ratio of the vegetation. This model is expressed in equation (1). represents the density of vegetation coverage which is the sum of the horizontal surface areas of number of vegetation prisms present within a pixel. For a given density of vegetation and a height-to-width ratio (H), a single number of individual vegetation prisms present, the density and the height-to-width ratio (H). However, as the vegetation volume is not considered within this model, the number of individual vegetation prisms can be ignored.
Application of this model is based on changes in viewing angle only. Values for the solar zenith angle and relative azimuth must be determined and fixed when generating ‘observations’ using MODIS’s BRDF representation which the model seeks to interpret. In application of this model a 0º solar zenith angle and a 0º relative azimuth have been used. Using 0º for the solar zenith angle will make consideration of the relative azimuth selected irrelevant. A 0º solar zenith angle and 0º viewing angle will represent the ‘hot spot’, which is the angularly narrow reflectance enhancement around the antisolar direction. The range of viewing angles from 0º to 57º used for deriving the model parameters represents consistent viewing away from the hot spot without the need to consider viewing angles that will cross the hot spot. This enables the model to remain relatively simple in its formation. The MODIS BRDF representation is reciprocal between solar and viewing angle, therefore whilst a 0º solar zenith angle may not have been observed by MODIS in deriving the BRDF representation, viewing angles close to a 0º are likely to have been observed and will provide a similar constraint on the MODIS BRDF. Past studies have shown that linear BRDF models are stable when extrapolated to zero zenith angles (Lucht and Lewis, 2000). Also, a solar zenith angle of 0º eliminates shadow effects in the model.
Past studies have observed changes in NDVI with respect to viewing angles (Huete, 1987) (Tian et al., 2010). The model presented in this paper for interpreting change in NDVI
associated with view angle is derived from geometric considerations, where H is the height-to-width ratio of the vegetation prisms. However, interpreting the resulting values for H as a quantifiable geometric parameter for the height of vegetation may not be readily achievable. The resulting height-to-width ratio may be considered a component contributing to changes in NDVI with respect to changes in viewing angle. The value of H seeks to assign a single numeric value to the dependence of NDVI on view angle which can be used in the characterisation of vegetated surfaces.
In application of the model, height-to-width ratio values in the range from -1 to +1 are allowable. Derived negative values for the height-to-width ratio have been accepted if they provide a best fit with NDVI derived from the MODIS BRDF model over the same range of view angles, although a geometric interpretation of negative values is unclear.
2.1 Study Area
The model described by equation (1) has been applied to MODIS pixels for an area in central Australia. A study area that has low vegetation cover is preferable, as the model does not consider the mutual obscuration of vegetation components that is more likely to occur with higher vegetation densities. Furthermore, as the results will be compared to the National Carbon Accounting System (NCAS) Landsat Mosaics (refer section 4) which have been acquired over a period of time, study areas that are temporarily invariant are also preferable, for example arid non-agricultural regions. An area in arid Australia was selected. The location of the area is shown in Figure 2 and an enlargement of the study area is shown in Figure 3 which represents 1 ½ degrees of longitude and 1 degree of latitude. MODIS pixels have been selected for an epoch in mid-February 2005 (i.e. summer). The quality flags associated with the MODIS BRDF inversion indicate that pixels within the study area and the selected epoch were processed without adverse quality issues.
Figure 2. Study area in central Australia, Latitude 28° 00’ S to 29°00’ S, Longitude 138°00’ E to 139° 30’ E. Area is approximately 18,000km2. Image is from Google Earth.
Figure 3. Image is an enlargement of the study site located in Figure 2. The major feature running from the upper right to centre left of the image is Cooper Creek which runs into Lake Eyre being located outside the study area to the left. Image is from Google Earth.
3. RESULTS
With the derived best fit height-to-width ratio (H) substituted back into equation 1, the model generally provides a good fit to NDVI derived across the same range of view angles based on the MODIS BRDF representation.
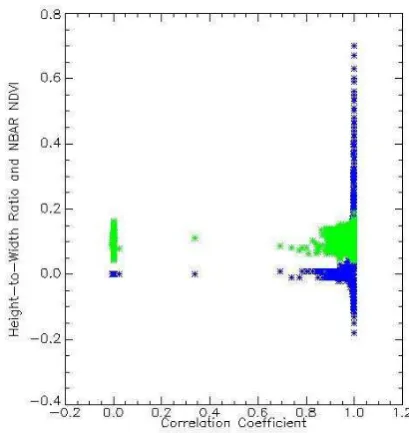
Figure 4. The y-axis shows derived height-to-width ratios (blue) and MODIS NBAR NDVI (green) plotted against the correlation coefficient between NDVI derived from the MODIS BRDF representation and the model (with substituted with best fit values for height-to-width ratio) on the x-axis.
Figure 4 shows that the model generally provides good correlations to NDVI derived from the MODIS BRDF model, i.e. correlations close to 1. When the correlations are significantly less than 1 (e.g. a clustering of correlations around 0) the derived height-to-width ratio also tends to be near 0.
Furthermore, the fit between the model and NDVI derived from the MODIS BRDF representation appears independent of Nadir Adjusted Brightness Reflectance (NBAR) NDVI response.
Figure 5. Derived height-to-width ratio for the study area. Dark areas indicate lower values and lighter areas indicate higher values for the derived height-to-width ratio.
Derived height-to-width ratios ranged from -0.18 to 0.7. To support better visualisation of the results, outlying values have been replaced with ceiling values of 0.3 and floor values of -0.1 respectively and the image in Figure 5 has had brightness values scaled within this range. Higher height-to-width ratios appear broadly associated with the Cooper Creek and around the edges of dried salt lakes.
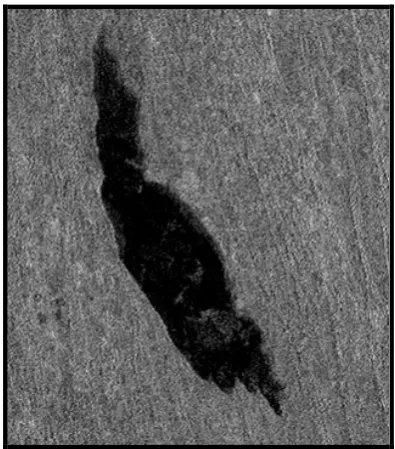
Figure 6. An enlargement of the derived height-to-width ratio for the upper left corner of the study area as shown in Figure 5.
Figure 6 shows the derived height-to-width ratio of features in the upper left corner of the study area that exhibit a significantly lower NDVI response than the surrounding areas as measured by both MODIS and Landsat (refer Figure 8). These features are most likely dried salt lakes. The derived height-to-width ratio shows higher values on the inside rim (i.e. lighter white
areas) and lower height-to-width ratio values (i.e. darker black areas) in areas immediately outside the rim of the dried salt lakes. Whilst this could be characteristic of the vegetation which the model is intended to identify, the higher resolution NCAS Landsat NDVI does not display similar variation (refer Figure 7) nor are these variations in the height-to-width ratio easily explained. For example, the lower values for the height-to-width ratio in areas just outside the dried salt lake’s rim are predominantly negative for which a geometric interpretation is unclear.
Figure 7. NCAS Landsat derived NDVI at a nominal 25 m spatial resolution showing the region around the salt lake in the centre of Figure 6.
To assist analysis, the results may be compared with an independent dataset. A good dataset for comparison purposes is the National Carbon Accounting System (NCAS dataset based on Landsat mosaics. The NCAS Landsat pixels have a nominal spatial resolution of 25m. The higher spatial resolution of the Landsat sensor and validations done in support of this dataset should enable NDVI derived from it better able to detect low vegetation densities than MODIS based imagery. Furthermore, the NCAS Landsat mosaics represent a benchmark standard for comparison purposes, i.e. the NCAS Landsat NDVI may be considered a best available dataset. The NCAS Landsat mosaics are distributed through Geoscience Australia and more details of the product can be found on their web site (www.ga.gov.au).
The study area is covered by the SH54 North West tile from the NCAS Landsat mosaic. The 2005 tile was created with Landsat images acquired in the period between 24/1/2005 and 22/3/2005. The relatively short time period over which Landsat images were acquired should minimise temporal variations in the resulting mosaic and better enable comparison with MODIS data that has been acquired for an epoch within this date range.
The processing strategy has been to create a single NDVI layer from the NCAS Landsat mosaic tile, extract pixels within a region of interest bounded by the geographical (Lat/Long) co-ordinates of the study area, and finally upscale the spatial resolution of NCAS Landsat pixels to be equivalent to the larger
MODIS pixels. This last step was done by calculating the arithmetic means of NCAS Landsat pixels that spatially lie within respective MODIS pixels.
Figure 8. For the study area, MODIS NBAR NDVI (grey) and NCAS Landsat NDVI (green), having been processed as discussed. Darker areas represent lower NDVI responses and lighter area higher NDVI responses.
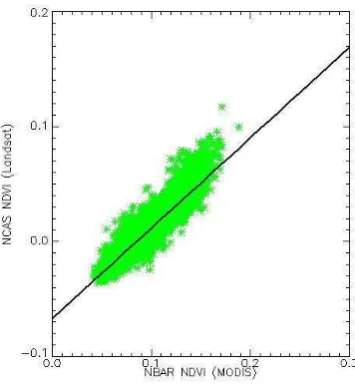
Figure 9. NCAS Landsat NDVI (y-axis) is plotted against MODIS NBAR NDVI (x-axis) for the study area. A line of best fit between the two variables is also plotted.
As expected, Figure 8 shows pictorially and Figure 9 show graphically strong correlation between NCAS Landsat NDVI and MODIS NBAR NDVI. The correlation coefficient between the NCAS Landsat NDVI and MODIS NBAR NDVI is 0.93.
Figure 10. The residuals from the line of best fit in Figure 7 (y-axis) plotted against height-to-width ratio (x-(y-axis) for pixels within the study area. A line of best fit between the residuals and the derived height-to-width ratio is also included in the plot.
4. DISCUSSION
Figure 10 indicated that the residuals are not random with respect to the derived height-to-width ratio. Whilst the relationship between the residuals and the height-to-width ratio is not strong (0.31 correlation coefficient), consistent results were achieved for other MODIS epochs within the date range used in deriving the NCAS Landsat mosaic. The relationship between the residuals and the height-to-width ratio indicates that the height-to-width ratio is able to detect small variations in vegetation that are not apparent in the MODIS reflectance data alone. Furthermore, the height-to-width ratio when combined with reflectance data may improve the accuracy of NDVI derived from lower resolution sensors. Modest improvements in the correlation between NCAS Landsat NDVI and MODIS NBAR NDVI are achievable when the height-to-width ratio is included in a linear regression model, i.e. increased correlation from 0.93 to 0.94. Given the already high correlation between the two datasets, temporal and radiometric difference between sensors and the nature of the additional parameter (i.e. adding a consideration related to the height of vegetation), only a small increase in the correlation should be realistically expected.
An interpretation for this variation in the height-to-width ratio shown in Figure 6 is that the result is highlighting an artefact in the MODIS BRDF modelling. The MODIS BRDF modelling utilises successive observations of a pixel for the determination of RossThickLiSparse parameter weights. The footprint location on the ground represented by a pixel may nominally vary up to +/- 250m as a normal consequence of satellite flight path and altitude variations. Furthermore, for sensors with a wide field of view such as MODIS, the footprint size grows significantly towards the edge of the swath (Lucht et al., 2000). In determination of the MODIS BRDF model parameter weights for pixels on the inside rim of a dried salt lake, if observations used in the determination of the MODIS BRDF
model happen include within their footprint some area having a higher NDVI response from outside of the dried salt lake, the MODIS BRDF model will attribute the higher NDVI response to angular effects. This will tend to result in larger BRDF effects for pixels on the inside rim of the dried salt lake. The model described in the paper will interpret larger BRDF effects as larger height-to-width ratio as shown by the brighter areas in Figure 6. The inverse will occur for pixels just outside the area of the dried salt lake, and the model described in this paper will interpret these BRDF effects as negative height-to-width ratios and appear as darker areas in Figure 6. Consideration of this issue has been identified as a possible source of error in MODIS BRDF algorithm although the effects not well explored (Lucht et al., 2000).
Overall, BRDF effects caused in this manner over large areas may be expected to cancel out or appear as noise. However for vegetated features defined by their NDVI response that are both spatially extensive (significantly larger than a MODIS 500-m pixel) and have sharply defined boundaries (significantly smaller than a MODIS 500-m pixel), the height-to-width ratio will show variability at the boundary of such features as a consequence of this effect. Whilst reflectance data will better identify feature boundaries, this interpretation may explain a source of noise in the MODIS BRDF model and also noise in the height-to-width ratio derived in this paper for interpreting BRDF effects.
5. CONCLUSION
The height-to-width ratio appears to be able to detect the presence of low vegetation cover that may otherwise only be apparent when viewed obliquely or with higher resolution sensors. The height-to-width ratio may be used to enhance MODIS NBAR NDVI to provide a better fit with NCAS Landsat NDVI.
Further development is needed to remove noise in BRDF effects as discussed in section 4. Also the height-to-width ratio results should be compared and validated with a dataset that specifically represents vegetation structure, for example, the Interim Biographic Regionalisation of Australia (IBRA) dataset.
6. REFERENCES
GAO, F., SCHAAF, C. B., STRAHLER, A. H., JIN, Y. & LI, X. 2003. Detecting vegetation structure using kernel based BRDF model. Remote Sensing of Environment,
86, 198 - 205.
GRANT, I. F. 2000. Investigation of the Variability of the Directional Reflectance of Australian Land Cover Types. Remote Sensing Reviews, 19, 243 - 258. HILL, J. M., AVERILL, C., JIAO, Z., SCHAAF, C. B. &
ARMSTON, J. D. 2008. Relationship of MISR RPV parameters and MODIS BRDF shape indicators to surface vegetation patterns in an Australian tropical savanna. Canadian Journal of Remote Sensing, 34, S247 - S267.
HUETE, A. 1987. Soil and Sun angle interactions on partial conopy spectra. International Journal of Remote Sensing, 8, 1307 - 1317.
LI, F., JUPP, D., REDDY, S., LYMBURNER, L., MUELLER, N., TAN, P. & ISLAM, A. 2010. An Evaluation of the Use of Atmospheric and BRDF Correction to Standardise Landsat Data. IEEE Journal of Selected Topics in Applied Earth Observations and Remote Sensing, 3, 257 - 270.
LOVELL, J. L. & GRAETZ, R. D. 2001. Analysis of POLDER-ADEOS data for the Australian continent: the relationship between BRDF and vegetation structure.
International Journal of Remote Sensing, 23, 2767 - 2796.
LUCHT, W. & LEWIS, P. 2000. Theoretical noise sensitivity of BRDF and albedo retrieval from the EOS-MODIS and MISR sensors with respect to angular sampling.
International Journal of Remote Sensing, 21, 81-98. LUCHT, W., SCHAAF, C. B. & STRAHLER, A. H. 2000.
Algorithm for the Retrieval of Albedo from Space Using Semiempirical BRDF Models. IEEE Transactions on Geoscience and Remote Sensing, 38, 977 - 998.
PAGET, M. & KING, E. 2008. MODIS Land Products for Australia CSIRO Marine and Atmpospheric Research Internal Report No. 004, CSIRO Marine and Atmospheric Research Canberra, Australia. ISBN 978192142342 (pdf) [Online]. Available: https://rs.nci.org.au/lpdaac/ [Accessed].
ROUJEAN, J.-L., LEROY, M. & DESCHAMPS, P.-Y. 1992. A Bidirectional Reflectance Model of the Earth's Surface for the Correction of Remote Sensing Data. PRIVETTE, J. L. & ROY, D. 2002. First operational BRDF, albedo nadir reflectance products from MODIS. Remote Sensing of Environment, 83, 135-148.
TIAN, Y., ROMANOV, P., YU, Y., XU, H. & TARPLEY, D. 2010. Analysis of Vegetation Index NDVI Anisotropy to Improve the Accuracy of the GS-R Green Vegetation Fraction Product. Conference Paper. WANNER, W., STRAHLER, A. H., HU, B., LEWIS, P.,
MULLER, J.-P., X, L., BARKER SCHAAF, C. L. & BARNSLEY, M. 1997. Global retrieval of birdirectional reflectance and albedo over land from EOS MODIS and MISR data: Theory and algorithm.
Journal of Geophysical Research, 102, 17,143 - 17,161.