INTEGRATING EFFECTIVE DROUGHT INDEX (EDI) AND REMOTE SENSING
DERIVED PARAMETERS FOR AGRICULTURAL DROUGHT ASSESSMENT AND
PREDICTION IN BUNDELKHAND REGION OF INDIA
Suman Kumar Padhee a,*, Bhaskar R. Nikamb, S. P. Aggarwalc, Vaibhav Gargb
a
Water Resources Department, M. Tech. Student, Indian Institute of Remote Sensing, ISRO, Dehradun - [email protected] bWater Resources Department, Scientist/Engineer „SD‟, Indian Institute of Remote Sensing, ISRO, Dehradun –
(bhaskarnikam, vaibav)@iirs.gov.in
cWater Resources Department, Scientist/Engineer „SF‟ & Head, Indian Institute of Remote Sensing, ISRO, Dehradun - [email protected]
KEY WORDS: Agricultural Drought, Remote Sensing, Soil moisture, Effective Drought Index, Triangle Method
ABSTRACT:
Drought is an extreme condition due to moisture deficiency and has adverse effect on society. Agricultural drought occurs when restraining soil moisture produces serious crop stress and affects the crop productivity. The soil moisture regime of rain-fed agriculture and irrigated agriculture behaves differently on both temporal and spatial scale, which means the impact of meteorologically and/or hydrological induced agriculture drought will be different in rain-fed and irrigated areas. However, there is a lack of agricultural drought assessment system in Indian conditions, which considers irrigated and rain-fed agriculture spheres as separate entities. On the other hand recent advancements in the field of earth observation through different satellite based remote sensing have provided researchers a continuous monitoring of soil moisture, land surface temperature and vegetation indices at global scale, which can aid in agricultural drought assessment/monitoring. Keeping this in mind, the present study has been envisaged with the objective to develop agricultural drought assessment and prediction technique by spatially and temporally assimilating effective drought index (EDI) with remote sensing derived parameters. The proposed technique takes in to account the difference in response of rain-fed and irrigated agricultural system towards agricultural drought in the Bundelkhand region (The study area).
The key idea was to achieve the goal by utilizing the integrated scenarios from meteorological observations and soil moisture distribution. EDI condition maps were prepared from daily precipitation data recorded by Indian Meteorological Department (IMD), distributed within the study area. With the aid of frequent MODIS products viz. vegetation indices (VIs), and land surface temperature (LST), the coarse resolution soil moisture product from European Space Agency (ESA) were downscaled using linking model based on Triangle method to a finer resolution soil moisture product. EDI and spatially downscaled soil moisture products were later used with MODIS 16 days NDVI product as key elements to assess and predict agricultural drought in irrigated and rain-fed agricultural systems in Bundelkhand region of India. Meteorological drought, soil moisture deficiency and NDVI degradation were inhabited for each and every pixel of the image in GIS environment, for agricultural impact assessment at a 16 day temporal scale for Rabi seasons (October – April) between years 2000 to 2009. Based on the statistical analysis, good correlations were found among the parameters EDI and soil moisture anomaly; NDVI anomaly and soil moisture anomaly lagged to 16 days and these results were exploited for the development of a linear prediction model. The predictive capability of the developed model was validated on the basis of spatial distribution of predicted NDVI which was compared with MODIS NDVI product in the beginning of preceding Rabi season (Oct – Dec of 2010).The predictions of the model were based on future meteorological data (year 2010) and were found to be yielding good results. The developed model have good predictive capability based on future meteorological data (rainfall data) availability, which enhances its utility in analyzing future Agricultural conditions if meteorological data is available.
1. INTRODUCTION
1.1 General Introduction
Drought is a phenomenon having slow onset, progress and ending. The impact of drought could create vegetation stress leading to serious damages which is well shown by Breshears et al. (2005). For decades, it has always been a challenge for the decision makers to monitor the arrival and growth of drought and identify its end. Although the drought events are initiated by the deficit in precipitation, simply rainfall as an indicator for assessing severity of drought and its resultant impacts is insufficient. Combination of various reasonable indicators must be included with regular observation for an effective drought assessment system to examine both drought severity and its consequences.
1.2 Agricultural and Meteorological Drought
supply scheme in addition to meteorological contribution fails to meet the crop water requirement.
1.3 Drought Index
Drought indices are developed for decision making in response to drought. It quantifies of severity of a drought event at scales of watershed, region, province, nation, or globe. The drought indices are classified according to the input data requirement, application purpose, or both such as meteorological, hydrological, agricultural and/or remote sensing data derived drought index.
Meteorological events in sense of rainfall could act as practical indicator for agricultural drought occurrence. The “Rainfall Anomaly Index” (RAI), (Rooy, 1965) was one the most popular and basic Meteorological drought index in earlier days. Being dependent on long term meteorological rainfall observations completely, the RAI displays the relation between a regional humidity index and the Van Rooy actual evaluation of dry periods during the rainy seasons. The demerit of using the observations from only rainfall overcomes its simplicity in estimation. The “Palmer Drought Severity Index” (PDSI) (Palmer, 1965) was developed for Meteorological drought assessment using precipitation, evapotranspiration and soil moisture conditions as the key inputs. It is based on hydrological accounting and a number of assumptions which are either empirically developed or location specific. It uses the supply and demand concept of water balance and also includes evapotranspiration in the concept for calculation. The PDSI is efficient in addressing the intensity of drought and its onset and offset time, which most of drought indices lack. However, its complicated computation process and long term observations requirement of multiple parameters makes it usable at only limited regions. It has some other limitations too, due to which, the conventional time series models may not be able to capture the stochastic properties of PDSI (Alley, W.M., 1984).
The PDSI even being one of the most used drought indices in conditions of US, still lags in the property definition of small time scale. The need of a drought index for global standards led to the development of “Standardized Precipitation Index” (SPI) (McKee, 1995) with characteristic of a variety of time scale flexibility. It is a potential Meteorological drought index which is easily calculable, requires modest data, independent of the magnitude of mean rainfall and comparable over a range of climatic zones (Agnew, 2000). Guttman (1997) explained the advantages of SPI being probabilistic in nature and thus, its usability in risk and decision analysis over other drought indices. The identification of extreme drought with SPI presents a better spatial standardization as compared to the PDSI (Hughes and Saunders, 2002). The use of SPI is standardized to a variety of time scales i.e. 1, 2, 3, 6, 12, 24, 26, 48 months. It overpowers the traditional drought indices as it can be applied for any location at small time scales, and it makes SPI a suitable indicator accepted around the world. The positive value of SPI represents wet conditions whereas the negative values show drought conditions. The intensity of drought is signified by the standardized numbers ranging from 0 to (-2 and less). The SPI have also a constraint of minimum time scale of 1 month. Enormous studies had been carried out for the development of a Meteorological drought index, which can overcome the limits of the most widely known Meteorological drought index ever i.e. SPI. The
“Effective Drought Index” (EDI) (Byun and Wilhite, 1999) can overcome to the limitations of SPI. An innovative concept of effective precipitation is incorporated for the computation of EDI. The effective precipitation is the accumulation of the parts of precipitation of the certain days before estimation time, which affects the available water resources at the estimation time (e.g., rainfall of 3 days prior to present day can affect soil moisture of present day). This different perception is based over certain limitations that most of the drought indices display. Firstly, most of the indices are not accurate in detection of arrival and end of the drought and its accumulated stress. Secondly, the time scale for even some of the very advanced drought indices is limited up to one month step, which restricts their usefulness in monitoring ongoing drought. Finally, the majority of them are incapable of differentiating the effects of drought on subsurface and surface water supply.
In a comparative study between EDI and SPI, the EDI was found to be better than SPI in detecting long term, extremely long term and short term drought, short term rainfall and also dealing with the problem of over estimation and under estimation (Byun and Kim, 2010). Morid et al.(2006) compared seven Meteorological drought indices in Iran out of which EDI was found to be capable of perceiving the forecasting Meteorological drought index. The assessments by EDI have been found closer to accuracy and its predictions carry less error than that of other meteorological indices. Thus, EDI is a reliable meteorological drought index.
1.4 Remote Sensing and GIS for Agricultural Drought Studies
The remote sensing community have defined drought specifically as a period of abnormal dry weather, which affects the vegetation cover (Heim, 2002). Drought is one of the most dominant causes for crop loss (Wilhite, 2002). The requirement of drought assessment system dedicated towards agricultural drought assessment led to development of numerous approaches with explicit characteristics. They included traditional solutions based on the theories of meteorological factors. The traditional approaches for drought monitoring that uses ground-based data are laborious, difficult and time consuming (Prasad et al., 2007).
Meanwhile, biosphere measurements by satellite sensors have emerged with importance in various aspects including the drought studies. Remote sensing and GIS technologies are better than traditional techniques in terms of spatial dynamics and coverage area.
2004). Similar approaches have been used in forming drought monitoring, assessment and prediction systems around the globe. The NDVI is a simple, yet an effective remote sensing derived index for agricultural drought studies.
1.4.2 Satellite Sensors for Agricultural Drought Studies: Several innovative approaches have been developed to extract information from past and real time remote sensing data for the purpose of drought studies. This remark was achieved first, after the launch of AVHRR, on June 27, 1979 onboard obtained from National Oceanic and Atmospheric Administration (NOAA). The most successful RS data regarding agricultural drought studies is AVHRR NDVI which is used as primary data for input to generate vegetation specific drought information product called as (Vegetation Drought Response Index) VegDRI (Brown et al., 2002 & 2008). NASA‟s Terra and Aqua Moderate-Resolution Imaging Spectroradiometer (MODIS) presents a generational advancement over AVHRR. MODIS products are available since 1999 provides data with improved sensitivity to vegetation than AVHRR. The narrower spectral bandwidths in MODIS for the red band and NIR band, which have increased sensitivity towards chlorophyll and water vapour absorption respectively, makes it more efficient for thematic applications (Huete et al., 2002). The spatial resolution of NDVI offered by MODIS is at 200m, 500 m and 1000m. Ozdogan and Gutman (2008); Thenkabail et al. (2009); Dheeravath et al. (2010) illustrated the valuable use of MODIS NDVI for identification of the mapping of irrigated agricultural areas. Son et al. (2012) illustrated the use of monthly MODIS normalized difference vegetation index (NDVI) and land surface temperature (LST) data to monitor Agricultural drought along with integration to precipitation product estimated by remote sensing.
However, sole remote sensing derived agricultural drought assessment systems are unproductive concerning to accurate results. Tadesse et al. (2005) integrated AVHRR NDVI 14 day dataset along with Meteorological drought indices from climate data and some biophysical parameters like land cover, eco-regions etc. to predict drought related vegetation stress over U.S. Central Plains. Integration with other fields like ground-based climate, hydrological, biophysical and surface datasets enhances not only the accuracy in severity quantification, but also the spatial distribution quality.
1.5 Soil Moisture in Agricultural Drought Studies
Soil moisture monitoring is generally a superior executive mean for agricultural drought assessment than precipitation (www.fao.org). In India, rain-fed agriculture dominates over irrigated agricultural systems, due to which precipitation is considered as the indicator for agricultural drought. But only precipitation cannot serve as reliable indicator for assessment of agricultural drought because of variability in water supply modes (Irrigation from canal, ground water, storage tank, rainfall harvested and rain-fed water). Only rain-fed agricultural practices have a strong relationship between rainfall amount and soil moisture. Contrastingly, frequent water supply makes agricultural areas under irrigation to face less chance of agricultural drought and that too irrespective of rainfall. Hence, agricultural drought occurrence can be explained by soil moisture condition at different areas following different water supply.
The parameter, soil moisture impacts other parameters like soil temperature, evaporation, water available for plants, biological activities and soil compaction. The soil chemical, physical, and biological properties are directly or indirectly affected by soil moisture and thus the agriculture for which, it is remarked as an important agricultural drought indicator.
New and improved methods of remote sensing have tremendously increased such as passive and active microwave remote sensing which can measure soil moisture. It works at a wavelength range from a few millimeters to several meters. It is highly sensitive to the moisture content. Microwaves have the capability to penetrate by clouds and into the ground, so it can operate in all weather conditions and regions. It can provide us the possibility of obtaining frequent, global sampling of soil moisture over a large fraction of the Earth's land surface. So, it has the potential to be used in agricultural drought assessment. There are several mission/projects running globally which provides products derived from microwave remote sensing. The greater contribution in soil moisture mapping is shared by passive over active microwave remote sensing due to its global coverage and high temporal resolution. But the passive microwave data cannot directly contribute in agricultural drought assessment/monitoring due to the limitation of spatial resolution ranging from 25 – 100 km.
1.6 Spatial Downscaling of Remote Sensing Soil Moisture Products
2. MATERIALS AND METHODS
2.1 Study Area
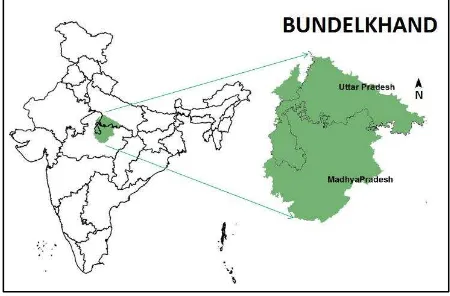
The Bundelkhand region of India was selected as the study area for this research project. This region comprises of 13 districts; 7 districts from southern parts of Uttar Pradesh (UP) namely (Jhansi, Jalaun, Lalitpur, Hamirpur, Mahoba, Banda and Chitrakoot) and 8 districts from northern parts of Madhya Pradesh (MP) namely (Datia, Tikamgarh, Chattarpur, Damoh, Sagar and Panna). The total geographical area of the study area is approximately 29418 km2 which extends from 23°10‟N to 26°27‟N in Latitude and 78°40‟E to 81°34‟E in Longitude (Figure 1).
Figure 1. Bundelkhand region, India
The range of altitude in the study area varies from 600 m above the mean sea level in the southern parts to 150 m near above the mean sea level in the northern parts near the Yamuna River. The climate of the Bundelkhand region is semi-arid. This region falls under two important Agro-Ecological systems; Northern Plains in the northern and upper central Bundelkhand; Central Highlands (Malwa and Bundelkhand) in lower central and southern Bundelkhand. The two major agro-climatic zones are shown in Figure 2 (a).
The minimum temperature varies from 6°C to 12°C and the maximum temperature variation is from 38°C to 48°C. Bundelkhand gets a moderate annual rainfall, fluctuating from 750 mm in the north-western parts, to 1250 mm in the south-eastern parts. However rain is an inconsistent; an inundation is generally trailed by stretched period of no rain. The occurrence of rainfall events over this region is twice in a year due to which two major agricultural seasons namely Kharif and Rabi exist. The major rainfall events show during the month of July to end of the month of September because of Monsoon from east. These events contribute around 90% of total rainfall in the region and support the entire Kharif season for the maturity of Kharif crops as well as the sowing of Rabi crops. The minor rainfall events appear during the month of January and February down to Western disturbances. The occurrence of these trivial events is important for the Rabi season as the agriculture of a large part in the Bundelkhand region depends on it. The Rabi sowing (69%) leads over Kharif (31%) in Bundelkhand region conflicting to other agro-ecologies, which is an irony regarding to Indian agricultural system (NRAA, 2008, 2011).
A total of 51% and 43% of geographical area of Bundelkhand region is under cultivation in UP and MP respectively. Most of the agricultural areas of the
Bundelkhand in UP are under irrigated water supply whereas the maximum agriculture in MP is dependent upon rain-fed practice. Larger part of the agriculture in Bundelkhand region is rain-fed as compared to irrigated practice. The combined population of Bundelkhand region from UP and MP is approximately 50 million out of which 80% population rely on agriculture. The agriculture dependent population includes marginal, small, medium and large farmers whose 96% income is earned by crop and livestock enterprise. The agricultural water supply systems of Bundelkhand from are shown in Figure 2 (b) respectively.
Figure 2. (a) Agro-climatic zones of Bundelkhand region and (b) Agricultural water supply followed in Bundelkhand
region.
2.2 Data Description
2.2.1 Satellite Data: The data from satellite remote sensing used for the study were as follows.
(a) MODIS products: The MODIS data used for this work are the MODIS/Terra daytime 8-day Land Surface Temperature (LST) composite of 1 km resolution (MOD13A1) and MODIS/Terra 16-day NDVI product of 1 km resolution (MOD13A2). The NDVI composite is free from cloud, while the LST composite is not. These products were used for the time period from year 2000 to 2010. The MODIS products are freely distributed by the U.S. Land Processes Distributed Active Archive Center (http://lpdaac.usgs.gov) or USGS Global Visualization Viewer (http://glovis.usgs.gov).
(b) ESA CCI global soil moisture: The global soil moisture data from (European Space Agency) ESA‟s Climate Change Initiative (CCI) program, which is generated using active and passive microwave space borne instruments for 32 years (1978 to 2010), was used for this study. The passive data is generated by the VU University Amsterdam in coalition with NASA by the passive microwave observations from Nimbus 7 SMMR, DMSP SSM/I, TRMM TMI and Aqua AMSR-E. The soil moisture of the Bundelkhand region was clipped out of global coverage from year 2000 to 2010. The global soil moisture is freely distributed by ESA at website (http://www.esa-soilmoisture-cci.org/).
with other remote sensing data was requirement of this study, due to which daily rainfall data was chosen.
2.2.3 Ancillary Data: Command area map was obtained from India Water Resources Information System (India WRIS) an Indian Space Research Organization (ISRO) initiative. Also the agro-climatic zone map was acquired from (NBSS&LUP). The administrative boundary map was procured from Survey of India (SOI). All these ancillary data were extracted out for the Bundelkhand region for utilization as informative layers.
2.3 Methodology
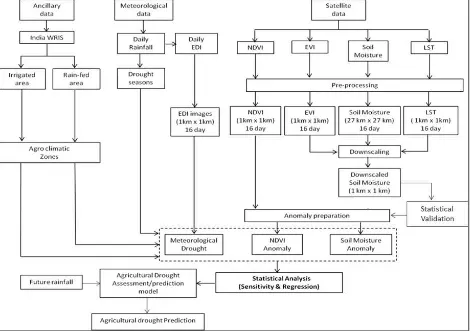
The entire methodology includes four parts. The first part is preparation of rainfall distribution images for the study area; preparation of the Meteorological drought condition images out of them and identification of drought effected Rabi seasons within the study period. The second part is pre-processing in which all the datasets from remote sensing being used in this study are brought to a common platform in terms of temporal extent. It is followed by the third part that includes spatial downscaling of soil moisture from low to high spatial resolution and the sensitivity analysis of meteorological and remote sensing derived parameters. The sensitivity analysis has been done with the anomalies prepared for the RS data, which are probable to be sensitive with Meteorological drought indicator. This has been accomplished for irrigated and rain-fed areas separately to create an effective Agricultural drought assessment model for the region.
The final part of the methodology involves the assessment and prediction of the Agricultural drought in the region by incorporating future climatic parameter. The schematic flow diagram of the methodology followed is shown in Figure 3.
2.3.1 Rainfall Distribution and Meteorological Drought Condition: The rain station point layers with rainfall observations in mm, at each point (station) were prepared from the IMD data. It was used as basic input for preparation of required meteorological datasets.
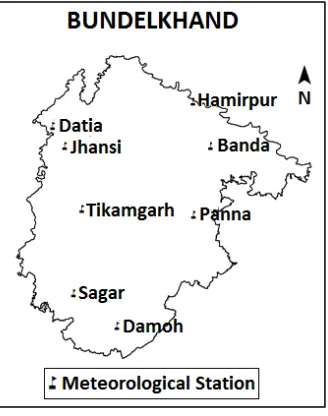
(a) Rainfall distribution maps: Inverse Distance Weighted (IDW) interpolation technique was used to generate daily rainfall distribution maps (raster format, 1 km spatial resolution) using all points in the study area. The reason for selecting IDW technique for interpolation is that, it distributes the value in cells with an assumption that things that are more close to one another are alike than those that are farther apart. However, a station with the existence of data gaps was excluded in the interpolation for those periods. Figure 4 shows the rain station map prepared from the information of meteorological station‟s location, which is used to interpolate the rainfall distribution images.
(b) Meteorological drought condition maps: The Effective drought index (EDI) (Byun and Wilhite, 1999) was selected as the Meteorological drought condition indicator, because of the advantage of well-suited flexibility to daily time scale. The EDI was calculated for each day from year 1975 to 2010. It is assumed in this research that, rainfall even three days prior have a lasting effect on the soil moisture of an existing day. The following equations were used to calculate EDI:
Figure 4. Rain station map, Bundelkhand
EP3 =∑ ∑ /n] (1)
DEP3 = EP3– MEP3 (2)
EDI3 = DEP3 / SD(DEP3) (3)
where, EP3 is effective precipitation of a particular day accumulated for three days, Pm is the precipitation for a day m days prior to a specific day, DEP3 is deviation of EP3 from the mean of EP3 i.e. (MEP3), and was calculated for each calendar date, in present case the mean value is estimated using 36 years of data, EDI3 is the Effective drought index value and SD (DEP3) is the standard deviation of DEP3 in 36 years range (1975 – 2010).
2.3.2 Pre-processing: The datasets used for the study were incompatible with each other due to difference in their spatial properties and temporal scale. The aim of pre-processing was to get all the datasets to a common time scale and a common projection & coordinate system for a study period.
(a) Selection of the study period: The study period was selected as Rabi agricultural seasons of year (2000 – 2001) to (2009 – 2010) because of the following reasons:
i. The agricultural production of Bundelkhand region in Rabi season dominates to that of Kharif season (NRAA, 2011).
ii. The cloud cover over the study area in Kharif season made it difficult to get continuous remote sensing data, whereas Rabi season was mostly cloud free.
(b) Temporal scaling and reference system: The highest time scale among the datasets was for MODIS NDVI composite i.e. 16 days. Therefore, 16 days was decided as the base time scale for temporal scaling. The 16 days‟ time scales in terms of Julian days for which processing and analysis were done are as follows: (273 – 288), (289 – 304), (305 – 320), (321 – 336), (337 – 352), (353 – 365), (1 – 16), (17 – 32), (33 – 48), (49 – 64), (65 – 80), (81 – 96), (97 – 112) and (113 – 127). Composites of 16 days were derived
for other datasets (viz. LST, soil moisture, and EDI). The EDI condition for the base time scale was calculated as the average of 16 days EDI conditions.
The MODIS datasets and ESA CCI soil moisture were having their coordinate systems as (UTM, Sinusoidal) and (Geographic Lat-Lon, WGS 1984) respectively and spatial resolution of 1km and 0.25 decimal degrees respectively. Therefore, they were brought to a common projection & coordinate system i.e. (UTM, WGS 1984) with the linear unit in „m‟. While modifying the spatial reference of datasets, the pixel values were maintained in order to keep it undisturbed for further analysis.
To convert the soil moisture data with a course resolution of pixel size (0.25 decimal degrees ≈ 27750 km) to a product with fine resolution of pixel size 1 km, spatial downscaling was necessary.
2.3.3 Spatial Downscaling of Course Resolution Soil Moisture: The Linking model based on Triangle method was used in the study. It has a statistical approach over the spatial extent. According to Carlson, (1994), the theoretical Triangle plot from VI vs. LST defines soil moisture dependency on VI and LST. So, to predict the downscaled soil moisture, a second order multivariate polynomial regression model was derived with soil moisture as dependent variable and EVI* & LST* as independent variables over the spatial domain.
The EVI* map is derived from the parameter, Enhanced Vegetation Index (EVI) which is available with the MODIS NDVI product. EVI is selected in the Linking model over NDVI because of less soil background interference in EVI (Huete et al., 2002). Similarly, LST* map is derived from Land Surface Temperature. The equations to find LST* and EVI* are in equations (4) and (5) respectively. The purpose of LST* and EVI* maps were to standardize the values of LST and EVI maps from 0 to 1.
(4)
(5)
where, EVI is Enhanced vegetation index, LST is Land surface temperature, the subscript max and min represents the maximum and minimum parameter value over the spatial extent respectively.
Sufficient observations for EVI*, LST*, and course resolution soil moisture value at same geographic location were extracted. These observations were used for the second order polynomial regression generating a regression equation as in equation (6).
SMcoarse =∑ ∑ (6)
where, SMcoarse is the coarse resolution soil moisture, aij represents the set of coefficients from the second order polynomial regression. Equation (6) generates a set of coefficients (aij) which were used in Equation (7) to predict the downscaled soil moisture values.
where, SMfine is the fine resolution soil moisture at the same location as that of SMcoarse. This process was followed for each and every pixel of either EVI* or LST* at a spatial resolution of 1 km.
2.3.4 Statistical Validation of Downscaled Soil Moisture: It was important to validate the downscaled soil moisture product before utilization. Therefore, the Root Mean Square Error (RMSE) of downscaled soil moisture image was checked against coarse resolution soil moisture.
Also, the change in spatial variability of soil moisture in downscaled product was compared to that of coarse resolution soil moisture. The purpose was to check the degradation occurred in soil moisture while distribution was done by downscaling. It was done by comparing the spatial average of soil moisture values at randomly selected areas common for both the course resolution and downscaled soil moisture.
2.3.5 Sensitivity Analysis: It is essential to understand the parameters on which occurrence of agricultural drought and its magnitude are dependent. Since, moisture status of soil depends on many factors along with the rainfall, healthy vegetation is dependent on soil moisture; soil moisture, rainfall and vegetation share mutual relationships. In this study, the vegetation index was considered as indicator of agricultural drought (occurrence or existence). The underlying assumption here was that the negative deviation in vegetation index values in the drought affected areas is because of water shortage to the crops only. Hence, to test this assumption the sensitivity analysis between Meteorological drought index, soil moisture and vegetation index was formatted for the study area. Since the drought is the main objective of this study, to avoid the voluminous data analysis, the sensitivity analysis of the anomalies of all the parameters mentioned above was done instead of the real data.
(a) Anomaly preparation: Anomaly means percentage deviation of the value of a parameter (soil moisture or vegetation index) from its long term mean. The anomaly maps for 16 day composites of soil moisture and NDVI were made by the equation (8).
Xa = [(X16 - Xm)/ Xm] ×100 (8)
where, Xa is the anomaly of a 16 day composite image, X16 is the 16 days composite image, Xm is the long term mean of the 16 day time step for which the anomaly is being derived.
Statistical analysis was carried out in combination between remote sensing derived parameters (NDVI anomaly, soil moisture anomaly) and meteorological drought indicator (EDI) to find out the sensitivity to each other.
(b) Statistical analysis: The sensitivity of soil moisture anomaly and NDVI anomaly with EDI and sensitivity of NDVI anomaly with soil moisture anomaly was analyzed using statistical measures (correlation coefficient). This was done to utilize the behavior of these parameters, which could help in developing agricultural drought assessment model. To find the best assessment and prediction result possible, the remote sensing derived parameters were correlated to the EDI having a no lag, 16 days lag and 32 days lag. Various ground studies have revealed soil moisture as a better parameter than meteorological measures, to be related to
preceding vegetation conditions (www.fao.org/). Therefore, effort was made for developing relationship between soil moisture anomaly and NDVI anomaly.
It is well known that the deficiency in soil moisture is not very frequent in irrigated agriculture. But, some parts of irrigated agriculture are supposed to behave like going through arid conditions. It is because these regions might not be frequently irrigated even being within the command area. Such regions are prone to be victimized by agricultural drought. However, the rain-fed areas rely on rainfall and experience aridity during deficient rainfall. Therefore, it is quite essential to test the sensitivity of all the parameters in irrigated and rain-fed areas as distinct domains. Hence, the sensitivity analysis for irrigated and rain-fed areas was done separately. Additional criterion of varying agro-climatic zones was also added because of the vastness of study area and different crop practice according to rainfall pattern in each zone.
2.3.6 Agricultural Drought Prediction and its Validation: The relationships between Meteorological drought index and soil moisture anomaly; soil moisture anomaly and vegetation anomaly were used to make a model having capability of assessing impact of meteorological drought condition on agricultural drought. This model was separate for irrigated and rain-fed areas of different the agro-climatic zones The agricultural drought assessment/prediction capability of this model is tested using rainfall data for the year (2010 – 2011) onset of Rabi as the only input for the study area. The accuracy of Agricultural drought and vegetation condition prediction was been assessed using satellite observed vegetation index.
3. RESULTS AND DISCUSSION
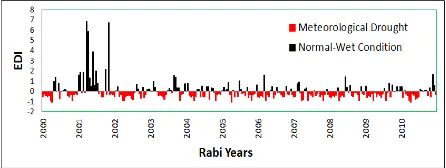
3.1 EDI in Bundelkhand
Frequent occurrence of mild to severe meteorological drought conditions over Bundelkhand region with a consistency in negative values in Rabi seasons of years (2000 – 2001) to (2009 – 2010) were revealed (Figure 5).
Figure 5. Variability of EDI in Bundelkhand in Rabi seasons of years (2000 – 2001) to (2009 – 2010).
3.2 Spatial Downscaling by Linking Model based on Triangle method
The satellite soil moisture data used for the current study was having very coarse spatial resolution which needed disaggregation.
3.2.1 Spatial Downscaling of Soil Moisture
km for the study area in time period October – April of (2000 – 2001) to (2009 – 2010). The basic inputs of downscaling model (Linking model based on Triangle method) are EVI, LST and soil moisture (Figure 6 (a), (b), and (c) and its output is downscaled soil moisture (Figure 6 (d)).
Figure 6. (a) Enhanced Vegetation Index, (b) Land Surface Temperature, (c) Course Resolution Soil Moisture, (d)Downscaled Soil Moisture, Bundelkhand region (day 337
– 355, year 2009)
3.2.2 Statistical Validation of Downscaled Soil Moisture:
(a) RMSE of Downscaled Soil Moisture: Figure 7 shows the RMSE between coarse resolution soil moisture and downscaled soil moisture values for Rabi seasons of year (2000 – 2001) to (2009 – 2010). The downscaled soil moisture contains predicted values, based on the finer resolution of LST and EVI of the study area. The RMSE never exceeded 0.05 (m3/m3) from which it was deduced that, the use of downscaled soil moisture is acceptable.
Figure 7. RMSE between coarse resolution soil moisture and downscaled soil moisture values for Rabi seasons of year
(2000 – 2001) to (2009 – 2010).
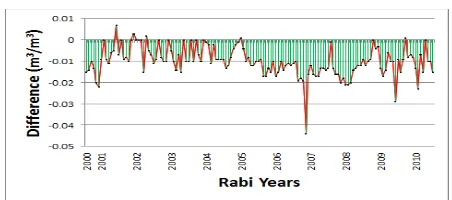
(b) Spatial variability of downscaled soil moisture: The random patches selected for testing spatial variability of downscaled soil moisture is shown in Figure 8. The observations from testing of spatial variability infer that, the difference between spatial average of downscaled and satellite soil moisture never exceeded ±0.05 (m3/m3) with a greater part as slightly under predicted (Figure 9). Therefore, it can be said that the soil moisture variability have changed within the acceptable level.
Figure 8. The random patches selected for testing spatial variability of downscaled soil moisture
Figure 9. Difference between spatial average of downscaled and satellite soil moisture.
3.2.3 Sensitivity Analysis: Since, majority of the area of Northern Plains is covered by irrigated system; agricultural drought for this agro-climatic zone is estimated on the basis of irrigated system. Similarly, the Central Highlands is assessed for rain-fed type agriculture. Sensitivity analysis includes the analysis of relationship between meteorological parameters (EDI), soil moisture anomaly, vegetation health indicators (NDVI anomaly) in Rabi seasons (2000 – 2001 to 2009 – 2010).
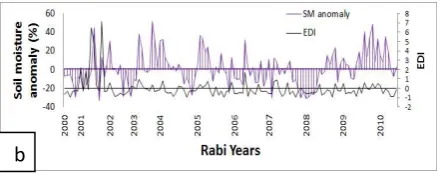
The sensitivity analysis revealed direct relationship between soil moisture anomaly and EDI; also discovered good relationship between NDVI anomaly to soil moisture anomaly lagged to 16 days. It is clearly seen that in majority of portion in the graph, the soil moisture anomaly increases or decreases from its average in the same way as EDI does, except for few cases. (Figure 10 (a), (b)). A similar situation was observed in (Figure 11 (a), (b)) between NDVI anomaly and soil moisture anomaly lagged to 16 days, for the same agricultural water supply system and agro-climatic zones.
Figure 10. (a) Variability of soil moisture anomaly changing with variability of EDI in irrigated areas of Northern Plains.
Figure 10. (b) Variability of soil moisture anomaly changing with variability of EDI in rain-fed areas of Central
Highlands.
Figure 11. (a) Variability of NDVI anomaly changing with variability in soil moisture anomaly in irrigated areas of
Northern Plains
Figure 11. (b) Variability of NDVI anomaly changing with variability in soil moisture anomaly in in rain-fed areas of
Central Highlands
Figure 12. (a) Soil moisture anomaly estimation model (Input: EDI), (b) NDVI anomaly estimation model (Input:
Soil moisture anomaly), for irrigated areas in Northern Plains.
Figure 13. (a) Soil moisture anomaly estimation model (Input: EDI), (b) NDVI anomaly estimation model (Input:
Soil moisture anomaly), for rain-fed areas in Central Highlands.
Correlation coefficient for relationship between soil moisture anomaly with EDI for irrigated areas of Northern Plains and rain-fed areas of Central Highlands were found as 0.64 and 0.70 respectively, after removing outliers. Similarly, the correlation coefficient for relationship between NDVI anomaly with soil moisture anomaly lagged to 16 days for irrigated areas of Northern Plains and rain-fed areas of Central Highlands were found as 0.77 and 0.80 respectively. It was found that the relationships of EDI to soil moisture anomaly and soil moisture anomaly to NDVI leading by 16 days could be used to develop an assessment model capable of predicting NDVI anomaly 16 days earlier from its occurrence.
3.2.4 Model Development: The Agricultural drought assessment and prediction model contains a set of equations, developed by linear regression between the identified parameters from sensitivity analysis. The soil moisture anomaly and the NDVI anomaly estimation models for irrigated areas of Northern Plains are presented in Figure 12 (a) and (b). Similar estimation models for rain-fed areas of Central Highlands are shown in Figure 13 (a) and (b).
These set of equations were developed individually for irrigated areas in the Northern Plains and rain-fed areas in Central Highlands.
The developed Agriculture assessment model requires rainfall data as the only input. The rainfall data includes rainfall records from three day prior to the period for which drought condition has to be estimated and the information regarding the zone in which the rainfall data lies (Northern Plains/ Central Highlands).
The effective precipitation as input to the agricultural drought estimation/prediction model needs to be calculated from the input rainfall data as:
EPp =∑ ∑ ⁄ ] (9)
b
a
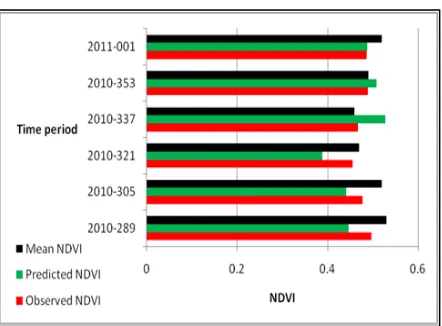
Figure 14. Spatial averages of long term mean NDVI, predicted NDVI and NDVI observed from MODIS product
for Irrigated areas in Northern Plains.
Figure 15. Spatial averages of long term mean NDVI, predicted NDVI and NDVI observed from MODIS product
for rain-fed areas in Central Highlands.
where, EPp is effective precipitation of a particular day accumulated for three days, Pm is the precipitation for a day m days prior to a specific day. The EDI computation is followed by including EPp as:
EDIcal= (EPp-Xp) / Yp (10)
where, EDIcal is EDI to be estimated, Xp is the mean of effective precipitation and Yp standard deviation of difference between observed effective precipitation and Xp for the pth Julian day.
3.2.5 Validation of Model Predictive Capability: The agricultural drought assessment model was used for estimation of NDVI for 16 days period starting on day 289, 305, 321, 353 of year 2010 and 1st day of 2011. As these periods were never included for the model development, it can also be considered as a prediction case for the model. In most of the cases, spatial average of the predicted NDVI shows similar behavior to that of MODIS NDVI in both the irrigated areas of Northern Plains and rain-fed areas of the Central Highlands (Figure 14, Figure 15). Therefore, the model has a good predictive capability for both irrigated and rain-fed areas of Bundelkhand region.
4. CONCLUSION
This paper presents a study to incorporate satellite observed soil moisture data in Agricultural drought assessment technique, as the soil moisture is supposed to have strong impact on agriculture system. The coarse spatial resolution satellite soil moisture data is downscaled to a finer resolution. The spatial resolution of soil moisture product was improved from around 27 km to 1 km using Linking model based on Triangle method. The RMSE and spatial variability of downscaled soil moisture against initial soil moisture has been found to be within acceptable range (RMSE values in the range of 0.05 m3/m3), which justifies the technique used for soil moisture downscaling and the potential applicability of downscaled soil moisture data.
The sensitivity analysis has been carried out in which, sensitiveness of downscaled soil moisture and NDVI has been tested with respect to meteorological drought indicator EDI of same time step as well as lagged time steps. Since, majority of the area of Northern Plains is covered by irrigated system; agricultural drought for this agro-climatic zone is estimated on the basis of irrigated system. Similarly, the Central Highlands is assessed for rain-fed type agriculture. The effect of EDI on soil moisture anomaly is found to be most strong for simultaneous period (same time step) with a correlation coefficient over 0.64 in irrigated areas of Northern Plains and 0.77 in rain-fed areas of Central Highlands. However, rain-fed areas have a better sensitivity of soil moisture anomaly to EDI than irrigated areas. The reason for this difference can be frequent water supply in irrigated regions and persisting arid conditions in rain-fed areas.
In the following analysis, NDVI anomaly with soil moisture anomaly was found to have correlation coefficient values 0.77 & 0.80 in irrigated areas of Northern Plains and rain-fed areas of Central Highlands respectively. It shows that there is a strong relation of vegetation with soil moisture, irrespective of water supply system.
Sensitivity analysis for different agricultural system (irrigated/rain-fed) of different agro climatic zone (Northern Plainss/Central Highlands) was helpful for development of an agricultural drought assessment model. The predictive capability of the agricultural drought prediction model was checked against real time MODIS data. Predictions of the model were found to be slightly over-predicting or under-predicting, but it still satisfies the temporal pattern of predictions.
4.1.1 Limitations: The downscaling of soil moisture through Linking model based on Triangle method works on the basis of second order polynomial regression between soil moisture, EVI and LST. Since it is a statistical model, problem of over fitting and under fitting exists. Often the approximation under the prediction surface attains negative values, which is rare in case, but unreasonable. Such downscaled pixels with these negative values, needs to be avoided.
Spatial resolution dealt in this research was kept up to 1 km due to which it is limited to be used for further sub regions (land parcel/agricultural field level).
crop yield and crop production data in irrigated and rain-fed areas with respect to drought conditions.
4.1.2 Recommendations for Future Works: Future sensors like on boarding Soil Moisture Active Passive (SMAP), an American environmental research satellite to be launched in 2015, with higher spatial resolution of soil moisture products can be utilized to downscale soil moisture to further fine resolution. This can be used for better agricultural drought assessment in sub region (village level/field level). It can enhance the agricultural drought assessment in spatial domain.
To overcome the negative prediction in downscaling of coarse satellite soil moisture, it is suggested to use a better downscaling technique incorporating in-situ measurements.
The agricultural drought assessment model can serve as base for the estimation of crop yield and crop production, if the crop factors stated above are implemented. These factors when included in the model can estimate other crop Index: Limitations & assumptions. Journal of Climate and Applied Meteorology, 23, pp. 1100-1109.
Breshears, David, D., Cobb, Neil, S., Rich, Paul, M., Price, Kevin, P., Allen, Craig, D., Balice, Randy, G., Romme, William, H., Kastens, Jude, H., Floyd, Lisa, M., Belnap, Anderson, Jayne, Jesse, J., Myers, Orrin, B., Meyer, and Clifton, W., 2005. Regional vegetation die-off in response to global-change-type drought. Proceedings of the National Academy of Sciences, 102 (42), pp. 15144 –15148.
Brown, J.F., Reed, B.C., Hayes, M.J., Wilhite, D.A., & Hubbard. K., 2002. A prototype drought monitoring system integrating climate and satellite data. Pecora 15/Land Satellite Information IV/ISPRS Commission I/FIEOS, Conference Proceedings, Denver, CO, Nov 10–14.
Brown, J.F., Wardlow, B.D. Tadesse, T. Hayes, M.J., & Reed. B.C., 2008. The vegetation drought Byun, H.R., and Kim, D.W., 2010. Comparing the effective drought index and the standardized precipitation index. Options Méditerranéennes, A, 95, pp. 85-89.
Brown, J.F., Wardlow, B.D. Tadesse, T. Hayes, M.J., & Reed. B.C., 2008. The vegetation drought response index (VegDRI): A new integrated approach for monitoring drought stress in vegetation. GIScience and Remote Sensing, 45(1), pp. 16–46.
Byun, H.R., and Kim, D.W., 2010. Comparing the effective drought index and the standardized precipitation index. Options Méditerranéennes, A, 95, pp. 85-89.
Byun, Hi Ryong, & Wilhite, D. A., 1999. Objective quantification of drought severity and duration. American Meteorological Society, 12, pp. 2747-2756.
Byun, Ryong, H., Wilhite, and Donald, A., 1999. Objective quantification of drought severity and duration. American Meteorological Society, 12, pp. 2747-2756.
Carlson, T. N., Gillies, R. R., and Perry, E. M., 1994. A method to make use of thermal infrared temperature and NDVI measurements to infer soil water content and fractional vegetation cover. Remote Sensing Reviews, 52, pp. 45–59.
Carlson, T.N., 2007. An overview of the “triangle method” for estimating surface evapotranspiration and soil moisture from satellite imagery. Sensors, 7, pp. 1612–1629.
Chen, Xiaoqiu, Xu, Chengxin, and Zhongjun, T., 2001. An analysis of relationships among plant community phenology and seasonal metrics of Normalized Difference Vegetation Index in the northern part of the monsoon region of China. International Journal of Biometeorology, 45, pp. 170–177.
Dheeravath, V., Thenkabail, P.S., Chandrakantha, G., Noojipady, P., Reddy, G.P.O., Biradar, C.M., Gumma, M.K., & Velpuri, M., 2010. Irrigated areas of India derived using MODIS 500 m time series for the years 2001–2003. ISPRS Journal of Photogrammetry & Remote Sensing, 65, pp. 42– 59.
Guttman, N.B., 1997. Accepting the standardized precipitation index: a calculation algorithm. Journal of The American Water Resources Association, 35 (2), pp. 311- 322.
Heim, R. R., 2002. A review of twentieth-century drought indices used in the United States. Bulletin of the American Meteorological Society, 84, pp. 1149−1165.
Huete, A., Didan, K., Miura, T., Rodriguez, E.P., Gao, X., & Ferreira, L.G., 2002. Overview of the radiometric and biophysical performance of the MODIS vegetation indices. Remote Sensing of Environment, 83, pp.195–213.
Hughes, B.L., & Saunders, M.A., 2002. A drought climatology for Europe. International Journal of Climatology, 22, pp. 1571–1592.
Jiang, L., & Islam S., 2003. An intercomparison of regional latent heat flux estimation using remote sensing data. International Journal of Remote Sensing, 24 (11), pp. 2221– 2236.
Kaheil, Yasir, H., Gill, M., Kashif, McKee, Mac, Bastidas, Luis, A., and Rosero, E., 2008. Downscaling and assimilation of surface soil moisture using ground truth measurements. IEEE Transactions on Geoscience and Remote Sensing, 46 (5).
Kim, Jongyoun, & Hogue, Terri S., 2012. Improving spatial soil moisture representation through integration of AMSR-E and MODIS products. IEEE Transactions on Geoscience and Remote Sensing, 50 (2), pp. 446-460.
McKee, T. B., Doesken, N. J., and Kleist, J., 1995. Drought monitoring with multiple time scales. Proceedings of the Ninth Conference on Applied Climatology, pp. 233–236.
McKee, T. B., Doesken, N. J., and Kleist, J., 1995. Drought monitoring with multiple time scales. Proceedings of the Ninth Conference on Applied Climatology, pp. 233–236. Agnew, C. T., 2000. Using the SPI to identify drought, Drought Network News, 12 (1).
Merlin, O., Bitar, A. Al, Walker, J. P., & Kerr, Y. H., 2009. A sequential model for disaggregating nearsurface soil moisture observations using multiresolution thermal sensors. Remote Sensing of Environment, 113 (10), pp. 2275–2284.
Mishra, A.K., and Singh, V.P., 2010. A review of drought concepts. Journal of Hydrology, 391, pp. 202–216.
Morid, Saeid, Smakhtin Vladimir, and Moghaddasi, Mahnosh, 2006. Comparison of seven meteorological indices for drought monitoring in Iran, International Journal of Climatology, 26, pp. 971–985.
Morid, Saeid, Smakhtin, Vladimir, and Bagherzadeh, K., 2007. Drought forecasting using artificial neural networks and time series of drought indices. International Journal of Climatology. 27, pp. 2103–2111.
Ozdogan, M., & Gutman, G.,2008. A new methodology to map irrigated areas using multi-temporal MODIS and ancillary data: An application example in the continental US. Remote Sensing of Environment, 112, pp. 3520–3537.
Palmer, W. C., 1965. Meteorological drought. U.S. Weather Bureau Research Paper, 45, pp. 58.
Prasad, A.K., Singh, R.P., Tare, V., and Kafatos, M., 2007, Use of vegetation index and meteorological index for the prediction of crop yield in India. International Journal of Remote Sensing, 28 (23), pp. 5207-5235.
Rooy, M. P., van 1965. A rainfall anomaly index independent of time and space. Notos, 14, pp. 43.
Smakhtin, V.U., and Hughes, D.A., 2007. Automated estimation and analyses of meteorological drought characteristics from monthly rainfall data. Environmental Modelling & Software, 22, pp. 880-890.
Son, N.T., Chen, C.F., Chen, C.R., Chang, L.Y., & Minh, V.Q., 2012. Monitoring agricultural drought in the Lower Mekong Basin using MODIS NDVI and land surface temperature data. International Journal of Applied Earth Observation and Geoinformation, 18, pp.417–427.
Stockli, R., and Vidale P. L., 2004. European plant phenology and climate as seen in a 20-year AVHRR land-surface parameter dataset. International Journal of Remote Sensing, 25 (17), pp. 3303–3330.
Tadesse, T., Brown, J.F., and Hayes, M.J., 2005. A new approach for predicting drought-related vegetation stress: Integrating satellite, climate, and biophysical data over the U.S. central plains. ISPRS Journal of Photogrammetry & Remote Sensing, 59, pp. 244–253.
Thenkabail, P.S., Dheeravath, V., Biradar, C.M., Gangalakunta, O.R.P., Noojipady, P., Gurappa, C., Velpuri, M., Gumma, M., and Li, Y., 2009. Irrigated area maps and statistics of India using remote sensing and national statistics. Remote Sensing, 1, pp. 50–67.
Tucker, C. J., 1979. Red and photographic infrared linear combinations for monitoring vegetation. Remote Sensing of Environment, 8 (2), pp. 127–150.
Tucker, C. J., and Choudhury, B.J., 1987. Satellite remote sensing of drought conditions. Remote Sensing of Environment, 43, pp. 243-251.
Wang, Lingli, & Qu, J. J. (2007). NMDI: A normalized multi-band drought index for monitoring soil and vegetation moisture with satellite remote sensing. Geophysical Research Letters, 34.