Indonesia:
Economic
and
Social
update
INDONESIA ECONOMIC AND SOCIAL UPDATE April 2008
TABLE OF CONTENTS
SUMMARY AND OVERVIEW
PART I: MACROECONOMIC UPDATE
1. The global economy is once again facing a crisis
2. Indonesia, like much of East Asia, has thus far maintained its growth momentum in the face of the global downturn
3. Global financial turmoil is beginning to have an effect but the fundamentals of Indonesia’s financial sector appear strong
4. Higher commodity prices have helped Indonesia’s exports, which are diversifying in terms of both destinations and composition
5. Higher agricultural (food) commodity prices are translating into higher domestic inflation
6. Higher energy prices have raised concerns about the central government budget position and have forced a revision
7. The slowdown in the world economy and increasing risks make projecting outcomes for 2008 and 2009 more difficult than usual
PART II: UPDATE ON MICROECONOMIC AND SOCIAL SECTOR DEVELOPMENTS
1. Indonesia’s investment climate continues to improve but with some key areas of continued weakness
2. The phenomenon of “jobless growth” may be easing and the manufacturing sector may be more dynamic than previously thought
3. There has been an increased focus on targeted programs for the poor and on monitoring and evaluation of such programs
4. Recent developments in educational policy and programs
PART III: SPECIAL FEATURES ON INDONESIA’S LONGER-TERM DEVELOPMENT AGENDA
SUMMARY AND OVERVIEW
Despite a slowing global economy, Indonesia’s economic growth accelerated to a ten-year high of 6.3 percent in 2007. This growth rate was sufficient to reduce poverty from 17.8 to 16.6 percent based on the Government’s poverty line and reversed the recent trend towards jobless growth, with unemployment falling from 10.3 to 9.1 percent. The drivers of growth shifted over the course of the year. During the first half, the economy drew strength from external demand, whereas in the second half the driving force was investment and consumer demand. High commodity prices continued to play an important role, with coal and palm oil exports growing rapidly. Inflation ended the year at the upper end of the government’s inflation target, at 6.6 percent, but has since risen further to 7.4 percent on rising food prices. The Government budget deficit was 1.3 percent of GDP, while the debt-to-GDP ratio continued to decline rapidly, falling to below 35 percent by the end of 2007 (down from 80 percent in 2000). The nominal exchange rate weakened in 2007, but the rupiah remained within the Rp 9,000 to Rp 9,500 range and strengthened again in early 2008.
Global financial turmoil is beginning to have an effect. The commodity heavy Indonesian stock market enjoyed one of the world’s best performances in 2007, during which it grew by 52 percent, and continued to perform well until March 2008 when — along with global financial markets — it saw a significant correction. Similarly, despite an upgrade in Fitch’s sovereign long-term foreign debt rating for Indonesia to BB (speculative grade) in February 2008, the financial turmoil raised international risk premiums (up from a low of 130 bps mid-year 2007 to over 300 in 2008), and increased domestic interest rates for Government borrowing (from well under 9 percent mid-year to well over 10 percent in 2008 for a 10-year bond).
High commodity prices make the state of the economy in early 2008 difficult to read. On the one hand high prices in energy, mining and agriculture are positive for the Indonesian economy as a whole. For example, net oil and gas exports were estimated to be US$6.6 billion in 2007, while exports of coal, copper and CPO were US$6,7, US$7.3 and US$7.4 billion, respectively. All are growing at double digit rates. These commodities contributed to a current account surplus of 2.6 percent in 2007. But on the other hand, high commodity prices also have downsides. Most immediately, high agricultural commodity prices are feeding through into domestic food prices with food inflation year-on-year in February 2008 running at 10.4 percent, far higher than overall inflation at 7.4 percent. These higher food prices affect the poor, although the rice price, the largest single item in the consumption basket of poor, was virtually constant over the past year.
1
Another important area of growing concern is the central government budget. With fixed domestic prices for gasoline, transportation diesel and kerosene, (between them accounting for over 2/3 of fuel sales), subsidies have grown rapidly and will reach Rp 130 trillion (US $14.3 billion) in 2008 based at the Government’s estimate of US$95 a barrel. At this level, total energy subsidies (for electricity as well as fuel) will be equivalent to total central government capital and social spending. Driven by the increase in subsidies, measures are proposed to cut spending in line ministries, reduce subsidies on electricity, and ration kerosene to ensure that it only goes to the poor. With these measures the Government expects the budget deficit to rise from 1.7 percent of GDP to just over 2 percent of GDP.
Investment picked up substantially in 2007, reaching 24.8 percent of GDP, there was reform progress and business perceptions showed some improvement. In fact, in its upgrade Fitch attributed this pick-up in investment to the Government’s efforts to improve the investment climate. It also, hopefully, reflects the beginning of a turnaround
in perceptions of Japanese global investors who returned Indonesia to the 8th most
desirable investment location from 9th in 2006, still down substantially from 4th in 2002.
On the downside, discussions between the government, employers and workers on labor regulations on severance provisions have not been concluded and formal sector employment growth continues to lag. Indonesia’s inability to maximize its tremendous potential in mining is another area of weakness (especially given current prices). No Contract of Work (CoW) for a major mining company has been signed in the past 10 years and an amended mining law continues to languish in parliament.
Pendahuluan Rangkuman
Walaupun perkembangan ekonomi global melamban, pertumbuhan ekonomi Indonesia maju pesat mencapai puncaknya dalam jangka waktu sepuluh tahun terakhir ini yaitu 6.3 percent pada tahun 2007. Laju pertumbuhan tersebut cukup untuk menurunkan kemiskinan dari 17,8 menjadi 16,6 persen berdasarkan garis kemiskinan Pemerintah RI, dan membalikarahkan kecenderungan arah pertumbuhan tanpa lapangan kerja, tingkat pengangguran berkurang dari 10,3 menjadi 9,1 persen. Pemacu pertumbuhan telah bergeser selama tahun tersebut. Selama paruh pertama, kekuatan ekonomi bersumber pada permintaan luar negeri, sedangkan selama paruh kedua kekuatan yang memacu perekonomian adalah investasi dan permintaan konsumen. Harga komoditi yang tinggi tetap mempunyai peranan penting, ekspor batu bara dan minyak kelapa sawit tumbuh pesat. Inflasi pada akhir tahun berada pada ujung atas dari target inflasi pemerintah, yaitu 6,6 persen, namun setelah itu naik kembali mencapai 7,4 persen akibat harga pangan yang meningkat. Defisit APBN sebesar 1,3 persen dari PDB, sedangkan rasio hutang terhadap PDB terus menurun dengan pesat, sampai anjlok di bawah 35 persen pada akhir tahun 2007 (turun dibanding dengan 80 persen pada tahun 2000). Nilai tukar nominal melemah dalam tahun 2007, akan tetapi rupiah tetap berada dalam kisaran Rp 9.000 sampai Rp 9.500 dan menguat kembali pada awal tahun 2008.
Gejolak keuangan global mulai terasa dampaknya. Bursa efek Indonesia (BEI) yang berbasis komoditas menuai kinerja terbaik pada tahun 2007, BEI tumbuh 52 persen dalam tahun tersebut, dan tetap berkinerja baik sampai bulan Maret 2008 ketika ia mengalami koreksi signifikan — seperti juga dialami oleh berbagai pasar keuangan global. Demikian juga, walaupun Fitch meningkatkan peringkat utang luar negeri jangka panjang untuk Indonesia menjadi BB (tingkat spekulatif) pada bulan Februari 2008, gejolak keuangan menaikkan premi risiko internasional (naik dari titik rendah 130 bps pada pertengahan tahun 2007 menjadi 300 lebih pada tahun 2008), dan menaikkan suku bunga dalam negeri untuk pinjaman Pemerintah (dari kurang dari 9 persen pada pertengahan tahun menjadi di atas 10 persen pada tahun 2008 untuk surat utang 10-tahun).
terbesar dalam keranjang konsumsi orang miskin nyaris konstan sepanjang tahun yang lalu.
Bidang penting lain yang semakin mencemaskan adalah APBN.. Dengan tidak berubahnya harga dalam negeri untuk harga bahan bakar bensin dan diesel untuk angkutan dan minyak tanah (yang mewakili lebih dari 2/3 bagian penjualan BBM), subsidi pemerintah tumbuh dengan pesat dan akan mencapai Rp 130 trilyun (US $14.3 milyar) pada tahun 2008 berdasarkan perkiraan Pemerintah sebesar US$95 per barrel. Pada tingkat ini, subsidi enerji total (untuk tenaga listrik maupun untuk BBM) akan sama besar dengan total belanja modal dan sosial pemerintah pusat. Didorong oleh kenaikan subsidi, telah diusulkan langkah-langkah untuk memangkas belanja dalam departemen-departemen teknis, mengurangi subsidi untuk listrik, dan meransum minyak tanah untuk memastikan bahwa hanya orang miskin yang menerimanya. Dengan langkah-langkah tersebut, Pemerintah mengharapkan defisit anggaran belanja naik dari 1,7 persen PDB menjadi sedikit di atas 2 persen PDB.
Investasi meningkat cukup tinggi pada tahun 2007, mencapai 24,8 persen PDB, menunjukan telah terjadi kemajuan pembaharuan dan perbaikan persepsi bisnis. Didalam upgrading peringkat Indonesia, Fitch menyebutkan peningkatan investasi tersebut sebagai akibat dari upaya Pemerintah untuk memperbaiki iklim investasi. Mudah-mudahan peningkatan ini juga mencerminkan awal dari pembalikan arah dalam persepsi para investor global Jepang yang kembali menempatkan Indonesia kepada lokasi investasi paling diinginkan ke-8 dari tempat ke-9 pada tahun 2006, namun masih jauh di bawah tempat ke-4 pada tahun 2002.
Pembahasan antara pemerintah, pengusaha dan pekerja tentang peraturan perburuhan khususnya tentang ketentuan-ketentuan PHK belum rampung dan pertumbuhan lapangan kerja sektor formal tetap melamban, Ketidakmampuan Indonesia untuk memaksimalkan potensi di bidang pertambangan yang luar biasa besar merupakan bidang kelemahan yang lain (terutama mengingat harga-harga yang berlaku saat ini). Tidak ada Kontrak Karya (KK) dengan perusahaan minyak besar yang ditandatangani selama 10 tahun terakhir dan suatu RUU Pertambangan yang diubah terkatung-katung di DPR.
PART 1: MACROECONOMIC UPDATE
1. The global economy is once again facing a crisis
Since the middle of 2007, the unfolding sub-prime mortgage crisis in the U.S. has been spreading to other asset categories, and has led to a liquidity crunch and turmoil in global financial markets. With fuel, food and other commodity prices also soaring in the latter half of 2007, a perfect storm may be in the offing for the global economy.
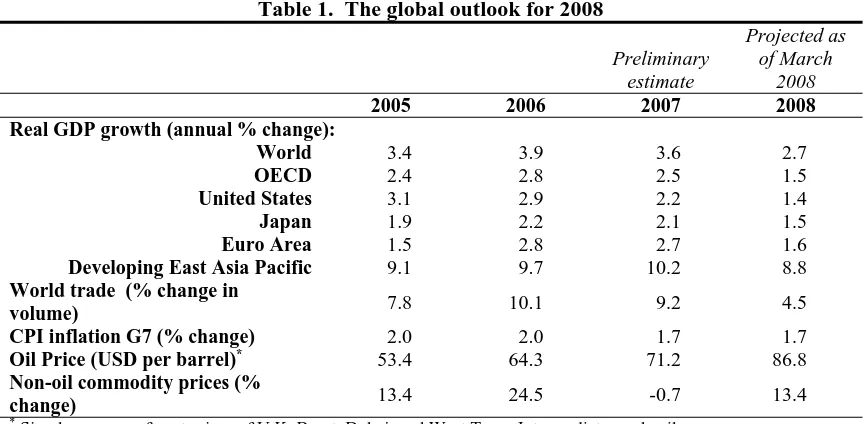
Though East Asia did very well in 2007, recording its highest growth rate in over a decade, the gloomier global outlook for 2008 is a source of concern. The latest forecasts suggest that growth of the world economy is likely to fall by almost a percentage point between 2007 and 2008, while the growth of world trade is forecast to decline by nearly five percentage points from 9.2 percent in 2007 to 4.5 percent in 2008 (Table 1). Oil prices, on the other hand, are predicted to continue to rise to an average price of 86.8 dollars per barrel in 2008, while growth of over 13 percent is forecast for non-oil commodity prices.
Table 1. The global outlook for 2008
Preliminary estimate
Projected as of March
2008
2005 2006 2007 2008 Real GDP growth (annual % change):
World 3.4 3.9 3.6 2.7
OECD 2.4 2.8 2.5 1.5
United States 3.1 2.9 2.2 1.4
Japan 1.9 2.2 2.1 1.5
Euro Area 1.5 2.8 2.7 1.6
Developing East Asia Pacific 9.1 9.7 10.2 8.8
World trade (% change in
volume) 7.8 10.1 9.2 4.5
CPI inflation G7 (% change) 2.0 2.0 1.7 1.7
Oil Price (USD per barrel)* 53.4 64.3 71.2 86.8
Non-oil commodity prices (%
change) 13.4 24.5 -0.7 13.4
*
Simple average of spot prices of U.K. Brent, Dubai, and West Texas Intermediate crude oil. Source: World Bank Development Economics Prospects Group (preliminary, March 2008)
2. Indonesia, like much of East Asia, has thus far maintained its growth momentum in the face of the global downturn
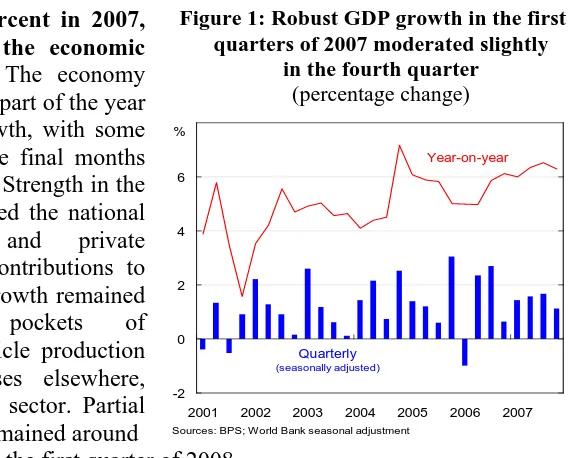
Figure 1: Robust GDP growth in the first 3 quarters of 2007 moderated slightly
in the fourth quarter
(percentage change)
Indonesia grew by 6.3 percent in 2007, the fastest growth since the economic crisis of the late 1990s. The economy accelerated through the first part of the year to a very firm pace of growth, with some moderation appearing in the final months of 2007 (Figure 1, Table 2). Strength in the domestic economy dominated the national accounts: construction and private consumption made large contributions to aggregate growth. Export growth remained robust, with some pockets of manufacturing such as vehicle production making up for weaknesses elsewhere, especially in the oil & gas sector. Partial indicators suggest growth remained around
-2 0 2 4 6
2001 2002 2003 2004 2005 2006 2007
-2
Sources: BPS; World Bank seasonal adjustment
Year-on-year
Quarterly
(seasonally adjusted)
%
its December quarter pace in the first quarter of 2008.
Investment grew strongly in the latter half of 2007, accelerating to 12.1 percent growth over the year and lifting investment’s share in Indonesian expenditure to 25.0 percent by the December quarter 2007 (Figure 2). The rise in construction, which constitutes the bulk of investment, explains much of the increase, with machinery & appliance investment also growing strongly over the year. Investment in imported machinery and equipment was particularly strong. Data on imports suggest that expanding automotive production capacity and booming demand in the telecommunications industry are driving much of non-construction investment, and the import data and foreign investment approval and realization numbers suggest the recent pace should continue in the near term. The private sector appears to be the driving force as central government capital spending increased by only 6 percent in 2007 in real terms,
Table 2: Expenditure Accounts 2007
Q1 Q2 Q3 Q4
Total GDP 5.0 5.7 5.5 6.3 5.3 7.1 7.5 5.0 6.3 100
Domestic 7.0 5.8 3.5 6.0 3.5 8.5 8.2 7.0 5.2 97
Private consumption 5.0 4.0 3.2 5.0 5.2 5.3 5.5 5.7 2.9 63
Government consumption 4.0 6.6 9.6 3.9 -20.1 31.4 7.2 -4.8 0.3 8
Investment 14.7 10.9 2.5 9.2 8.5 9.7 15.7 15.0 2.0 25
(Construction) 7.5 7.5 8.3 8.6 8.0 8.6 10.7 12.4 1.4 21
External -19.5 12.0 12.8 4.5 -39.1 123.6 -17.2 -29.7 0.4 4
Exports 13.5 16.6 9.4 8.0 12.2 9.1 1.2 10.0 3.8 29
Annual percentage change Annualized SA quarterly
percentage change
2004 2005 2006 2007
and while the 2008 revised proposed budget aims for a very firm increase in government spending this year, it is not clear that can be realized given pressures from energy subsidies (section 6).
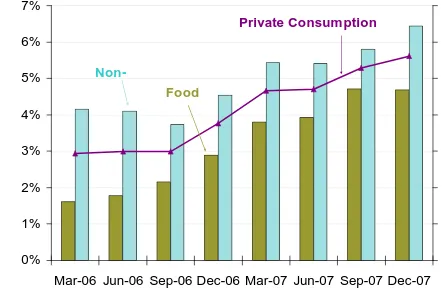
Private consumption grew by 5.0 percent between 2006 and 2007 and by 5.6 percent during the course of 2007, its fastest pace this decade (Figure 3). Non-food consumption led this growth. The December quarter appears to have maintained the pace of earlier in 2007, according to the seasonally adjusted quarterly growth rates and various partial indicators. For example, consumer credit accelerated through 2007 as interest rates fell; growth in motor vehicle sales has been very strong, although motorbike sales have been more mixed recently, and unemployment fell to 9.1 percent in 2007 from 10.3 percent in 2006. In contrast government consumption increased by only 2.0 percent from the end of 2006 and 3.9 percent in annual terms, and is likely to be even weaker in 2008 given the challenges of continuing to finance the mounting energy subsidies.
Figure 2. Investment accelerates, drawing more on imported capital goods
(percentage change)
Figure 3. Strong private consumption
(year-on-year percentage change)
2003 2004 2005 2006 2007
I m por t ed
Source. BPS and World Bank staff calculations
0%
Mar-06 Jun-06 Sep-06 Dec-06 Mar-07 Jun-07 Sep-07 Dec-07
Non-Private Consumption
Food
Source. BPS and World Bank staff calculations
Robust export growth was eclipsed by an even stronger increase in imports, and net exports were negative in the latter half of 2007. Total exports increased by 8.0 percent in 2007 from 2006, and 7.3 percent in the year to the December quarter, led by manufactured exports especially automotive goods and chemicals, and by some agricultural products. The volume of mining and forestry product exports fell over the year, associated with supply problems in both industries. The 14.8 percent increase in imports over 2007 was broad based. The 24 percent increase in capital goods imports reflected the strength in investment, as did various intermediate goods, such as steel. Strong consumer demand led to large increases in imports of food items including rice and sugar, and a 69 percent increase in imports of passenger cars.
Table 3: Production Accounts
Year on year (%) Share to % change
GDP - Production Account 2007 2006 2007 2006 2007
YoY (%) Q1 Q2 Q3 Q4
Tradable 3.4 4.7 4.8 2.5 3.7 3.9 35.1 31.3
Agriculture -1.7 4.7 7.6 3.1 3.4 3.5 8.8 7.9
Mining 6.2 3.2 1.0 -2.1 1.7 2.0 2.9 2.9
Manufacturing 5.2 5.1 4.5 3.8 4.6 4.7 23.4 20.5
Non-Tradable 9.0 8.2 8.3 10.0 7.5 8.9 64.9 68.7
Construction 8.4 7.7 8.3 9.9 8.3 8.6 9.0 8.3
Finance 8.1 7.6 7.6 8.6 5.5 8.0 9.1 11.6
Transport & Communication 13.0 12.7 14.1 17.4 14.4 14.4 16.3 15.4
Utilities 8.2 10.2 11.3 11.8 5.8 10.4 0.7 1.1
Trade, Hotel & Restaurant 9.2 7.6 7.9 9.1 6.4 8.5 19.6 22.6
Services 7.0 7.0 5.2 7.2 6.2 6.6 10.3 9.7
Total 6.1 6.4 6.5 6.3 5.5 6.3 100 100
Oil -0.7 -1.7 1.3 -2.2 -1.3 -0.8 -1.9 -1.0
Non-Oil 6.7 7.1 6.9 7.0 6.1 6.9 101.9 101.0
Total 6.1 6.4 6.5 6.3 5.5 6.3 100 100
Source: BPS, World Bank staff calculations
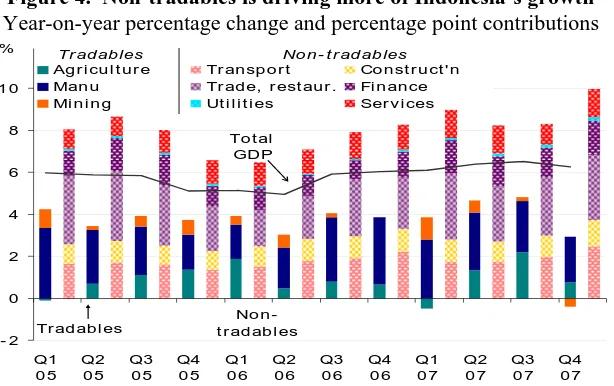
But this headline picture of poor tradeable sector growth is a bit misleading. Much of the weakness in tradables was due to the oil & gas sector’s poor performance (it subtracted 0.3 percentage points from tradables’ growth) and that of agriculture, which produces one-quarter of the output of the tradables sector, and which, as in most economies, grew at a much lower rate than did other sectors of the economy. Non-oil & gas manufacturing recorded a mixed performance in 2007. Transport equipment, machinery & apparatus production increasing by 14.5 percent and now constitute almost one-third of Indonesia’s manufacturing output. On the other hand, textile, clothing & footwear and forest product production fell over the year.
Figure 4. Non-tradables is driving more of Indonesia’s growth
Year-on-year percentage change and percentage point contributions
- 2
translating into significantly higher imports of telecommunications equipment and aircraft. Meanwhile consumer demand is translating into strong growth in wholesale & retail trade and hotels & restaurants, with 9.5 percent and 7.5 percent growth respectively over 2007. Recent strength in visitor arrivals and the government’s Visit Indonesia tourism campaign should support these sectors this year. The finance & business services industries’ output grew by 8.6 percent, led by building services.
3. Global financial turmoil is beginning to have an effect but the fundamentals of Indonesia’s financial sector appear strong
Capital Markets and Non-banking Financial Institutions
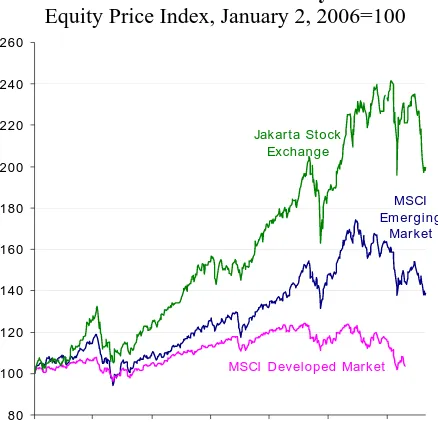
Figure 5. Indonesia’s stock markets performed exceptionally in 2007, but were
volatile and weaker this year
Equity Price Index, January 2, 2006=100
The Indonesian stock market was amongst the world’s strongest performers in 2007, as it has been since 2003, but has slipped recently, with the increasing turbulence in global financial markets (Figure 5). The Jakarta Composite Index rose by by 52 percent in 2007 and hit a record high. Plantation, mining and other natural resource companies drove this performance. Bank shares rallied on expectation of renewed growth in high-yielding consumer loans. However, since the beginning of 2008, like stock markets worldwide, the Indonesian stock market has seen a significant correction, with a fall of 9.3 percent between the start of the year and late March 2008, a somewhat better performance than most other stock markets in the region.
MSCI Devel oped Market
Source: Bloomberg
The Jakarta Stock Exchange and Surabaya Stock Exchange were merged into the Indonesian Stock Exchange (Bursa Efek Indonesia) in December 2007. The merger process has been smooth and not interrupted trading. The new Exchange benefits from the strong presence of the Jakarta Stock Exchange in the secondary equity market and the Surabaya Stock Exchange’s dominant role in the secondary bond market.
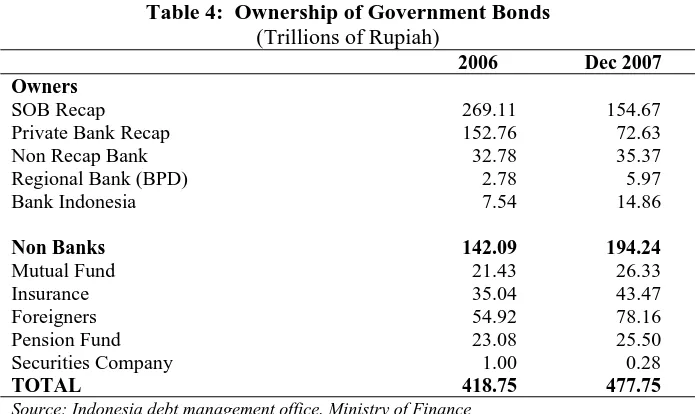
been auctioning new series of Government bonds to a relatively young market, with growing demand from retail investors attracted by the relatively strong returns. The average 3-month deposit rate now stands at 7.4 percent pa, while the government securities issued in February 2008 offer 9.5 percent with 4 year maturity. After banks, foreign investors continue to be the largest holder of Government bonds, followed by
mutual funds (Table 4).
Table 4: Ownership of Government Bonds
(Trillions of Rupiah)
2006 Dec 2007 Owners
SOB Recap 269.11 154.67
Private Bank Recap 152.76 72.63
Non Recap Bank 32.78 35.37
Regional Bank (BPD) 2.78 5.97
Bank Indonesia 7.54 14.86
Non Banks 142.09 194.24
Mutual Fund 21.43 26.33
Insurance 35.04 43.47
Foreigners 54.92 78.16
Pension Fund 23.08 25.50
Securities Company 1.00 0.28
TOTAL 418.75 477.75
Source: Indonesia debt management office, Ministry of Finance
Mutual fund net asset values (NAV) appreciated considerably in 2007, while new products entered the market. The net asset value of mutual funds rose 78.6 percent in 2007, to Rp 92.2 trillion. The bullish sentiment in the equity market led more mutual fund investors to equity-based funds. These funds now represent the largest portion of total net asset value (36.4 percent), followed by fixed income funds (24.4 percent), capital protected funds (18.4 percent), balance funds (15.3 percent), money market funds (5.3 percent), while index funds and the new Exchange Traded Funds each represent less than 1 percent of total net asset value.
The life insurance market has been expanding rapidly. According to the association of life insurers, premiums collected grew by at least 40 percent in 2007, compared with 22 percent growth in 2006. Premiums have been growing by over 20 percent each year over the last three years backed by strong demand for investment-linked insurance products. Growth in general insurance has been much lower and competition is much stiffer due to a smaller customer base.
Banking Sector
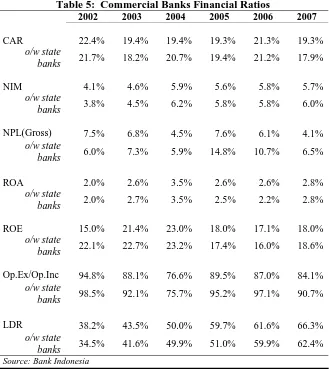
continuing the fall from their 2005 peak. A substantial reduction of NPL in state banks has been the main driver for this achievement. Overall financial performances of state banks have improved over the year. However state banks underperform in terms of NPL and operating efficiency ratios relative to their private sector peers (Table 5).
Table 5: Commercial Banks Financial Ratios
2002 2003 2004 2005 2006 2007
CAR 22.4% 19.4% 19.4% 19.3% 21.3% 19.3%
o/w state
banks 21.7% 18.2% 20.7% 19.4% 21.2% 17.9%
NIM 4.1% 4.6% 5.9% 5.6% 5.8% 5.7%
o/w state
banks 3.8% 4.5% 6.2% 5.8% 5.8% 6.0%
NPL(Gross) 7.5% 6.8% 4.5% 7.6% 6.1% 4.1%
o/w state
banks 6.0% 7.3% 5.9% 14.8% 10.7% 6.5%
ROA 2.0% 2.6% 3.5% 2.6% 2.6% 2.8%
o/w state
banks 2.0% 2.7% 3.5% 2.5% 2.2% 2.8%
ROE 15.0% 21.4% 23.0% 18.0% 17.1% 18.0%
o/w state
banks 22.1% 22.7% 23.2% 17.4% 16.0% 18.6%
Op.Ex/Op.Inc 94.8% 88.1% 76.6% 89.5% 87.0% 84.1%
o/w state
banks 98.5% 92.1% 75.7% 95.2% 97.1% 90.7%
LDR 38.2% 43.5% 50.0% 59.7% 61.6% 66.3%
o/w state
banks 34.5% 41.6% 49.9% 51.0% 59.9% 62.4%
Source: Bank Indonesia
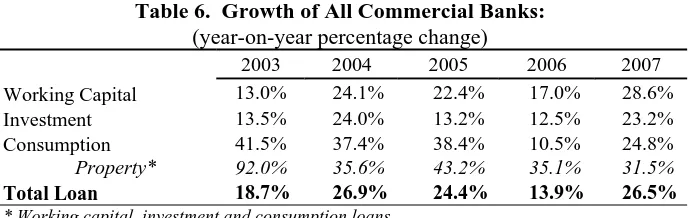
Total bank loans accelerated, with consumer loans returning to strong growth. Total outstanding loans in the banking sector increased by 27 percent last year compared to only 14 percent a year earlier. Consumer loans returned to growth of 25 percent in 2007 after a moderate 11 percent increase in 2006 (Table 6). This type of loan – typically consisting of mortgages, auto (car and motorbike), credit card and unsecured multipurpose loans – appears to respond quickly to the decline in interest rates in the market. An encouraging sign is that investment loans grew by 23 percent compared to 13 percent previously, in line with the trend of rising investment in the national economy.
Property loans are continuing at a high rate. Construction sites for new offices buildings and shopping malls have been very visible in Jakarta in recent years.A report
published by the property research company, Jones Lang Lasalle2
suggests that high
2
demand for investment grade office buildings has generated growth in rental values of 34.8 percent. However, it is expected that the increase in supply will outstrip new demand, and the vacancy rate is expected to increase to 21 to 25 percent in the next three years. The performance of up-scale retailers has not been as stellar, with rapid inventory growth in recent years. Last year rental values for prime retail sites grew by only 1.3 percent, and in the previous two years before that, at 13.0 percent and 6.0 percent respectively.
The banking sector remains highly liquid. Banks are still holding large amount of liquid assets in their balance sheets. Placements with Bank Indonesia, including SBIs, amounted to Rp 418 trillion or 34 percent of banks assets at the end 2007, with another Rp108 trillion or 9 percent of assets invested in marketable securities (mostly government Bonds).
Bank Indonesia has, in recent months taken several steps to encourage lending micro, small and medium enterprises (MSMEs). It has announced regulations to (i) treat loans to MSMEs more favorably in terms of prudential regulations; (ii) encourage banks to provide business development support; (iii) require banks to achieve a certain ratio of MSME loans in the overall loan portfolio and (iv) assign lower risk weight for MSME loans guaranteed by credit guarantee companies. BI however stated it would do with consideration for each bank’s loan portfolios.
BI bank cross-ownership restrictions are prompting a wave of mergers and divestments. The owner of Bank Niaga and Bank Lippo, Malaysian state investment company Khazanah Nasional Bhd, plans to merge the two to comply with BI regulations limiting ownership to one bank (Single Presence Policy). The combined bank will be the fifth largest in the country by total assets. Temasek Holding of Singapore is responding to the same regulation by selling Bank Internasional Indonesia (BII) to Malayan Bank Bhd (MayBank) for US$1.5 billion; Temasek will retain Bank Danamon.
Table 6. Growth of All Commercial Banks:
(year-on-year percentage change)
2003 2004 2005 2006 2007
Working Capital 13.0% 24.1% 22.4% 17.0% 28.6%
Investment 13.5% 24.0% 13.2% 12.5% 23.2%
Consumption 41.5% 37.4% 38.4% 10.5% 24.8%
Property* 92.0% 35.6% 43.2% 35.1% 31.5%
Total Loan 18.7% 26.9% 24.4% 13.9% 26.5%
4. Higher commodity prices have helped Indonesia’s exports, which are diversifying in terms of both destinations and composition
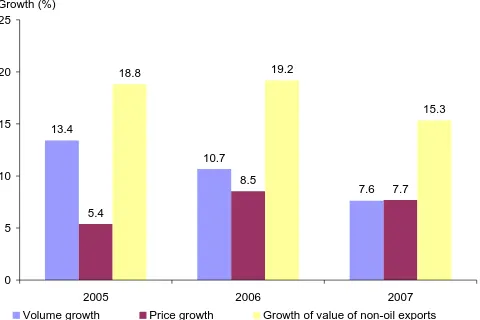
Rising commodity prices are driving export growth, and supporting the Indonesian economy. Total exports reached $114 billion in 2007 (Table 7) and were driven mainly by non-oil exports. Strong prices have helped non-oil exports to grow by 15.5 percent in 2007, with 63 percent of that growth being due to agriculture and mining.
Table 7. Indonesian foreign trade
Description January - December
in billion USD yoy (%)
share to total growth (%)
2005 2006 2007 2006 2007 2006 2007 Total Export 85.7 100.8 114.0 17.7 13.1 100 100
Non-oil and Gas 66.4 79.6 91.9 19.8 15.5 86.93 93.41
Figure 6. Price effects explain half the growth in non-oil exports in 2007
In 2007 price increases contributed one-half of the growth in non-oil exports (Figure
6). High price of palm oil has
pushed up Indonesia’s crude palm oil exports by 55 percent in 2007, compared with 16 percent growth in 2006. The all-time high oil price did not translate into strong increase in oil/gas exports – while oil/gas imports surged by
15 percent; oil/gas exports only
rose by 4.2 percent. On the import side, high commodity prices contributed significantly to the sharp increase in imports of intermediate goods, particularly
13.4
Volume growth Price growth Growth of value of non-oil exports Growth (%)
Note: 2005: December data; 2006 and 2007: January-November data.
Source: BPS, World Bank staff calculations.
soybean and wheat. Nevertheless, Indonesia continues to enjoy surplus in its balance of trade in goods of US$39.6 billion.
growing by 37 percent in 2007, contributing 5.7 percent to the growth in non-oil exports. Passenger cars, automotive parts and components, and sea vessels recorded the largest increases in exports. In contrast, growth in the traditional manufacture exports of textiles, clothing, and footwear (TFC) declined to only 4 percent in 2007 after 2006’s 11 percent growth, reflecting increasing competition from China and Vietnam.
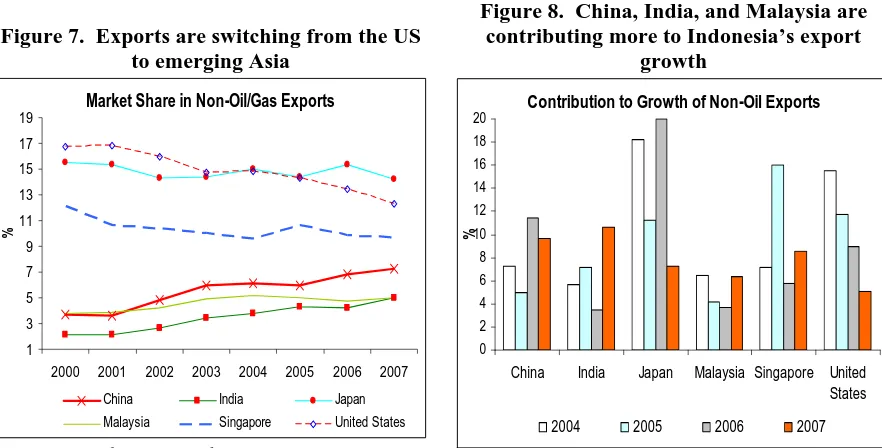
Indonesia’s non-oil exports have become less dependent on the US, as the focus has shifted to China, Malaysia and India (Figure 7 and Figure 8). Although the United States is still the second most important export market for Indonesia, its share continues to decline. Non-oil exports to the US reached US$11.3 billion in 2007, but its share in Indonesia’s total non-oil exports declined to 12 percent in 2007 from 17 percent in 2000. Exports to China, Malaysia, and India are growing fast. Non-oil exports to China, Malaysia, and India grew by 22 percent, 48 percent, and 21 percent respectively in 2007. These markets contributed 27 percent to the increase of Indonesia’s non-oil exports. Strong demand growth and high prices of agriculture and mineral commodities contribute further to the growth of Indonesia’s non-oil export to these countries.
Figure 7. Exports are switching from the US to emerging Asia
Figure 8. China, India, and Malaysia are contributing more to Indonesia’s export
growth
Market Share in Non-Oil/Gas Exports
1
2000 2001 2002 2003 2004 2005 2006 2007
%
China India Japan
Malaysia Singapore United States
Source: BPS and UN-Comtrade
Contribution to Growth of Non-Oil Exports
0
China India Japan Malaysia Singapore United States
%
2004 2005 2006 2007
5. Higher agricultural (food) commodity prices are translating into higher domestic inflation
Inflation has been picking up in Indonesia from the second half of 2007. The headline series increased by 7.4 percent in the year to February, following significant inflation in December 2007 and January 2008. Core inflation has also been building over recent months, reaching 7.3 percent in the year to February (Figure 9).
Figure 9. Food inflation has been ahead of the aggregate CPI
2004 2005 2006 2007 2008
Cor e Food
Headl i ne %
Source. BPS and World Bank staff calculations
Food prices have contributed most to the recent acceleration in living costs, increasing 10.4 percent year-on-year. Food-related prices now make up almost half of the CPI, and an even larger share of the consumption basket of poor households. Much of this inflation reflects growth in international food prices: retail
sugar prices increased by 35 percent
during 2007 and cooking oil prices by
15 percent, both following higher
international prices for these as they shift toward use as biofuels. (Figure 10 and Figure 11) Flour prices were also increasing strongly. All sources of protein recorded double-digit price growth over 2007, apart from fish.
Figure 10. The price of rice stabilized in 2007 but many other
food prices increased strongly
Index, January 2005=100
Figure 11. Most commodity prices have being rising steeply, especially many staple
foods
2005 2006 2007 2005 2006 2007
80
Source: CEIC, World Bank staff calculations
80
2005 2006 2007 2008 2005 2006 2007 2008 80
Figure 12. The gap between domestic and international rice prices is narrowing
1,000 2,000 3,000 4,000 5,000
2000 2001 2002 2003 2004 2005 2006 2007 2008
I nter nati onal
Importantly, the growth in domestic rice prices was a relatively modest 8.7 percent in the year to December 2007. Indonesian rice prices had grown strongly over 2006 as import restrictions limited supply; with these restrictions eased domestic rice prices have stabilized but international prices are now rising rapidly toward parity (Figure 12).
Some other components of the CPI have also recorded strong growth: clothing prices increased by 11.4 percent in the year to February, while education, recreation & sports prices increased by 8.5 percent, some moderation on their rates earlier in the year.
Source. CEIC
Figure 13. Inflation is pushing above BI’s target band
2005 2006 2007 2008 2009
Upper target band
The current inflation rates are challenging BI’s inflation target (Figure 13). To date the central bank has responded by maintaining the policy rate at 8.0 percent after speculation through the latter part of 2007 of possible further cuts to interest rate. The appreciating exchange rate is reducing inflation pressure, but on the other hand, commercial credit and particularly consumer credit have grown strongly in recent months, by 26.5 percent in 2007 (see section 3).
Source. BPS, Bank Indonesia and World Bank staff calculations
6. Higher energy prices have raised concerns about the central government budget position and forced a revision
GDP respectively) (Figure 14).3 Notwithstanding 2007’s increase in the deficit, government debt continued to fall rapidly reaching 34.4 percent of GDP (Figure 15).
Figure 14. Central Government expenditure, revenue & budget balance
(Percent of GDP)
Figure 15. Falling central government debt
(Percent of GDP)
2000 2001 2002 2003 2004 2005 2006 2007*2008* * - 6%
Source. Ministry of Finance and World Bank staff calculations
2000 2001 2002 2003 2004 2005 2006 2007
S.O.E.s
Source. Bank Indonesia and World Bank staff calculations
Managing energy subsidies, limiting growth of the budget deficit, and oil & gas revenues are the focus of the 2008 revised budget. The Government and Parliament are still negotiating the government’s proposed revised budget. The critical elements include the oil price and production assumptions, and measures to limit the growth in energy subsidies both in terms of volume of subsidized energy products consumed (kerosene, gasoline, diesel, LPG gas and electricity. The revised budget in Table 8 assumes oil prices averaging US$83/barrel over 2008, oil production of 910,000 barrels per day, and 35.5 million kilolitres of subsidized fuel being consumed over the year, with no change in
administered fuel prices (kerosene, premium gasoline and transport diesel).4 In the
proposed budget suggests energy subsidies exceed the central government’s social and capital spending programs (Figure 16). Further, the evidence is that these subsidies represent a transfer to Indonesia’s better off households with 45 percent going to the top 10 percent of households, (Susensas 2007) (Figure 17). To limit the growth in subsidies and cap the budget deficit in the 2 percent range, the government has proposed to:
a) cut Government department spending by 10-15 percent, safeguarding social
support and capital investment programs;
b) increase oil & gas revenue by reducing excessive claims for cost recovery;
c) reduce the margin paid to the state oil company, Pertamina, that covers
transportation, distribution and retailing costs of subsidized products;
3
The following budget realization numbers for 2007 are preliminary.
4
d) introduce an incentive/disincentive to electricity tariffs, with users at lower than average kwh per class enjoying a discount and those above average facing a penalty, thus increasing revenue and encouraging conservation;
e) accelerate the transfer from highly subsidized kerosene to less subsidized LPG;
f) limit subsidized kerosene purchases to poor households eligible for rice subsidies;
and,
g) possibly introduce a rationing system for premium gasoline and transportation
diesel, with the system administered by smart card technology.
Figure 16. Projected 2008 energy subsides dwarf other government spending programs
(trillions of Rupiah)
Figure 17. Most of the fuel subsidy goes to the highest spending households
(Percent of fuel subsidy absorbed by households)
0 60 120 180
Subsidies Capi tal investm ent Social assist ance
Elect icit y
Fuel
Source: Minist ry of Finance, 2008 RAPBN- P. Assum es oil at US$95.
0% 10% 20% 30% 40% 50%
1 2 3 4 5 6 7 8 9 10
Poor Househol d consum pt i on deci l e Rich
Source: World Bank calculations from Susenas 2007
The revised budget still provides for ambitious expansion in the government’s capital works programs. (Table 8). Projected capital spending is still almost 15 percent higher (share of GDP terms) than the realized figure for 2007 and. 2007’s realized capital spending was about 8 percent above 2006’s (share of GDP). If the government realizes the increase in capital spending initially budgeted, the central government would be responsible for a little under 9 percent of total construction activity in 2008.
Table 8. Central Government Fiscal Accounts
(Share of GDP)
2006 2007 2007 2008 2008
(Actual) (Budget)
(Preliminary
realization) APBN RAPBN-P
Revenues 19.1% 19.1% 18.7% 17.7% 19.6%
Non-oil domestic tax 10.6% 12.0% 11.3% 12.2% 12.3%
o/w Non-oil & gas income tax 5.0% 5.8% 5.1% 6.1% 5.8%
o/w VAT 3.7% 4.3% 4.1% 4.3% 4.6%
Oil & gas 6.0% 4.8% 4.5% 3.6% 4.6%
Other 2.5% 2.3% 3.0% 1.9% 2.7%
Expenditures 20.0% 20.2% 20.0% 19.4% 21.6%
Central Govt. 13.2% 13.4% 13.3% 13.1% 15.0%
Personnel 2.2% 2.7% 2.4% 3.0% 3.1%
Materials 1.4% 1.9% 1.4% 1.2% 1.3%
Interest Payments 2.4% 2.3% 2.1% 2.1% 2.1%
Subsidies 3.2% 2.7% 4.0% 2.2% 4.9%
Social Assistance 1.2% 1.4% 1.3% 1.6% 1.2%
Other Current 1.1% 0.5% 0.4% 0.7% 8.6%
Capital 1.6% 1.9% 1.7% 2.4% 2.0%
Transfers to Regions 6.8% 6.8% 6.7% 6.3% 6.6%
Primary Balance 1.5% 1.2% 0.8% 0.4% 0.1%
Overall Balance -0.9% -1.1% -1.3% -1.7% -2.0%
Net Financing 0.9% 1.1% 1.3% 1.7% 2.0%
Bonds 1.1% 1.1% 1.5% 2.1% 2.7%
Official finance -0.8% -0.4% -0.6% -0.4% -0.4%
Assumptions (actual for 2006):
GDP growth (%) 5.5% 6.3% 6.3% 6.8% 6.4%
Inflation (%) 8.0% 6.5% 6.6% 6.0% 6.5%
Exchange rate (Rp/US$) 9,141 9,300 9,140 9,100 9,150
Oil Price (US$/bbl) 64.00 63.00 69.69 60.00 83.00
7. The slowdown in the world economy and increasing risks make projecting outcomes for 2008 and 2009 more difficult than usual
Indonesia is expected to weather the global slowdown reasonably well, with growth slowing to 6.0 percent in 2008 before returning to 6.4 percent in 2009 (Table 9). These projections see export growth slowing from 8.0 percent in 2007 to 7.0 percent in 2008 but foresee domestic demand and especially investment and consumption remaining robust as the economy’s momentum carries into 2008. With higher international fuel prices and subsidies the budget deficit is projected to widen to over 2 percent of GDP with the debt-to-GDP ratio falling further to under 32 percent by the end of 2008 and continuing to decline through 2009.
Table 9: The base-case outlook for the Indonesia economy
2006 2007 2008 2009
GDP growth 5.5 6.3 6.0 6.4
NIA real export growth 9.4 8.0 7.0 8.6
Fixed investment growth 2.5 9.2 10.5 10.0
BOP Current account (% of GDP) 2.7 2.5 1.7 0.9
BOP Capital account (% of GDP) 0.7 1.4 1.3 1.6
Foreign reserves (Bill.$) 42.6 52.9 71.8 87.0
Central government bal. (% of GDP) -0.9 -1.3 -2.2 -2.1
Government debt (% of GDP) 39.6 34.4 31.9 30.3
CPI Inflation (%) 13.1 6.6 6.5 5.5
Key policy interest rate (1 m SBI) 12.0 8.0 7.5 7.25
There are, however, considerable downside risks. This outlook assumes a global downturn that is moderate and not of particularly long duration (see Table 1). It also assumes that world oil and food prices will, over the course of 2008, decrease from their current highs, even if not to 2006 levels. Under such a scenario, high commodity prices continue to provide incentives to expand output while vibrant domestic demand insulates growth from the downturn in overall world demand. But Indonesia remains vulnerable. And further increases in commodity and oil prices also pose risks if the fiscal and distributional effects are not managed properly.
Figure 18. Spreads on Indonesian government have widened recently, but only to 2005 levels
Index, January 2005=100
40 80 120 160 200
2005 2006 2007 2008
JP Morgan US Hi gh Yiel d Spreads
EMBI Global
I ndonesia Bond spread over US
Treasury
Source: Bloomberg, World Bank
Continued higher commodity prices, while driving Indonesian growth also pose risks, if the distributional and fiscal effects are not managed properly. High commodity prices have so far had a positive current account
impact, but adverse impacts on
inflation, the fiscal balance and income
distribution. From a distributional
perspective, the rise in food and fuel prices is a source of concern because food and energy account for three-quarters of household expenditure among low income groups, and if the adverse impacts of the price increases are not mitigated, there is the risk of social unrest.
PART II: UPDATE ON MICROECONOMIC AND SOCIAL SECTOR DEVELOPMENTS
1. Indonesia’s investment climate continues to improve but with some key areas of continued weakness
Business perceptions of Indonesia’s investment climate show some improvement in recent years, coinciding with the stronger growth of realized investment evident in
macroeconomic data. (Figure 19) The biggest perceived improvements as reported in
business surveys have been in macroeconomic stability and economic policy certainty. Corruption, weakness in the legal system, taxes and labor issues continue to rank high as obstacles to doing business. The only business environment indicators to have worsened in recent years are those related to infrastructure. Transportation, electricity and telecommunication were all perceived as more serious obstacles in 2007 than in 2005.
Figure 19. Infrastructure is the one aspect of the investment climate that is deteriorating
6
Percent of respondents reporting obstacle to be moderate, severe, or very severe License & Permits Central Government Crime Customs&Trade Regulation-National Customs&Trade Regulation-Regional License & Permits Local Government Labor Regulation Central Government
Surveys of foreign investors also show that perceptions of Indonesia are improving. Indonesia’s ranking in Japan’s annual JBIC survey of 600 Japanese multinational
companies improved in 2007 following four straight years of decline.5 Japanese
multinationals ranked Indonesia as the eighth most promising country for overseas business in 2007, up from ninth place in 2006. However this is still a low ranking compared to Indonesia’s fourth place position in 2002.
Implementation of the government’s comprehensive June 2007 economic policy package (Inpres 6/2007) may account for some of the improvement in perceptions of
5
Indonesia’s investment climate. Significant reforms have been initiated in tax administration, including the settlement of more than Rp 10 trillion in long outstanding VAT refunds to export companies and the start of a new system that promises refunds within 7 days for “golden” taxpayers, within two months for low risk exporters and within 4 months for medium risk exporters. Standard operating procedures for a complaint management system have been issued by the Director General of Tax, and a code of ethics for tax officials has been issued through a Minister of Finance decree supported by a Director General of Tax circular letter (SE-33/PJ/2007).
Customs reform also progressed with the implementation of paperless import clearance for priority lane companies at the main seaport, Jakarta’s Tanjung Priok.6 Imports by 100 large priority lane companies, who account for 15 percent of import declarations at Tanjung Priok, are subject only to post clearance audits, and import duties are paid periodically for multiple shipments rather than for each individual shipment, allowing fast port and customs clearance. Implementation of Indonesia’s National Single Window (INSW) for trade has also progressed, with initiation of a pilot project in Tanjung Priok in December 2007. The pilot project electronically links five different government agencies involved in import clearance, so that low risk importers can obtain a single clearance through the INSW rather than needing separate clearances from each
agency.7 Face-to-face contact between traders and officials is thereby reduced. Medium
and high risk importers will be brought into the INSW pilot in stages during 2008 and additional government agencies will be linked to the single window later in the year. Current plans are to link with five other regional economies in 2009 as part of an ASEAN Single Window.
The government announced a major reform to the procedures for establishing companies in Indonesia in September 2007. Prospective investors will no longer be required to open bank accounts and deposit their paid-in capital prior to legalizing a new company at the Ministry of Justice. They will instead be able to substitute a written statement from the company’s founders, directors and commissioners, or a joint account in the name of the founders. This will avoid the need to obtain a letter from a building manager, a Certificate of Domicile from a local government office, and a tax number, prior to establishing the new company, and will promote a transition from sequential to parallel processing of licenses and permits. The Ministry of Trade supported this reform by stipulating a three day time limit for issuing the business trading license (SIUP) and business registration certificate (TDP), required for all new companies. If fully implemented these reforms should cut several weeks off the time to start a company and reduce costs, thereby making it easier for small businesses to move from the informal economy to the formal sector. However, implementation delays by local governments, who are responsible for issuing most business licenses under regional autonomy (including the SIUP and TDP) could lessen the impact of these reforms.
6
Jakarta’s Tanjung Priok port accounts for approximately 60% of Indonesia’s international trade.
7
A new law on information and electronic transactions was passed by Parliament in March 2008. The law, which has been debated by Parliament since 2005, allows electronic records to be treated as legal evidence in court. This makes possible the elimination of paper (hardcopy) documentation, potentially removing one obstacle to eGovernment, paperless port and customs clearance, and paperless licensing and approval procedures. Paperless systems can eliminate the need for face-to-face meetings between applicants and officials. In March 2008 the Ministry of Finance also issued decree (PMK) no. 43/2008 allowing the treatment of assets at book value rather than market value during mergers. This will save companies from paying a hefty 30 percent tax on capital gain on assets revaluations. However, the decree applies only to publicly listed companies or to companies doing an initial public offering.
One area of continued major weakness in the investment climate is mining. No Contract of Work (CoW) for a major international mining investment has been signed for the past ten years. A recent survey of mining companies in Indonesia shows that investment in mining dropped from $2.2 billion in 1998 to $964 million in 2006, with a
particularly sharp drop in greenfield exploration spending.8 Global mining companies
rank Indonesia among the top ten destinations in the world in terms of its geological potential but tenth from the bottom (out of 64 countries/regions) in terms of its mineral policies. Major factors inhibiting mining investment include the slow pace of finalizing the draft mining law which has been stuck in Parliament for several years. The new law will likely abolish the Contract of Work mechanism that provided relative security for international investors for the past thirty years. Pending clarification about what will replace the Contract of Work, international investors are finding it difficult to negotiate new contracts. Other major issues of concern in the mining investment climate include conflicts between mining operations and forestry regulations, overlapping authority between central and local governments, and taxation issues. Failure to resolve these issues is causing Indonesia to largely miss out on a global wave of new mining investment in response to the surge in commodity prices.
In contrast to mining, investment in oil and gas is beginning to show some signs of recovery after several years of reduced activity. Data from the Directorate General of Oil and Gas indicate that at least 27 new production sharing contracts for oil and gas were signed through August 2007, up from an annual average of 11 during the period 2001-2006. Several new fields are expected to come into production over the next few years, including ExxonMobil’s Cepu field and others in South Sumatera, Maluku and Sulawesi. However some of the most promising discoveries are deep water fields that will take 7-8 years to develop. Even the Cepu field, which is onshore, is expected to produce very
little oil until 2011.9 Consequently the sharp decline in oil production over the past eight
years, which has seen output fall from 1.5 million barrels per day in 1999 to around than 900,000 in 2008, is likely to continue.
8
mineIndonesia 2007, PriceWaterhouseCoopers, December 2007.
9
2. The phenomenon of “jobless growth” may be easing and the manufacturing sector may be more dynamic than previously thought
Employment expanded strongly in 2007. (Table 10) Open unemployment declined sharply, to its lowest level since 2002. Employment increased by 4.5 million workers, while the labor force increased by 3.5 million people – the first increase since 2001. Employment growth was spread evenly across the formal and informal sector.
The expansion in employment is a reversal of the trend in previous five years when, despite substantial economic growth, Indonesia's labor market performance had been disappointing. Since 2002, real GDP has grown at 5 to 6 percent per year with moderate inflation. However employment growth has failed to match population growth and job creation in the formal sector has been slow. Furthermore, growth in real wages has stagnated since 2004. Open unemployment is only part of the problem. Perhaps more serious is the fact that over 40 percent of Indonesia’s labor force still derives its livelihood from low-productivity activities in agriculture and related areas, a share that has remained stubbornly high since the 1998 crisis. However, even on this front, in 2007 there were signs of progress, as the share of workers in agriculture declined.
Most of the increase in employment came from women who were previously unemployed or inactive. Employment increased by 1 million for men and 1.4 million for women. Unemployment fell by 2.6 percentage points for women, which is remarkable given a large 2.2 percentage point increase in female labor participation.
Constant real wages also contributed to the growth in employment. After inflation, minimum wages fell sharply, and wages overall remained generally constant. Wages rose
Table 10. Indonesia’s recent labor market performance
(percent)
Aug 06 Aug 07 Change
Unemployment rate 10.3 9.1 -1.2
Male 8.5 8.4 -0.1
Female 13.4 10.8 -2.6
Labor force
participation rate 66.2 67.0 0.8
Male 84.2 83.7 -0.5
Female 48.1 50.3 2.2
Percent of workers
Employees 28.1 28.1 0.0
Self-employed 55.0 54.6 -0.4
Unpaid family workers 16.9 17.3 0.4
Agriculture 42.0 41.2 -0.8
Industry 18.6 18.8 0.2
Services 39.4 40.0 0.6
slightly for agricultural laborers and construction workers, but fell moderately for hairdressers and housekeepers, as more women entered these labor markets (Table 11).
Table 11. Real wage growth
(year-on-year)
August 2005 August 2006 August 2007
Agricultural laborer 0.4% -3.1% 0.9%
Further progress will require changes to Indonesia’s labor market regulations, which deter job creation, but substantial reform to these regulations is likely to be postponed until after the 2009 elections. Attempts to reform labor laws in the first part of 2006 were aborted in the face of widespread political protests by labor unions, leaving the government reluctant to undertake extensive labor market reform until after the
elections.10 However, in the last month there has been some movement towards direct
bilateral discussions between APINDO, the main employers’ association, and several of the labor unions. It is still far too early to say whether these initial developments will eventually bear fruit, but they are at least worth noting in that they represent an effort to break through the political deadlock that has prevented progress thus far.
Figure 20. A better survey suggests strong growth in the number of firms since 1996, not
the decline initially estimated
(change in the number of firms, 1996-2006)
The manufacturing sector may be more dynamic than previously thought. The industrial survey (SI) has reported a declining number of firms over the past 10 years, but a more comprehensive recent survey suggests that the industrial survey has missed
about one-third of firms.11 For example
the survey in 2005 captured 20,403 firms, but this number is significantly less than the 2006 Census, which reported 30,356 firms. (Figure 20)
- 30%
In general the SI missed small firms with fewer than 50 employees and SMEs in labor intensive sectors: food processing and beverages, wearing apparel, textiles, tobacco processing, furniture, and non-metallic mineral products. Interestingly there does not appear to be significant change in the sectoral distribution of the industrial structure over
10
A comprehensive analysis of labor market issues in Indonesia is currently being prepared. A significant amount of attention will focus on documenting five important and discouraging trends in the labor market. These are: increasingly jobless growth, rising informality, stagnant wage growth, high youth unemployment, and persistent fragmentation.
11
the past 10 years (measured by number of firms), although there appear to be more small firms, and firms are relatively more concentrated in Central and West Java than previously thought. Labor intensive sectors together with machinery and engineering-based products experienced the largest growth in terms of number of firms. There are more larger firms than previously estimated not only in labor or natural intensive sectors but also in machinery and equipment.
3. There has been an increased focus on targeted programs for the poor and on monitoring and evaluation of such programs
The Government is expanding the National Community Empowerment Program and contributing to poverty alleviation efforts at the sub-district and village levels. The program currently covers approximately 68 percent of the urban cities and rural villages in Indonesia, with full coverage planned for 2009. The community empowerment program builds upon Indonesia’s accumulated experience with community driven development programs, in particular the World Bank funded Kecamatan Development Project (KDP) and Urban Poverty Project (UPP). These programs focus on improving local governance and service delivery at the sub-district and village levels, by encouraging participatory planning and providing block grants. Funds are generally used for economically productive infrastructure such as roads, bridges, irrigation, clean water sources or education and health related projects.
Indonesia’s first conditional cash transfer program is starting to deliver results. In July 2007, Indonesia began piloting a major conditional cash transfer program, Program Keluarga Harapan. The program is targeted at approximately 500,000 extreme poor families across seven provinces and will provide cash transfers to these families conditional on their fulfilling health and education objectives. To date the program has created and staffed a Central Program Management Unit and Sub National Program Management Units in each district of the program. Over 1,400 sub-district level facilitators have been hired to communicate to program beneficiaries and coordinate activities at the local level. Socialization activities have been carried out with all beneficiaries, and many beneficiaries have already begun fulfilling their obligations under the program, particularly in health. Early anecdotal evidence from the field that the program may be successfully changing the incentives and ability of poor households to access basic health services. One field mission was told by a local puskesmas (health clinic) worker that “we used to wait around for patients, but now the patients have to
wait for us”.
households eligible for a variety of future assistance programs. In addition to informing policy in Indonesia, a better methodology to target poor households has the potential to be a valuable learning tool for many anti-poverty transfer programs around the world.
The Government is gearing up for a strong monitoring and evaluation (M&E) agenda in Indonesia - a new planning and budgeting framework that focuses on evidence-based policymaking has been developed and is supported by new institutional arrangements and legal mandates. The Government of Indonesia (GoI) has recently established a Deputy for Performance Evaluation (DPE) in the National Development Planning Agency (BAPPENAS) as instructed by the new Development Planning Law, No. 5 2007. The general scope of its work aims at achieving four objectives:
i) to monitor and evaluate management, outcomes and impacts of key national
and regional programs;
ii) to provide a basis for decision-making on budgeting, planning and/or
implementation process;
iii) to promote accountability for resource use; and
iv) to document, provide feedback on, and disseminate lessons learned.
4. Recent developments in educational policy and programs
The Ministry of National Education (MONE) has taken a significant step in reducing the cost of education to households with its plan to provide textbooks for free over the internet. Through Ministerial Regulation No. 2, 2008 on the publication of educational books, the Government of Indonesia will buy the publishing (or copy) rights for educational books to be used at primary, junior secondary and senior secondary levels directly from the authors, thereby cutting the costs of a long supply chain. These books will be uploaded onto the internet in the form of e-books to allow teachers, students and parents throughout Indonesia free access to the materials. While internet penetration is growing rapidly it is still low and the cost of connecting to the internet is high, and this approach poses some challenges. Therefore in addition to the e-books, MONE will also authorize other institutions to publish copies of the above mentioned books/texts and for sale at controlled prices. According to paragraph 11 of the regulation, “school cooperative’s” may only sell books whose publishing rights are owned by the Government of Indonesia. While there has been some resistance from publishers the Governments’ efforts in supplying text books at reduced costs will make schooling more affordable
PART III: SPECIAL FEATURES ON INDONESIA’S LONGER-TERM DEVELOPMENT AGENDA
1. The impact of the conflict, the tsunami and reconstruction on poverty in Aceh12
The 2004 tsunami had a devastating impact on Aceh’s economy. Regional GDP declined by over 10 percent in 2005, and all major economic sectors (agriculture, manufacturing, construction) fell between 4 and 16 percent. Damage and losses were estimated at over US$4 billion, with important damage and losses in housing (US$1.4 billion), transport infrastructure (US$0.5 billion) and the productive sectors (US$1.2 billion). The global community, led by the Indonesian government, mobilized a reconstruction effort on an unprecedented scale for a developing country, with commitments reaching almost US$8 billion, enough to ‘build Aceh back better’.
Poverty in Aceh went up in the aftermath of the tsunami, from 28.4 percent in 2004 to 32.6 percent in 2005. (Table 12) This occurred against falling poverty levels in the rest of the country. This increase is relatively small, given the extent of damage and destruction caused by the tsunami and may reflect the beneficial effects of the relief and initial reconstruction effort. Poverty had fallen to 26.5 percent by 2006, below the pre-tsunami level, suggesting that the rise in pre-tsunami-related poverty was short lived and reconstruction activities and the end of the conflict most probably facilitated this decline. The poverty level in Aceh declined in 2006 at a point it rose in the rest of the country. Nevertheless, poverty in Aceh remains significantly higher than in the rest of Indonesia.
Figure 21. 2004 Aceh poverty by district
The provincial level poverty data mask important differences in poverty levels at the district levels. (Figure 21) District level poverty data show that areas with the highest poverty levels are in the rural interior and more remote districts, while areas around Banda Aceh have some of the lowest observed poverty levels.
The impact of the tsunami on poverty was not even across the province. Significantly larger increases in poverty occurred in the heavily tsunami-affected areas as well as areas, emerging from conflict. Analysis at the village level show that in 2005 households in those areas with high levels of tsunami damage and badly affected by the conflict
were significantly more likely to be poor than Source: BPS, 2004.
12
households in other areas. However, by 2006 there was no significant difference in poverty between areas directly affected by the tsunami and those unaffected. The impact of the conflict on poverty also seemed to have disappeared by 2006. (Table 13)
Table 13. Relative odds of poverty by kecamatan classification of high or low tsunami and high or low conflict, 2004-06
2004 2005 2006
High tsunami 0.83** 1.44*** 1.08
Low tsunami 1.00 1.00 1.00
High conflict 1.29*** 1.43*** 0.96
Low conflict 1.00 1.00 1.00
Note: Estimates include controls for household observables: age, gender, education, and occupation of household head as well as household size. These estimates are based on kecamatan in the kabupaten and exclude kecamatan in the kota (Banda Aceh, Sabang, Lhokseumawe and Langsa).
Source: BPS data and World Bank staff calculations.
Poverty in Aceh is predominantly a rural phenomenon, like in the rest of Indonesia, with over 30 percent of rural households living below the poverty line. This compares with less than 15 percent of poor households in urban areas. Other characteristics associated with higher poverty levels are larger household sizes, lower education levels, female-headed households and households that predominantly work in agriculture. The relationship between these characteristics and poverty remained relatively stable over the tsunami period suggesting that underlying determinants of poverty were unchanged despite the rapid socio-economic and political changes.
Aceh has experienced very low or negative growth rates for most of the past three decades, which could explain the relatively large poverty incidence in the province. (Figure 22) The main reason for this slower growth was the longstanding conflict affecting the province, although structural economic deficiencies also contributed to the economy’s poor performance. As a result, Aceh has poverty levels well above those seen in most other regions in Indonesia. High GDP per capita in Aceh, primarily the result of the large gas and oil reserves on Aceh’s east coast, has not translated into lower poverty levels. (Figure 23)
Figure 22. Aceh’s economy continued to decline after 1997
(Average annual growth rates)
Figure 23. Aceh is the only province where poverty continued to increase after 1999
(Poverty rates)
- 6% - 4% - 2% 0% 2% 4% 6% 8% 10%
AvGr86- 90 AvGr91- 95 AvGr96- 00 AvGr01- 05
I ndonesia North Sum at ra
Sum atra
Ace h 1997 Financial Cri sis
Source: BPS.
0 10 20 30 40 50 60
1993 1996 1999 2002 2004
Papua
Aceh
I ndonesia
North Sum at ra
West Java
Jakart a
Source: Susenas, 2004.
2. Investing in Indonesia’s health13
Indonesians are living longer and child mortality has fallen dramatically. Since 1960, Indonesian’s life expectancy at birth has increased from 40 years to 69, only slightly lower than China, Thailand or Turkey. In the same period, Indonesia has reduced
child mortality by more than a third and infant mortality by 25 percent (Figure 24).
Figure 24 Trends in key health indicators for Indonesia, 1960-2005
Source: World Development Indicators 2007
13