A LINE-BASED 3D ROOF MODEL RECONSTRUCTION ALGORITHM: TIN-MERGING
AND RESHAPING (TMR)
Jiann-Yeou Rau
Assistant Professor, Department of Geomatics, National Cheng Kung University,
No.1 University Road, Tainan City, Taiwan; Tel: (886)6-2757575 Fax: (886)6-2375764;
Email: [email protected]
Commission III, WG III/4
KEY WORDS: Photogrammetry, Three-dimensional, Building, Model, Geometry, Reconstruction,.
ABSTRACT:
Three-dimensional building model is one of the major components of a cyber-city and is vital for the realization of 3D GIS applications. In the last decade, the airborne laser scanning (ALS) data is widely used for 3D building model reconstruction and object extraction. Instead, based on 3D roof structural lines, this paper presents a novel algorithm for automatic roof models reconstruction. A line-based roof model reconstruction algorithm, called TIN-Merging and Reshaping (TMR), is proposed. The roof structural line, such as edges, eaves and ridges, can be measured manually from aerial stereo-pair, derived by feature line matching or inferred from ALS data. The originality of the TMR algorithm for 3D roof modelling is to perform geometric analysis and topology reconstruction among those unstructured lines and then reshapes the roof-type using elevation information from the 3D structural lines. For topology reconstruction, a line constrained Delaunay Triangulation algorithm is adopted where the input structural lines act as constraint and their vertex act as input points. Thus, the constructed TINs will not across the structural lines. Later at the stage of Merging, the shared edge between two TINs will be check if the original structural line exists. If not, those two TINs will be merged into a polygon. Iterative checking and merging of any two neighboured TINs/Polygons will result in roof polygons on the horizontal plane. Finally, at the Reshaping stage any two structural lines with fixed height will be used to adjust a planar function for the whole roof polygon. In case ALS data exist, the Reshaping stage can be simplified by adjusting the point cloud within the roof polygon. The proposed scheme reduces the complexity of 3D roof modelling and makes the modelling process easier. Five test datasets provided by ISPRS WG III/4 located at downtown Toronto, Canada and Vaihingen, Germany are used for experiment. The test sites cover high rise buildings and residential area with diverse roof type. For performance evaluation, the adopted roof structural lines are manually measured from the provided stereo-pair. Experimental results indicate a nearly 100% success rate for topology reconstruction was achieved provided that the 3D structural lines can be enclosed as polygons. On the other hand, the success rate at the Reshaping stage is dependent on the complexity of the rooftop structure. Thus, a visual inspection and semi-automatic adjustment of roof-type is suggested and implemented to complete the roof modelling. The results demonstrate that the proposed scheme is robust and reliable with a high degree of completeness, correctness, and quality, even when a group of connected buildings with multiple layers and mixed roof types is processed.
1. INTRODUCTION
Three-dimensional building model is one of the major components of a cyber-city and is vital for the realization of 3D GIS applications. The building model is essential for true-orthophoto generation (Rau et al., 2002), map revision, change detection, energy and property management, micro-climate and air pollution simulations, and many location-based services. In a photo-realistic city model, geometric building models are also required for the generation of façade and rooftop texture. Such models can be applied in virtual city tourism, urban planning, real-estate markets, smart cities, and among others. The generation of reliable and accurate 3D building models is crucial to accomplish the above mentioned goals.
Generally, the procedure for geometrical building modelling or city modelling encompasses three main steps, namely (1) recognition, (2) feature extraction, and (3) topology reconstruction with geometric modelling. Rather than automatic recognition, the most reliable and accurate results can normally be achieved by a building reconstruction system that integrates human-assisted visual interpretation capability (Gruen and Wang, 1998). For a fully autonomous system, the integration of multiple data sources, such as multiple aerial images, ALS data, and 2D ground plans, might increase the reliability and degree of automation, but some constraints or limitations in certain aspects are unavoidable. Examples include the capability of
handling a high density of built-up areas, occlusions from trees or neighbouring buildings, bad image quality due to shadows, weather conditions or digitized imagery, insufficient image resolution or point clouds density, miscellaneous objects on the rooftop, etc. (Brenner, 2000; Elberink and Vosselman, 2009).
The purpose of feature extraction is to retrieve 3D primitives of building structure from images or laser scanning data, including corners, ridges, eaves, faces, and so on. In the case of images, further image matching is required to perform space intersection from more than two images. Canny and Förstner operators are the two most commonly used methods in Computer Vision and Digital Photogrammetry for the purpose of extracting point- or line-based features, while the Hough Transform is often used for straight line detection after feature point detection.
In this study, we assume that the roof patches can be described by several planar regions and enclosed by roof structural lines digitized by manual stereo-measurement of a stereo-pair. An algorithm based on the derived structural lines for rebuilding roof polygons is thus proposed.
2.
METHODOLOGY
The TIN-Merging and Reshaping (TMR) algorithm is comprised of four main steps. The first one is a pre-processing step to repair any measurement errors in input structural lines or
imperfect results from feature extraction. This can include performing right angle rectification, line collinearity adjustment, snapping of dangles from shortening, and removal of overhanging dangles. The second step is to construct a Triangulated Irregular Network (TIN) using Constrained Delaunay Triangulation (CDT) (Chew, 1987; Kallmann et al., 2003), where the vertices of structural lines are adopted as points and the structural lines themselves are used for constraining the generated TINs. Two neighbouring TINs are iteratively merged by removing the shared edges that have no corresponding structural lines. The resultant roof topology is reconstructed in a 2D projection. Finally, we reshape the roof structure based on the rectified structural lines that contain the third dimensional information (Z) to infer 3D roof models.
2.1 Pre-processing
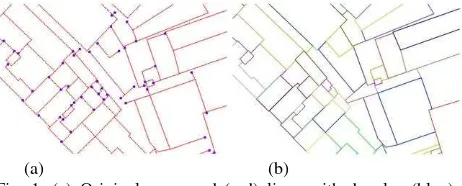
Since the imperfect generation of structural lines is unavoidable during the feature extraction stage or during manual stereo-measurement, it is necessary to correct them before the construction of TINs; otherwise some illegal TINs will be generated. Fig. 1(a) depicts several examples of such deficiencies, in which the red lines are the measured structural lines and the blue dots denote the detected dangles. For example, a rectangular building might be skewed, structural lines might pierce a wall or be disconnected from a neighbouring wall, two collinear-like lines might be distorted, multiple convergent lines might be detached, and so on. Meanwhile, when dangles exist, some illegal triangles will be generated and the topology reconstruction will fail. Thus, the pre-processing of detected lines has to be robust and rigorous in order to successfully reconstruct their topology. Fig. 1(b) shows the pre-processing results, i.e. rectified structural lines, where the dangles were removed successfully. This procedure can be performed fully automatically in the developed system after rational determination of several adopted parameters, such as and
for collinearity verification, the maximum dangle length, and the maximum rotation angle for right-angle rectification.
(a) (b)
Fig. 1. (a) Original measured (red) lines with dangles (blue); and (b) the generated polygons (each in a different colour).
2.2 Constrained Delaunay Triangulation
Delaunay Triangulation (Delaunay, 1934) is a well-known technique for constructing triangles from sparsely distributed points where there is no fourth point inside its circumcircle to avoid spear-like triangles. Using this technique unrelated points can be organized in such a way that neighbourhoods are connected with topology. Delaunay Triangulation is thus useful for topology reconstruction of unrelated points. In this study, the primitive for roof model reconstruction is derived from structural lines which have to be enclosed to define a polygon. The generated TINs cannot intersect or cross over the structural lines. The endpoints of the structural lines act as points for constructing TINs on the 2D horizontal plane but are constrained by the structural lines themselves using Constrained Delaunay Triangulation (Chew, 1987; Kallmann et al., 2003) to
avoid triangles crossing the structural lines. Fig. 2 illustrates the effect with and without applying the line constraint in the generation of TINs. Fig. 2(a) shows the input lines and Fig. 2(b) shows the generated TINs without the line constraint. One may notice that some created triangles have crossed over the original lines. Fig. 2(c) illustrates the results after applying the line constraint. It is obvious that the use of the line constraint for TINs generation can achieve reasonable and correct topology.
Fig. 2. Delaunay Triangulation with and without line constraints.
2.3 TIN-Merging
After the generation of TINs, the relationship among the structural lines is created. The TINs are described in convex hull. Some of them appear around concave building boundaries do not exist in the real world and should be removed in advance. Meanwhile, some shared edges between two TINs that do not exist should be eliminated as well. This can also reduce the volume of data storage and present rational roof models. The clue for the detection of existing edges is these rectified structural lines. We can merge two neighbouring TINs by erasing the shared edge that has no corresponding structural line. The TIN-Merging procedure is thus an iterative loop used to check for shared edges between two TINs (or polygons) to verify whether there is any overlap or collinearity between the shared edges and the rectified structural lines. If there is no corresponding line, the shared edges will be removed and those two TINs (or polygons) are merged as one polygon.
Fig. 3 shows an example of TIN-Merging. The CDT results are shown in Fig. 3(a). Fig. 3(b) is the result after applying TIN-Merging and Fig. 3(c) shows the result after removing the outer TINs that do not exist in the real world by checking if any corresponding 3D structural lines exist or not. It can be seen in Fig. 3(c) that there is a small roof surrounded by another, thus two additional pseudo edges (same location but different directions) are added to connect each other. The edge sequence numbers are denoted. Line numbers 8 and 13 are two pseudo edges that have no corresponding structural lines but are kept to describe this donut-type building. Since two polygons should not overlap after topology reconstruction, the inner polygon has to be encircled by the outer one. It means that the outer polygon has to be cut by the inner one resulting in a donut-type building. One may compare the 3D view in Fig. 3(d) for clarification.
Fig. 3. Example of the TIN-Merging process.
2.4 Reshaping
Before reshaping, recalling that all the above procedures are processed in two-dimensional space. This reshaping procedure utilizes the third dimensional information (Z) from the
endpoints of rectified structural line to infer the final shape of the roof structure. The basic idea behind constructing a roof shape (whether flat or inclined) from 3D lines is that two connected lines will have the same 3D coordinates at their joint and form a triangle. A triangle always located on a plane. The parameters of a planar function can thus be calculated by the vertices of the triangle.
In the beginning, all edges are classified as independent, shared or pseudo edges. The pseudo edges are created during the construction of Delaunay Triangulation as described in the previous section. An independent edge means that no neighbour polygon is connected, but a shared edge has. For example, edge numbers 9 to 12 in Fig. 3(c) are shared edges while the other edges (with the exception of edge numbers 8 and 13) are independent edges. The height value for an independent edge can be initialized and fixed by the Z-value of its corresponding 3D line terminals. On the other hand, the height value for the shared edges and pseudo edges can only be initialized, but is not yet fixed.
At the second stage, a coplanar verification process is applied for all edges within a polygon. This step is particularly essential for a roof that is taller than its surrounding roofs. In the previous stage they are assigned as shared edges, such as the inner roof depicted in Figs. 3(c) and 3(d) highlighted by the red numbers 0 to 3. If all the edges of this polygon are located on a plane, they will be classified as independent edges with fixed heights. It is worth noting that currently edge numbers 9 to 12 in Fig. 3(c) are still remained as shared edges. On the other hand, for a gable roof, the ridge lines are first considered to be shared edges. They will be considered as independent edges by applying this coplanar verification process. Fig. 4 illustrates a gable roof (the rightmost one) and a flat roof (the leftmost one) whose shape is determined at this procedure. In the figure, the independent edges are depicted in yellow and the shared edges in white. The shape of the gable roof in the middle and the small flat roof cannot be determined in the current stage, because the initial heights of the shared edges are assigned by its neighbourhood that is taller and will cause non-planar situation.
Fig. 4. Example of independent (yellow) and shared (white) edges.
The third step of reshaping is to search for the existence of independent edges within a polygon. Once more than two independent edges are found, the least-squares adjustment can be applied to calculate the plane equation for this polygon and to determine the heights of the other shared edges. These two independent edges can be connected or parallel to each other to form a triangle or a rectangle as long as they fall on a plane. The height value of the other shared edges will be adjusted and their attribute will be reassigned as independent edges. The smaller flat roof shown in Fig. 4 is an example of this case. Since three of the edges are independent, the height of the remaining shared
edge can be decided and fixed directly by least-squares adjustment.
2.5 Quality Control Tool
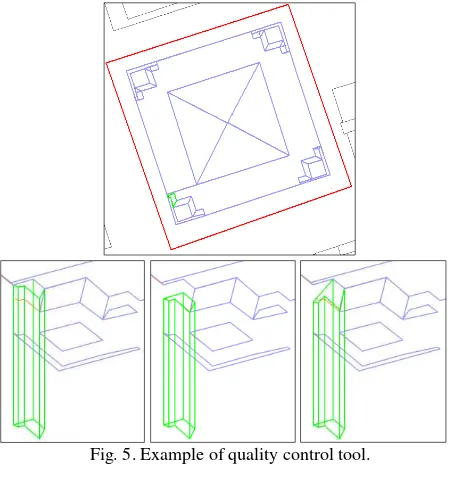
Since stereo-measurement error is possible and for the purpose of quality control, we develop an interactive reshaping tool for the verification and correction of reshaping errors. User needs to select one polygon and this function will estimate all possibilities and store them in the memory. The reshaping rules have described in the paragraph 2.4. User can continually press the middle button (wheel) of the mouse and any possible roof shape that stored in the memory will be pulled out and drawn on a 3D graphic view combine with original 3D structural lines for human inspection. Fig. 5 gives an example to demonstrate the quality control procedure, in which the bottom three sub-figures show three possibilities that the rooftop could be shaped and the final solution is determined by the operator. Since this procedure rely only the original 3D structural lines, if there is any error one may not be alerted. Thus, it would be better to incorporate with original stereo-pair to double check its correctness and completeness.
Fig. 5. Example of quality control tool.
3.
CASE STUDY
3.1 Study area
Five test datasets provided by ISPRS Comm. 3 WG III/4 “Test Project on Urban Classification and 3D Building Reconstruction” (Rottensteiner et al, 2012) located at downtown Toronto, Canada and Vaihingen, Germany are used for experiment, as shown in Fig. 6. Area 1 is a dense development region where consists of historic buildings having rather complex shapes, but also has some trees. Area 2 is characterized by a few high-rise residential buildings that are surrounded by trees. Area 3 is a purely residential area with small detached houses. Area 4 contains a mixture of low and high story buildings, showing various degrees of shape complexity in rooftop structure and rooftop furniture. Area 5 represents a typical example of a cluster of high-rise buildings in a modern mega city in North America. Detail information about the test dataset please refers
to the following web-site
http://www.commission3.isprs.org/wg4/.
(a) Area 1 (b) Area 2 (c) Area 3
(d) Area 4 (e) Area 5 Fig. 6. Study Areas
3.2 Data Source for 3D building reconstruction
The data provided by ISPRS Comm. 3 WG III/4 contains aerial images, exterior / interior orientation parameters, together with DSM from ALS data. However, this study use aerial images only and perform manual stereo-measurement of the roof structural lines from a digital photogrammetric workstation. In case of occlusion, the line terminal is inferred from any visible image as possible. The operators are all graduate students without experience or well training, thus the quality and accuracy might be defected and degraded.
3.3 Analyses
3.3.1 Topology Reconstruction
In the developed building model reconstruction algorithm, partial occlusion effect particularly those introduced by neighboured taller roofs can be automatic remedied by the pre-processing step. However, if the whole roof edge has missed, the topology reconstruction will be failed. For example, a church located in Area 4 has serious occlusion and invisible problem, as shown in the Fig.7 the southern part tower is located at the image boundary of Image ID 03557 and the northern face of the tower is occluded on Image ID 03755, thus it is impossible to perform whole roof edge delineation. Due to this issue the southern part of the church is not reconstructed, as shown in Fig.8.
Image ID : 03557 Image ID : 03755
Fig.7 Occlusion and invisible problems.
Fig. 8. The reconstructed Church.
3.3.2 Reshaping
Due to inexperience of the stereoscopic observation, the operators have introduced several vertical measurement errors that cause failure in reshaping. On average, automatic reshaping success rate for the whole dataset is about 85%; the other 15% are manually decided by changing the roof inclination through the cue of original 3D structural lines. Most of the failures occurred on Area 1 where roof structure and boundary shape is complex with varied heights.
3.3.3 Donut-type building
In our approach, a donut-type building will add two more pseudo edges for the outer building boundary. Two examples are shown on Figs. 3 & 5. This seems not compatible with standard 3D building models and in some 3D visualization software; it will cause fighting effect during rendering. However, it can be decomposed into a multi-layered building which refers to a building that has more than one roof on top of its rooftop, maybe two or three other roofs with different heights.
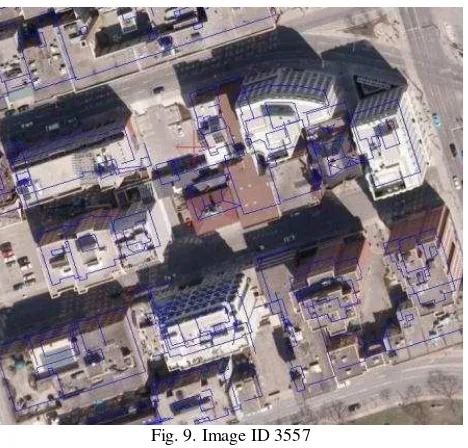
3.3.4 Exterior orientation problem
We utilize stereo-plotting for the measurement of roof structure lines from a stereopair (image ID. 3753 and 3755). The results were back-project from object space onto another stripe of stereopair (Image ID 3557 and 3559) but the results do not correctly project on its corresponding image features and looks like systematic error. The comparison is shown in the Fig.9.
Fig. 9. Image ID 3557
3.3.5 Overall Evaluation
The generated 3D building models are transferred into CityGML format and visualized using AutoCAD LandXplorer.
During the transformation, the DTM derived from ALS data (Shao & Chen, 2008) is used to extrude the façade geometry. The results for all five test areas are illustrated in Figs. 10-13.
Fig. 10. The generated 3D building model for Area 1.
Fig. 11. The generated 3D building model for Area 2 & 3.
Fig. 12. The generated 3D building model for Area 4.
Fig. 13. The generated 3D building model for Area 5.
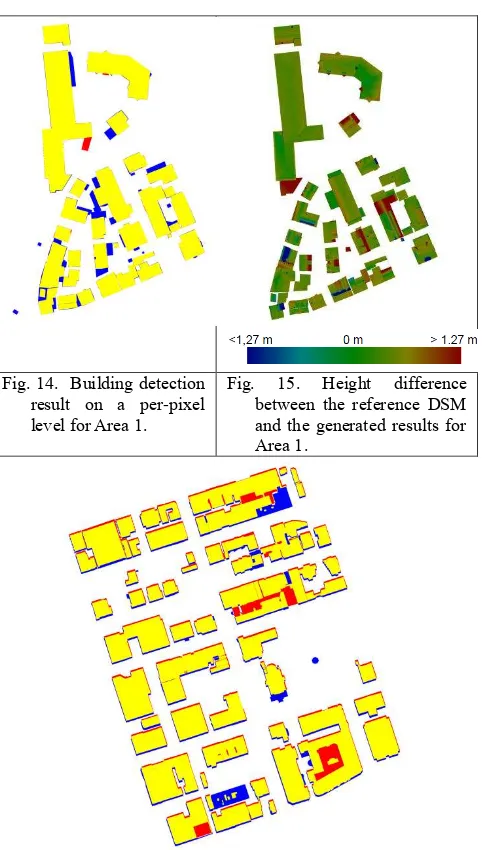
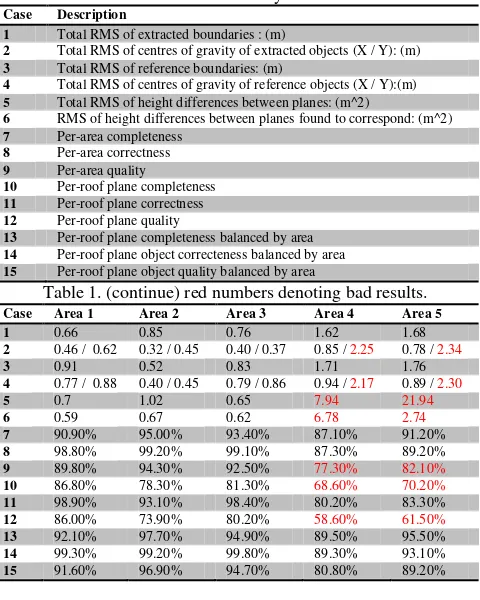
In the meantime, some statistics of accuracy, quality, correctness, and completeness evaluation (Rottensteiner et al, 2012) provided by the ISPRS WG III/4 “Test project on Urban Classification and 3D Building Reconstruction” using object-based evaluation (Rutzinger et al., 2009) are illustrated in Table 1 and some evaluation results are shown in Figs. 14-17.
Fig. 14. Building detection result on a per-pixel
level for Area 1.
Fig. 15. Height difference between the reference DSM and the generated results for Area 1.
Fig. 16. Building detection result on a per-pixel level for Area 4.
Fig. 17. Height difference between the reference DSM and the generated results for Area 4.
Figs. 14 & 16 are the building detection results on a per-pixel level. In which, Yellow is “True positive pixels”, Blue is “false negative pixels”, and Red means “false positive pixels”. From Fig. 16, it is noticed that there is a systematic bias on Y-direction. Meanwhile, Figs. 15 & 17 depict the height difference between the generated roof models and the reference ground truth. Again, in Fig. 17 a systematic height bias can be found. From Table 1, we observed that the planimetric bias on Y-direction is about 2.3 meters for Areas 4 & 5; while in the elevation is about 8 & 22 meters. Recalling the EOPs problem depicts in Fig. 9. It could be understood the source of the systematic errors. This is the same reason that introduces larger errors in cases 9, 10 and 12. Despite the EOP problem, the accuracy, quality, correctness and completeness for Area 1-3 are all high and acceptable for real application.
Table 1. Statistics of overall accuracy evaluation from ISPRS.
Case Description
1 Total RMS of extracted boundaries : (m)
2 Total RMS of centres of gravity of extracted objects (X / Y): (m)
3 Total RMS of reference boundaries: (m)
4 Total RMS of centres of gravity of reference objects (X / Y):(m)
5 Total RMS of height differences between planes: (m^2)
6 RMS of height differences between planes found to correspond: (m^2)
7 Per-area completeness
13 Per-roof plane completeness balanced by area
14 Per-roof plane object correcteness balanced by area
15 Per-roof plane object quality balanced by area
Table 1. (continue) red numbers denoting bad results.
Case Area 1 Area 2 Area 3 Area 4 Area 5
This paper presents an automatic building modelling technique for complex roof based on 3D structural lines derived from stereo-plotting. Except for several parameter setups, manual selection of area of interest (AOI), and quality control, the whole procedure is all performed in automatically. An innovative line-based 3D roof modelling algorithm called TIN-Merging and Reshaping is the core to rebuild the topology between roof structure lines and reshaping the roof type. The performance evaluation shows that an almost 100% success rate can be achieved with the proposed TIN-Merging step for 2D topology reconstruction, utilizing a high degree of incomplete manually measured 3D structural lines, provided that the roof boundary are well enclosed. However, the success rate for reshaping depends on the complexity of the roof structure. An average of 85% reshaping success rate is achieved for all five test areas. Human intervention is necessary but can be remedied easily by using the developed interactive reshaping tool that
utilizes original 3D structural lines for reshaping. The accuracy of the generated 3D roof models is determined by the aerial triangulation results and at the stage of manual stereo-plotting. From the ISPRS evaluation report, it demonstrates that in case no EOP problem, the accuracy, quality, correctness, and completeness are all high and acceptable for real operation. The proposed algorithm is a line-based 3D roof modelling procedure which is suitable for integration with a digital photogrammetry workstation for 3D topographic mapping. Allg.html (in German). This research was financially supported by the National Science Council, Taiwan (Project # NSC 96-2628-E-006 -257 -MY3). Many thanks go to Mr. Bo-Cheng Lin for his assistance in programming and Prof. Shao for the generation of DTM from ALS data.
REFERENCES
Brenner, C., 2000. "Towards fully automatic generation of city models." International Archives of Photogrammetry and Remote Sensing, 33, B3/1; PART 3, 84–92.
Cramer, M., 2010. The DGPF test on digital aerial camera evaluation – overview and test design. Photogrammetrie – Fernerkundung – Geoinformation 2(2010):73-82.
Chew, L. P., 1987. "Constrained delaunay triangulations." Proceedings of the third annual symposium on Computational geometry, Waterloo, Ontario, Canada, 215-222.
Delaunay, B., 1934. "Sur la sphère vide, Izvestia Akademii Nauk SSSRSur la sphère vide, Izvestia Akademii Nauk SSSR." Otdelenie Matematicheskikh i Estestvennykh Nauk, 7, 793-800.
Elberink, S. O., and Vosselman, G., 2009. "Building reconstruction by target based graph matching on incomplete laser data: analysis and limitations." Sensors, 9, 6101-6118.
Gruen, A. and Wang, X., 1998. "CC-Modeler : a topology generator for 3-D city models 1." ISPRS Journal of Photogrammetry & Remote Sensing, 53, 286-295.
Kallmann, M., Bieri, H., and Thalmann, D., 2003. "Fully dynamic constrained delaunay triangulations." In Geometric Modelling for Scientific Visualization, G. Brunnett, B. Hamann, H. Mueller , Eds. , Springer-Verlag, 241-258.
Rottensteiner, F., Sohn, G., Gerke, M., Baillard,C., Benitez,S. & Breitkopf, U., 2012, "The ISPRS Benchmark on Urban Object Classificatin and 3D Building Reconstruction", Proceedings of ISPRS 22nd Congress (WG III/4), (to be published).
Rutzinger, M., Rottensteiner, F. Pfeifer, N., 2009. A comparison of evaluation techniques for building extraction from airborne laser scanning. IEEE Journal of Selected Topics in Applied Earth Observations and Remote Sensing 2(1):11-20.
Shao, Y. C., and Chen, L. C., 2008. Automated Searching of Ground Points from Airborne LIDAR Data Using a Climbing-and-Sliding Method, PE & RS. Vol. 74, No. 5, pp. 625-635.