The National Risk and
Vulnerability Assessment 2005:
Afghanistan
The National Risk and Vulnerability Assessment 2005: Afghanistan. Ministry of Rural Rehabilitation and Development
and the Central Statistics Office, Kabul.
© 2007 ASA Institut für Sektoranalyse und Politikberatung GmbH Marie-Curie-Strasse 5
D-53359 Rheinbach Germany
All rights reserved.
The material in this work is copyrighted. Copying and/or transmitting portions or all of this work without permission may be a violation of applicable law.
Presentation
It is our great pleasure to present the National Risk and Vulnerability Assessment (NRVA 2005). The Assessment surveyed 30,822 households amongst Kuchi, rural and urban dwellers, the largest household survey ever conducted in Afghanistan. This Assessment, managed by Afghans, is a landmark in the reconstruction of our country in the post-Taliban era.
This document includes national and provincial household perceptions of health care, housing, access to information, agricultural constraints, shocks and attitudes, past programme participation and intervention preferences. It also contains quantifiable data on demographics, electricity, drinking water and sanitation, agriculture, livestock, dietary diversity and the Millennium Development Goals.
EUROPEAN UNION
DELEGATION OF THE EUROPEAN COMMISSION TO AFGHANISTAN
NRVA 2005
The European Union represented by the EC Delegation supports the Government of Afghanistan, in particular the Ministry of Rural Rehabilitation & Development and the Central Statistical Office in a range of areas. One of the important EU projects is the
'Provision of Technical Assistance to the Ministry of Rural Rehabilitation and Development for further development of a national poverty, vulnerability and food security surveillance system’
This project with a total cost of 3.5 million euros supports the Vulnerability Analysis Unit (VAU) at KIRRD and the National Surveillance System (BISS) Unit at CSO. The overall objective of the EU support is the reduction of poverty levels in Afghanistan, by generating information which contributes to improved policy development and programming
This report presents the main findings from the National Risk and Vulnerability Assessment 2005 (NRVA 2005) which was implemented by the VAU and NSS-Units. For the first time it provides a representative and in-depth overview an the actual situation of rural and urban people in Afghanistan. This information is crucial for the development of refined policies for the Afghan National Development Strategy (ANDS) and several other Government policy reforms and programmes. Furthermore, the NRVA-2005 data base and analysis forms the basis for poverty and vulnerability analysis by international organisations and donors.
I am also glad to announce the publication of the NRVA Database on an interactive website http://www.nss-afghanistan.com which will allow a broad audience to extensively utilise the valuable data of the NRVA-2005.
Contents
List of Tables ...vi
List of Figures ...viii
List of Acronyms...ix
Acknowledgments ...x
1. Introduction ...1
2. The 2005 Assessment...3
2.1. Objectives...3
2.2. Methodology ...3
2.2.1. Instruments ...3
2.2.2. Sampling ...4
2.2.3. Data collection and analysis ...5
2.3. NRVA 2005 in relation to NRVA 2003 ...7
2.4. Note to the reader...8
3. Socio-economic situation ...9
3.1. Population...9
3.2. Education...11
3.2.1. Literacy ...11
3.2.2. School attendance ...14
3.3. Access to information ...16
3.4. Health care ...17
3.5 Housing and services ...19
3.5.1 Housing...19
3.5.2. Drinking water and sanitation...24
3.5.3. Electrical power and other sources of energy...30
3.6 Household asset ownership ...36
3.7. Household income and credit ...37
3.8. Agriculture and livestock...41
3.8.1. Land tenure...41
3.8.2. Agricultural production ...42
3.8.2.1. Garden plots...42
3.8.2.2. Irrigated land ...43
3.8.2.3. Rain fed land ...45
3.8.2.4. Poppy cultivation ...46
3.8.3. Livestock ...46
3.8.4. Inputs ...49
3.9 Transportation and access to markets ...51
3.10. Expenditure ...52
4. Risk and vulnerability, perceptions of risk and well-being ...53
5. Past programme participation ...61
5.1. Cash for work ...61
5.2. Food aid and food for work...62
6. Dietary diversity and food security profiling ...64
6.1. Food consumption classification...64
6.2. Food security profiling ...64
7. Intervention preferences and priorities: Shuras’ viewpoint ...69
8. Millennium Development Goals...71
9. Summary and recommendations ...73
References...83
List of Tables
Table 1: Age categories of population...9
Table 2: Overall literacy rates (%) in Afghanistan for 6 years old and above ...11
Table 3: Literacy rate among 15-24 years old population ...13
Table 4: Net enrolment (%) in primary education (6 to 13 years old)...14
Table 5: Most important sources of information (%) ...16
Table 6: Contraceptive methods used by married woman in the households up to age 49, out of those using any of these methods ...19
Table 7: Types of housing (%) ...20
Table 8: House acquisition...21
Table 9: Evidence of ownership (%) ...21
Table 10: Outstanding debt on housing (%)...22
Table 11: Housing condition (%) ...23
Table 12: Ownership of second dwelling (%)...23
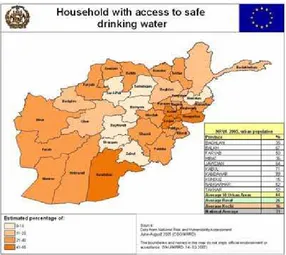
Table 13: Households with access to safe drinking water ...24
Table 14: Households paying for current main source of drinking water ...26
Table 15: Average monthly payment for drinking water...26
Table 16: Time required to the nearest water source ...27
Table 17: Household use of alternative sources of water (%)...28
Table 18: Availability of toilets in households (%) ...29
Table 19: Toilet facilities located in within the compound ...30
Table 20: Households that have access to any type of electrical power at some time during the year ...31
Table 21: Access to public supply grid...31
Table 22: Main source of cooking fuel in the summer and winter (%) ...32
Table 23: Sources of fuel for heating in the winter (%) ...33
Table 24: Sources of lighting (%) during the summer and winter ...35
Table 25: Household assets (%) ...36
Table 26: Availability of internet, computer and telecommunications (%)...37
Table 27: Sources of income (%) by groups ...38
Table 28: Seasonal and permanent migrants within and outside Afghanistan ...39
Table 29: Frequency in reception of remittances by households (%) ...39
Table 30: Loans taken by Kuchi, rural, urban households (%) during the last year ...40
Table 31: Main use of largest loan (%) ...40
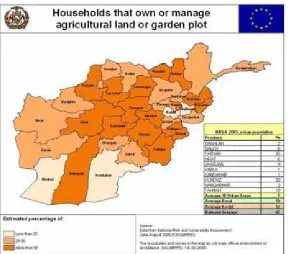
Table 32: Households owning or managing agricultural land or garden plot ...41
Table 33: Ownership or management (%) of garden plots ...42
Table 34: Most important crops (%) in garden plots* ...43
Table 35: Irrigated land among those engaged in agriculture...43
Table 36: Type of ownership or management of irrigated land among households engaged in irrigated agriculture (%)...44
Table 37: Most important crops (%) on irrigated land*...44
Table 38: Type of ownership or management of rain fed land among households engaged in rain fed agriculture (%)...45
Table 40: Most important crops (%) in rain fed land ...45
Table 41: Households (%) owning different types of livestock or poultry...47
Table 42: Livestock and poultry ownership (*10,000) ...47
Table 43: Average herd or flock size * ...48
Table 44: Average number animals by households ...48
Table 45: Use of solid waste and mineral fertilizer by households (%)...49
Table 46: Use of pesticide...50
Table 47: Distance of communities to the nearest road (km)...51
Table 48: Change of road access in the last three years (%) ...51
Table 49: Traffic increase by type of transportation (%) ...51
Table 50: Frequency (%) of shocks during the last year ...53
Table 51: Income diversification...57
Table 52: Households within the one income group ...57
Table 53: Household income from two sources (%) ...58
Table 54: Recovery from shocks (%) ...59
Table 55: Perceived economic situation of households compared to last year (%) ...59
Table 56: Households with problems satisfying their food needs (%)...60
Table 57: Participants in cash for work programmes (%) ...61
Table 58: Perceived benefits in cash from work programmes (%)...62
Table 59: Perceived benefits of infrastructure from cash for work programmes (%) .62 Table 60: Perceived benefits (% frequency) of food aid programmes ...63
Table 61: Perceived benefits (%) of infrastructure in food aid programmes ...63
Table 62: Clusters for households with low dietary diversity and very poor food consumption...65
Table 63: Clusters for households with low dietary diversity and poor food consumption...65
Table 64: Clusters for households with low dietary diversity and slightly better food consumption...66
Table 65: Clusters for households with better dietary diversity and better food consumption...66
Table 66: Population (%) below minimum level of dietary energy consumption adjusted by age and gender (NRVA 2005) ...68
Table 67: Preferences and priorities (from 1st to 5th) of intervention ...69
List of Figures
Figure 1: Percent of population by age ...9
Figure 2: Proportion of females and males in groups of age above 24 years...10
Figure 3: Literacy rate, females and males (6 years old and above) ...12
Figure 4: Literacy rate, females (6 year old and above)...12
Figure 5: Net enrolment in primary education, both sexes (6-13 years old) ...15
Figure 6: Net enrolment in primary education, girls (6-13 years old) ...15
Figure 7: Married women in the households up to age 49 with knowledge of how to avoid pregnancy...17
Figure 8: Condom use as contraceptive method by married women ...18
Figure 9: Households with access to safe drinking water ...25
Figure 10: Households with access to safe toilets ...29
Figure 11: Sources of electrical power in Afghanistan ...30
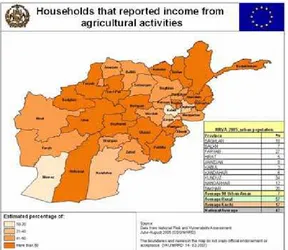
Figure 12: Households that reported income from agricultural activities ...38
Figure 13: Households owning or managing agricultural land or garden plots ...42
Figure 14: Households experiencing drinking water shocks (last 12 months) ...55
Figure 15: Households experiencing insecurity as shock (last 12 months) ...55
Figure 16: Households experiencing idiosyncratic shocks (last 12 months)...56
Figure 17: Households that perceived themselves not to be food insecure...60
Figure 18: Population consuming a diet with low food diversity...67
List of Acronyms
CSO Central Statistics Office
DAP Di-ammonium phosphate
EC European Commission
EU European Union
FAAHM Food, Agriculture and Animal Husbandry Information Management and Policy Unit, MAAH
FAO Food and Agriculture Organization of the United Nations FEWS NET Famine Early Warning Systems Network
GIS Geographic Information Systems
GOA Government of Afghanistan
HIV/AIDS Human immunodeficiency virus/acquired immunodeficiency syndrome
IIHMR The Indian Institute of Health Management Research INGO International Non-governmental Organization
JHUBSPH The Johns Hopkins University Bloomberg School of Public Health
MAAH Ministry of Agriculture and Animal Husbandry
MICS Multiple Indicator Cluster Survey
MDG Millennium Development Goal
MOPH Ministry of Public Health
MRRD Ministry of Rural Rehabilitation and Development
NGO Non-governmental Organization
NMAK National Multi-Sectoral Assessment on Kuchi NRVA National Risk and Vulnerability Assessment
NSS National Surveillance System
RAMP Rebuilding Agricultural Markets Program
UN United Nations
UNDP United Nations Development Programme
UNESOC United Nations Economic and Social Council UNICEF United Nations Children’s Fund
UNODC United Nations Office on Drugs and Crime UNOPS United Nations Office for Project Services
USAID United States Agency for International Development
USGS Unites States Geological Survey
VAM Vulnerability Analysis and Mapping Unit, WFP
VAU Vulnerability Analysis Unit, MRRD
Acknowledgments
The National Risk and Vulnerability Assessment 2005 was the result of the concerted effort and dedication of the Afghan Government and its staff together with partners from the international community and non-governmental organizations. Inside the country and abroad there are an increasing number of institutions eager to better understand the constraints faced by the Afghan people in rural and urban areas, as well as those of the nomadic Kuchi, and to identify factors that could further enhance their social and economic recovery in the post-conflict era.
The Central Statistics Office (CSO) and the Vulnerability Assessment Unit (VAU) within the Ministry of Rehabilitation and Rural Development (MRRD) have taken the reins of the biannual assessment with significant financial support from the European Commission (EC) as part of the National Surveillance System (NSS) Project. Within this EC-funded project a team of highly motivated Afghan and international specialists took the main burden in implementing the NRVA, putting the data-base together and preparing the analysis. The team at MRRD is led by Amanullah Assil and Gulalai Habib. The CSO team is headed by Tariq Wardak and Abdullah Fakhri. Below an actual list of the project team is provided. The project is supervised by Matin Behzad, Rural Development & Food Security Advisor European Commission Delegation to Kabul.
The Famine Early Warning Systems Network (FEWS NET) and the United States Agency for International Development (USAID), also contributed to the completion of this report.1 Abelardo Rodriguez significantly supported the NSS team in preparing the draft report.
The Vulnerability Analysis Mapping Unit (VAM) of WFP continues to collaborate with the CSO and MRRD teams in characterization of diets and food insecure groups. WFP/VAM generously contributed in the design, implementation, supervision training and analysis of NRVA-2005, donated electronic equipment and provided financial support for the team of enumerators. Technical contribution of WFP enabled the Government of Afghanistan to embrace this assessment. This type of collaboration is one of several others with technical teams from FAAHM and MAAH, MOPH, UNDP, UNICEF, The Asian Development Bank and The World Bank that have improved the skills of staff at CSO and MRRD to address food security, human development and poverty issues. We are thankful to all of them for their constant support.
The enthusiasm and cooperation of 30,822 households surveyed in 2005 is gratefully acknowledged and it is hoped that their collaboration will soon be reciprocated with more effective development interventions that will reduce their vulnerability and risks. Men, women and children kindly hosted the NRVA enumerators; local authorities were also instrumental to ensure coordination and security during the survey implementation.
The senior management at CSO/MRRD provided constant support for the implementation of NRVA in different stages. Without their support it would have been impossible to implement such a Herculean endeavour.
1
The Ministry of Agriculture, the Ministry of Education, the MRRD, the Ministry of Women Affaires and the Central Statistic Office are acknowledged for their support in provision of female and male enumerators at national and provincial level.
The NSS project and NRVA-2005 were implemented under the guidance of Dr. Andrew Pinney, who was the team leader during NRVA 2005 implementation.
650 female and male enumerators have carried out the survey work in NRVA 2005 and enabled us to benefit from the large data set, which is a guiding tool for most of the government development programmes.
NSS (National Surveillance System) Staff Contact Address
S.N Name Position Phone No Email Address Office address
Local NSS-Team at the Ministry of Rural Development and Rehabilitation
1 Amanullah
0700 264 086 [email protected] MRRD/VAU
4 Ghulam
Sediq Senior Analyst 0799423787 [email protected] MRRD/VAU
5
Hakeem Analyst 070200227 [email protected] MRRD/VAU
7 Salima
Rahimi Analyst 0799094956 [email protected] MRRD/VAU
8 Mohibullah
Noor Driver 0799566624 [email protected] MRRD/VAU
Local NSS-Team at the Central Statistical Office
9 Tariq
Analyst 070017798 [email protected] CSO/NSS
12 Obaidullah Senior
Analyst 0799307860 [email protected] CSO/NSS
13 Khalid Analyst 70484905 [email protected]
[email protected] CSO/NSS
14 Farhad Analyst 070239281 [email protected]
Local NSS-Team at the Central Statistical Office
15 Mohd.Sadiq Analyst 070049514 [email protected]
[email protected] CSO/NSS
16 Ahmad
Fawad Driver 070085752 [email protected] CSO/NSS
International Experts supporting the local NSS-Team
17 Andrew Pinney
Team Leader (left in 05/2006)
023 996 543
016 570 318 [email protected] NSS
18 Aiso Vos Technical
Responsible Task Manager at the Delegation of the EC in Kabul
22 Matin
Significant Contributions to NRVA implementation and the preparation of this report were provided by:
Amanullah Assil
Team leader
National Surveillance System/Vulnerability Analysis Unit
Ministry of Rural Rehabilitation and Development (main building) Darul Aman, Nila Bagh Road, Kabul, Afghanistan
Mobile phones: +93.70.214.164, +93.79.341.719
Email:[email protected] / [email protected]
Shahim Ahmad Kabuli
Senior Analyst
National Surveillance System/Vulnerability Analysis Unit
Ministry of Rural Rehabilitation and Development (main building) Darul Aman, Nila Bagh Road, Kabul
Mobile phones: +93.700.264.086, +93.777.264.086
Email:[email protected] / [email protected]
Ahmad Shah Shahi
Programme Officer
Vulnerability Analysis Mapping Unit World Food Programme
Office Tel: + 93.70.282.817.26 Ext. 2477 Mobile phone: +93.70.284.069
WFP-VSAT: 1331-2477
E-mails:[email protected] / [email protected]
Fazal Karim Najimi
Country representative
Famine Early Warning Systems Network (funded by USAID) Ministry of Rural Rehabilitation and Development (main building) Darul Aman, Nila Bagh Road, Kabul, Afghanistan
Mobile phone: +93.799.491.570, +93.70.156.060 Email:[email protected]
The final editing and proof reading of the report were done by Fedor Böhmert and Veronika Greuel from ASA Institute.
Key Findings and Recommendations
The NRVA 2005 was the second national exercise in data collection on risk and vulnerability factors that affect the Afghan population. The main objective of NRVA 2005 was to gather information to update and guide policy-making decisions in development programmes and to improve the efficacy of sectoral interventions. Between June and August of 2005, a national survey was carried out with a sample of 30,822 households in 34 provinces (1,735 Kuchi, 23,220 rural and 5,867 urban).
Data shows that the female to male ratio starts to decline above 24 years of age. There are higher mortality rates for women above 24 years of age compared to those rates of men in the same age groups. This appears to be related to the cumulative effect of disadvantageous conditions for women; such as lack of health facilities and practices, poor nutrition and frequency of marriages of girls under 15 years of age. In contrast to its neighbours, Afghanistan presents a gender gap that favours male survivals. This situation prevails, even after years of war in which male mortality would typically be higher than female mortality. Access to education, provision of health facilities and professional attention in rural areas deserve a high priority to rectify this situation. A demographic and public health study should assess these findings as soon as possible.
Surprisingly, only 2% of the rural and urban households reported having disputes about property rights. Further investigation is required to clarify this finding considering that contested property rights are expected in post-conflicts. Clear property rights are necessary, but not sufficient by themselves, for sustainable resource management.
Seventy-three percent of the households in Afghanistan perceive that they are in a comparable or worse situation with respect to one year prior to the survey. Twenty-four percent perceive being slightly better off and only 2% perceive a clear improvement. The urban households had 5% to 6% more optimistic perceptions compared to rural and Kuchi households, respectively.
Forty-four percent of the Afghan households perceive themselves as food insecure to different degrees, 28% of the urban households perceive themselves to be food insecure while in contrast, 40% of the Kuchi households and 48% of the rural households perceive this condition. These perceptions are in agreement with other findings. Out of the largest loans granted to the households during the year prior to the survey, 45% of the urban households used them to purchase food, and about 65% of both Kuchi and rural households also used them to cope with food insecurity. Further research is recommended to assess food insecurity and vulnerability of different groups and locations.
Fifty percent of the participating households in cash for work programmes in Uruzgan acquired income generating skills and to a lesser extent in Balkh, Kandahar, Takhar and Nangarhar. These cases, clearly aimed towards financial sustainability, could be extended or intensified.
It is essential to establish cause-effect relationships with quantitative socio-economic indicators, qualitative perceptions, and covariate and idiosyncratic shocks to fine-tune recommendations for Kuchi, rural and urban households. Contextualization based on some of the variables included in the NRVA data set would allow better and more effective programme implementation. The NRVA enables estimation of risk and vulnerability, and as a consequence provides a richer framework for risk mitigation.
1.
Introduction
In 2003 the government of Afghanistan launched a unique national assessment to support the development work of different government and non-government organizations working in different sectors. Prior to this assessment, most of these organizations were doing their own surveys based on their demands. The World Food Programme (WFP) of the United Nations was managing a nationwide assessment and collecting information on food security, and there was a wish among the development community to have an improved methodology for nationwide assessments. A workshop was held in Mazar-e-Sharif in April 2003 to design a Nationwide Assessment based on government decision and stakeholder demand, and the outline of a questionnaire for the 2003 survey was prepared. This questionnaire was further developed jointly by the WFP and the Vulnerability Analysis Unit (VAU) within the Ministry of Rural Rehabilitation and Development (MRRD).
The National Risk and Vulnerability Assessment (NRVA) 2003 was implemented between July and September of 2003 lead by WFP and supported by the Vulnerability Analysis Unit (VAU) of the Ministry of Rehabilitation and Rural Development (MRRD). A workshop was held in June 2004, in which some preliminary results of the 2003 were discussed and recommendations were made for the NRVA 2005.
The First Phase of the National Surveillance System (NSS) project was launched in September 2003 by MRRD, with financial support of the European Commission and the United Nations; the objective of NSS was to lead and coordinate, among NGOs and government agencies, the efforts to monitor the situation in the country. A final report of NRVA 2003 was released on December 2004. A consumer satisfaction survey was carried out at the end of 2004 to ascertain the extent of use of NRVA-2003 data and to collect demands for data for the NRVA 2005 from different governmental and non governmental organizations.
Preparatory work for the NRVA 2005 was underway in the spring 2005, coinciding with the beginning of the Second Phase of the National Surveillance System (NSS) Project, of which both the Central Statistic Office (CSO) and MRRD are the implementing agencies. While CSO leads on data gathering and its custody MRRD helps on survey implementation, analysis and interpretation, as well as dissemination of findings. The goal of the NSS project is to reduce poverty in Afghanistan and it has four objectives: to conduct nationwide assessments such as the NRVA, to conduct emergency assessments and response to protect deterioration of people’s livelihoods (early warning systems), to carry out special studies upon demand, and to contribute to the capacity building of government staff.
2005 is statistically representative at provincial and national level while NRVA 2003 is not); however, NRVA 2005 but sets a baseline that can be used for future assessments, such as the NRVA 2007 and others to follow. As it will be shown here, NRVA 2005 is a forward-looking instrument that has been used to develop the capacities of the national staff at CSO and MRRD in reference to Millennium Development Goals. Household quantitative data form the building blocks that support this report. These blocks are complemented with both the perceptions of shura assemblies and perceptions of households.
Preparatory arrangements for the NRVA 2007 are underway and it is expected that all lessons learnt during the implementation and analysis of NRVA 2003 and 2005 will built a cornerstone in the planning and implementation of NRVA 2007. In particular it is currently discussed to randomly distribute the upcoming NRVA samples into 12 months rather than to carry out a whole assessment in one season of the year. This shall ensure a further significant reduction of non-sampling errors in the field.
2.
The 2005 Assessment
The assessment takes into account a series of recommendations made by several stakeholders during a workshop held in June 2004 when the preliminary NRVA 2003 results were discussed. The assessment includes urban households allowing a more comprehensive appreciation of the status of the country in the summer of 2005.
2.1. Objectives
The primary objective of NRVA 2005 is to collect information at community and household level to better understand livelihoods of Kuchi (nomadic pastoralists), rural and urban households throughout the country, and to determine the types of risks and vulnerabilities they face. National and international stakeholders can benefit from the summarized findings of the report or the data set made available for in-depth analysis to develop strategies to address the short, medium, and long-term needs of the nomadic, rural and urban populations through better informed and timely policy development and intervention strategies.
2.2. Methodology
2.2.1. Instruments
The core of NRVA 2005 is being formed by the household questionnaire. The household questionnaire consisted of the following 18 sections; the first 14 were answered by the male head of household or male respondent, and the last four by the female members of the household:
x Household register and education;
x Housing;
x Household facilities;
x Drinking water;
x Assets and credit;
x Livestock;
x Agriculture and land tenure;
x Migration, remittance and social networks;
x Sources of income;
x Households expenditures;
x Cash for work;
x Food Aid and iodized salt;
x Household shocks and coping strategies;
x HIV/AIDS;
x Food consumption;
x Maternal child health;
x Children 0 – 59 months;
The total number of questions that were asked to the sampled households exceeded 260 but not all questions were answered because some of them were eliminated based on the responses provided (with skipping rules). The household is regarded as the unit of analysis. In Afghanistan there is a need to address the questions to males and females depending on their nature. In every sampled community 12 households have been interviewed. On average the time required to answer the household questionnaire was less than two hours. Besides the household questionnaire, information was gathered at community level. Therefore, two community questionnaires were designed – one male and one female. These two questionnaires addressed the following topics:
Maleshura questionnaire Femaleshura questionnaire
Community information;
A sample of 30,822 households from 34 provinces (1,735 Kuchi, 23,220 rural and 5,867 urban) was drawn excluding 6 districts that were not enumerated (as CSO household listing data was not available at the time of sampling the Livestock Census [FAO, 2003] data was used). Twelve districts were enumerated only by male surveyors in all Zabul (11 districts) and Maruf district in Kandahar due to security restrictions; however, in the se districts the food consumption part of the female questionnaire was filled out by male enumerators interviewing male respondents.
Rural and Urban Settled Households
The analytical domain, the unit at which the data are statistically representative, is at the level of 34 rural provinces; in contrast to NRVA 2003, the province of Uruzgan was split into smaller Uruzgan and Daykundi; the same happened to Parwan, which was split into Parwan and Panjsher. In addition to these 34 provincial analytical domains, there are 10 urban areas with populations larger than 10,000 households. The survey has also collected data representative of these 10 urban domains. Thus, there are 44 settled analytical domains. Because Kuchi have been considered as one national analytical domain, there are a total of 45 analytical domains for NRVA 2005.
Collecting representative data with a proportional sample at the provincial level creates a challenge because of the large variation in provincial population from the smallest population in the province of Nimroz, with only 13,941 rural households, to Hirat, with 226,650 rural households. To adjust the sampling to the available budget, the province Jawzjan with 50,900 rural households, has been used as the base analytical domain for which the sampling fraction has been determined.
For those provinces or districts within provinces where the sample frame was not yet available at the time of sampling (42 districts), the Livestock Census database was used to draw a sample.
On arrival at a village, the number of households was determined during the male community interview. As it was difficult for the enumerators to predict the number of households within dwellings, an additional question was asked for the total number of dwellings in the village. This number was divided by 12, to create a sampling interval for households within the community. The enumerators then selected a household each time they counted the sampling interval houses. By using this method, the sampled households were randomly and spread equally throughout the village.
Kuchi households
The household listing conducted by CSO did not effectively include the migratory Kuchi population to the date of the survey; hence there was no effective sampling frame for this population. Apparently, this lack of enumeration of the Kuchi population includes those that have recently settled. This is exactly the same population that was surveyed during winter/spring 2004 by the National Multi-Sectoral Assessment for Kuchi (NMAK)2, i.e. the Kuchi that is still nomadic and those that have recently settled since the onset of the last drought period. This is the best estimate of the current Kuchi population. The unit of observation for the survey was the Kuchi communities in their winter location, where one or more Kuchi communities may have been located. The sample frame for the survey was created by constructing the predicted Kuchi populations in their summer location, for which information was collected from the NMAK 2004 survey.
2.2.3. Data collection and analysis
Government and non-government organizations at the provincial and national level were contacted for provision of male and female enumerators, as the team composition was designed for four enumerators (two males and two females, based on the questionnaire design). Full advantage was taken from WFP’s regional level enumerators who had previous experience in surveys. Training was conducted in eight regions using two trainers. A test was given to the enumerators, and only those who passed were included in a four-person team (two females and two males, excluding Zabul). Support from local mullahs and teachers in the Maruf district of Kandahar, Logar and Zabul provinces was sought by the NRVA management team to overcome security issues. The field work started in June and was completed in August 2005. Readings with Global Positioning System were taken to verify the locations of the sampled villages. Eight regional coordinators were hired by the NSS project to supervise the enumerators in eight regions. In addition, the WFP/VAM regional team leaders and monitors were involved in the supervision of field work of NRVA 2005 enumerators.
Automated data entry
Teleform Enterprise version 8 (Cardiff software, donated by WFP) was used throughout the process to scan the NRVA 2005 Teleform questionnaires filled in the field. Teleform is an electronic pre-programmed method of gathering data (optical readable software), often used for its speed and accuracy in large surveys and censuses. A scanner capable of processing 60 sheets per minute was used.
Unlike NRVA 2003, where Teleform was only used for the shura and wealth group data after being transcribed by VAM and key enumerator staff into scan able formats;
2
finally the information was scanned into a Microsoft Access database using Teleform. The NRVA 2005 was completely designed in Teleform; then the enumerators filled in the pre-designed questionnaire sheets and the data were directly scanned into the Access database.
Scanning 1.3 million data sheets took two to three months more than anticipated; the process was finally finished in February 2006. These delays were partially due to the quality of enumeration of questionnaires, computer hardware that was not powerful enough to sustain the processing required (alleviated by the loan of a high-speed server from UNOPS) and the absence of a stable electricity supply (alleviated by the loan of the power generator from WFP).
Once the data were scanned, the programme logically checked if the number of responses per question was not exceeded. Unfortunately, within NRVA 2005 a decision was taken to insert the number of the response within the answer circles. This resulted in some false positive answers as a high percentage of the answer circles were already coloured. Only when a true answer was also indicated (giving two responses) the programme stopped asking for verification, if there was no response then the false positive was accepted and these responses were taken out during normal cleaning practices. Once a questionnaire was validated, the image file was deleted and the data was written to the Access database.
Descriptive statistics were estimated with SPSS and Genstat. Cluster analysis using ADATTI software was used for food security profiling. Provincial statistics produced are included in the Annex; those for national, Kuchi, rural and urban categories are included in the main body of the document.
Data constraints and limitations
In spite of the time spent on the design of the questionnaire and its implementation in NRVA 2005, the data gathered have the following limitations:3
x Seasonality. Food security assessment and household perceptions are only valid for the summer season, rather than for the whole year.
x Limited data on non-food consumption. Due to the multilateral nature of the assessment most of the non-food consumptions (except communication costs) have been included as groups to avoid an exhaustive questionnaire with a strong risk of lowering the quality of data.
x Income. The module on income was designed to look at the number of income generating activities in a household; these can be used for profiling household livelihoods, but should not be used for quantification of income.
x Infant and child mortality. Although the age of each child bearing woman was included in the male questionnaire, it was impossible to construct an unambiguous link of these ages to the multiple women in the female questionnaire. Therefore, it is not possible to calculate child mortality for a standard reference period with this design.4
x Rounding food consumption quantities. The food consumption quantities were obtained by asking female respondents of households to estimate the weights of the different types of 69 foods consumed by the household in the past seven days. If weights were provided in local units, then the enumerator, with support from the respondent, estimated the weights in kilograms. Inevitably, it must be assumed that there was wide scale rounding up or down.
3
The complete NRVA 2005 questionnaires are available (http://www.mrrd.gov.af/vau/NRVA_2005.htm).
4
x Inseparable Kuchi information. Kuchi, as the nomadic pastoralists are known in Afghanistan, were sampled as one national analytical domain regardless of considering their migration pattern. While there are two main types of Kuchi population in Afghanistan: long range and short range migratory Kuchi, NRVA 2005 did not collect this information from the Kuchi communities that it enumerated. While there might be socio-economic differences between these two types of Kuchi, these groups cannot be identified within NRVA 2005 sample.
x Security limitations to female enumerators. Due to poor security for female enumerators in 11 districts of Zabul province and one other district (Maruf district of Kandahar) only the food-consumption module of the female questionnaire was enumerated by men to male heads of households or male respondents, to provide food security and household perceptions from these highly insecure areas.
2.3. NRVA 2005 in relation to NRVA 2003
It is very tempting to compare the figures of NRVA 2003 with those of NRVA 2005. However, the methodology used in NRVA 2003 is different from the one used for NRVA 2005. The main differences between NRVA 2003 and NRVA 2005 can be summarised as follows:
NRVA 2003 NRVA 2005
Sample frame not proportional to population.
Sample selection was not random (based on different agro-ecological zones).
Household selection was not random (based on wealth groups)
Proportional to population (used updated CSO figures).
Sample selection was based on random start method to have a better geographical distribution of the sample.
The household selection was based on the random start method within villages.
Four levels of data collection:
x District level.
x Community shura level.
x Wealth group level.
x Household level.
Two levels of data collection:
x Community shura level.
x Household level.
Only market data is collected at district level. Covered only rural areas and Kuchi. Covered rural and urban areas and Kuchi. Used common questionnaire and after
completion of the field work, the data were transcribed into Teleform format.
Teleform questionnaires were used in the field and used as the data entry instrument.
Coverage: Female enumerators were not involved in
the south and most port of eastern areas; so, female information is lacking.
Poor female coverage.
Female enumerators participated in the whole assessment in all provinces except Zabul. Good female coverage.
NRVA 2003 NRVA 2005
Partial stakeholder participation for questionnaire design.
Full stakeholder participation in the questionnaire design.
Several different trainers were involved in the training of the enumerators. This allowed the possibility for variation among enumerators.
Uniform training: just 2 trainers who were involved from design to implementation for the whole country.
Household food consumption, but no household non-food consumption. Food poverty calculation only possible at the household level.
Household food consumption and about 25 items of non-food consumption at the household level.
Thus, it may be safely assumed that the quality of the NRVA 2005 data is superior to that of NRVA 2003. The development of these two rounds of NRVA must be regarded as a learning curve for all Afghan stakeholders.
Apart from NRVA 2003 and 2005, other household surveys have been conducted in Afghanistan. Some of them covered similar topics as NRVA, for example the Demographic and Health Survey and the Multiple Indicator Cluster Survey (UNICEF, 2003) are some of the surveys that deal with public health.
2.4. Note to the reader
3.
Socio-economic situation
The socio-economic situation is characterized by household demographics, housing, water and sanitation, household asset ownership, access and utilization of education and health facilities, livelihood activities, agricultural and livestock production, transportation and access to markets.
3.1. Population
The population of Afghanistan is very young; 52% is 17 years of age or younger, out of this 16% is pre-school age. Each column in the histogram below represents 5 years; showing that most people within the population are between 5 and 15 years (highlighted in orange). Average life expectancy at birth is 43 years (ADB 2005b).
Figure 1: Percent of population by age
Fifty-four percent of the population is male and 46% is female. The average5 age of females is 21 years, and that of men is 22 years. The average age of women above 25 years is 40 and that of men is 42 years. On the average, each woman has given birth to 6.6 children (UN Commission on the status of Women, 2006).
Table 1: Age categories of population Age category %
0-<6 16
6-<13 24
13-<18 13
18-<24 13
24-99 35
Overall, the average number of people per household in Afghanistan is 7.4, the mode and median are 7. The Kuchi and rural households share the same descriptors,
5
average number of members per household is 7.5, and mode and median is 7. The urban households are slightly smaller; the average is 6.8, and the mode and median is 6. Among provinces, at one extreme Hilmand has an average of 9.1 household members, where the mode is 7 and the median 9; at the other extreme, Nimroz averages 6.0 members, and the mode and median is 6.
Two percent of the households in Afghanistan are headed by females. Female headed households are highest in Nimroz (9%), followed by Samangan (6%), Kapisa and Nuristan (5%), and Hilmand and Wardak (4%). There are 4% male disabled head of households, while among the female heads of household, only 3% are disabled.
>24 >29 >34 >39 >44 >49 >54 >59 >64 >69 >74 >79 >84 Female Male
Figure 2: Proportion of females and males in groups of age above 24 years
The first column in the figure above represents the proportion of females and males in the Afghan population between 25 and 99 years; the subsequent columns represent the female and male proportions for groups with increasing ages up to 99. The female to male ratio drastically declines above 40 years to 70 years, which could be related to the cumulative effect of disadvantageous conditions of women and the biological burden of giving birth to several children. In general, women have a longer life expectancy, and histograms of the female and male shares for different age groups would be expected to be convex from below. Neighbouring countries of Afghanistan (India, Pakistan, Iran and Tajikistan) show that the probability at birth of surviving to 65 years for females is 70% and that of males is 63% (UNDP, 2006). Furthermore, out of all countries listed by UNDP only Zambia and Zimbabwe6 have lower probabilities for females at birth surviving to 65 years than males (average females 17% and average males 18%). The NRVA 2005 shows that Afghanistan is an outlier among its neighbours and it is not only in line but possibly exceeds these two African countries where females have lower probabilities of reaching an advanced age, as shown in the figure. This situation is further compounded by the casualties of war, expected to be higher for men than for women, which would further deepen the gender gap flagged by NRVA 2005 data (see section 3.4).
6
While Zambia and Zimbabwe have been severely hit by HIV/AIDS there is no evidence that at present this is a common element to explain this gender gap. Afghanistan has only 50 known cases of HIV. However, given the much higher HIV cases in neighbouring Pakistan (74,000) and Iran (14,000), an unknown behaviour of refugees returning from abroad, injecting drug use and low literacy to put the country at risk (http://www.youandaids.org/Asia%20Pacific%20at%20a%20Glance/Afghanistan/
A demographic study should assess these findings as soon as possible.7 3.2. Education
3.2.1. Literacy
Afghanistan is one of the countries in the world with the lowest literacy rates, especially amongst women. Therefore attention will be paid to gender issues in the following section.
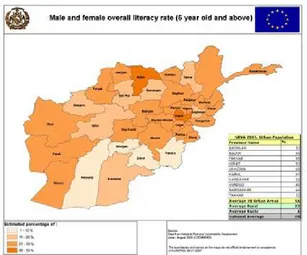
Heads of households or male respondents were asked if they and other household members could read. Slightly more than quarter (28%) of the population (6 years old and above) in the country can read. The urban population has the highest literacy rate (56%), followed by households in the rural areas (23%), while only 6% of the Kuchi can read. The overall literacy rate of women is 18% and that of men is 36%. Female to male literacy ratio is 0.5 for all the population and the Kuchi, 0.4 in the rural areas and 0.7 among the urban population. This ratio is 0.8 in Iran, 0.7 in India, 0.6 in Pakistan and above 0.9 in the neighbouring Central Asian countries (UNDP, 2006).
Table 2: Overall literacy rates (%) in Afghanistan for 6 years old and above
Categories Female Male Average
Kuchi 4 8 6
Rural 13 32 23
Urban 47 64 56
National 18 36 28
Overall, the highest literacy rates in Afghanistan are found in the provinces of Kabul (58%), Balkh (44%). Kapisa (39%), Parwan (37%) and Hirat (36%) and the lowest rates are in Zabul (<1%), Paktika (2%), Hilmand and Uruzgan (5%). Kabul, the capital, has a high level of access to school; Balkh and Hirat are provinces with big urban and high urban population with better access to education facilities. During recent years of war many households of Kapisa and Parwan have been displaced to Kabul. These provinces have been the focus of decision makers to invest in education. Zabul, Paktika, Hilmand and Uruzgan have faced many years of insecurity.
Overall provincial findings show that Kabul, Faryab, Hirat (0.7), Paktya, Nuristan, Kunduz, Balkh and Badakhshan (0.6) have the closest gender balance across the country.8 In contrast, Zabul, Paktika and Uruzgan show the lowest female to male literacy ratio (0.1 or less) and absolute number. Traditions and attitudes constrain female literacy, and this is compounded by difficult or limited access to schools.
7
Teleform errors were mentioned in section 2 and there are problems with the complex family structure and relationships in the household units. However, the gender and number of family members is likely to be the most reliable demographic information.
8
Figure 3: Literacy rate, females and males (6 years old and above)
Literacy in Afghanistan is associated with culture and attitudes toward literacy, access to schools, security and public investment. The low literacy rates in the southern provinces and Paktika in southeast are mostly related to security and cultural factors; in Badghis and Ghor, remoteness and poor access to schools and in Sar-I-Pul, limited number of schools and long distances explain the low literacy rates.
Figure 4: Literacy rate, females (6 year old and above)
Female Literacy rate is higher in Kabul, Balkh and Hirat. These provinces have higher urban resident with high access to female education. The four provinces with the lowest female to male literacy ratio are Zabul, Paktika, Uruzgan and Hilmand. These provinces are highly insecure, traditional and have limited educational facilities.
In the rural areas the highest literacy rate occurs in Parwan (41%), Kapisa and Panjsher (40%), Ghazni and Balkh (37%) Kabul and Paktya (36%). The lowest rates are in Zabul (<1%), Paktika (2%), Hilmand (5%) and Uruzgan (6%). Parwan, Kapisa and Panjsher have closest access to the capital of the country with lot of movement to capital. Kabul is capital of the country and Balkh rural households have good access to education facilities. Paktya province amazingly shows the fifth highest literacy rate. The lowest four provinces may also present security problems, traditional attitudes and limited access to schools. Rural provinces with high female to male literacy ratio are Faryab (0.7), Hirat, Nuristan, Badakhshan and Paktya (0.6), while Zabul, Paktika, Uruzgan, Hilmand and Kandahar have the female to male ratio of 0.1 or less.
Literacy rate in the ten provinces urban dwellers is highest in Kabul (67%), followed by Jawzjan (65%), Nangarhar (64%), Balkh (60%), Faryab (55%) and Hirat (53%). The lowest rate is observed in Kandahar (22%).
Overall, Kuchi literacy rate is only 6% (4% for women and 8% for men). The nomadic and semi-nomadic nature of this group further limits their access to basic education. A possible way to address this limitation could be through the examination of literacy programmes for migratory groups in other parts of the world and an adaptation of some of their elements into a strategy to promote Kuchi literacy.
The national literacy rate of the age group of 15-24 years is an indicator of the achievement of the young and productive adults (this is an indicator for the MDG No. 2,Achievement of universal education by 2015). The overall average literacy for this age group is 31%. The highest rate is in the urban areas (64%), followed by the rural areas (26%) and only 6% among the Kuchi. The female to male literacy ratio is highest among the Kuchi households (0.9), closely followed by the urban areas (0.8) and the lowest value in the rural areas (0.3). The high female to male literacy ratio for Kuchi is relative to a 6% overall literacy rate. The NMAK survey (Weijer 2005, p. 40) found that only 5 females can read out of 10,000 compared to 200 males out of 10,000. This needs further investigation. In the urban areas women have better access to schooling, while in the rural areas both cultural traditions and low access to schools limit female literacy.
Table 3: Literacy rate among 15-24 years old population
Category Female Male Average
Kuchi 5.6 6.1 5.9
Rural 11.6 35.7 25.6
Urban 55.4 70.5 63.6
3.2.2. School attendance
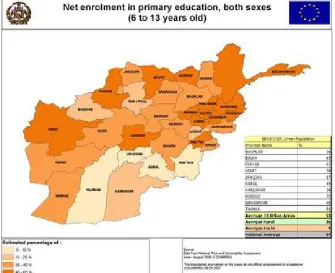
The net enrolment ratio in primary education is the number of children 6-13 years enrolled and attending primary school. NRVA 2005 estimates the national average for attendance as 29% female, 43% male and 37% overall. The achievement of universal primary education (MDG No. 2) by 2015 also can be assessed by the net enrolment rate in primary education of 6 to 13 years old.
Table 4: Net enrolment (%) in primary education (6 to 13 years old)
Kuchi Rural Urban
Female Male All Female Male All Female Male All
6 11 9 27 44 36 51 55 53
Net enrolment in urban areas is reported to be as high as 53%. With almost a 1:1 ratio of girls and boys attending primary school, indicating that in urban areas, the issue of getting children to school is not completely determined by culture, but may be due to access or other social challenges. In rural areas the average net enrolment is lower with only 36% and Kuchi only 9%; there is also a 1:2 ratio of girls to boys, indicating that there is a cultural challenge as well as a greater social and access challenge. These figures can also be used as a baseline for the achievement of the MDG No. 3, to promote gender equality and empower women. Overall net enrolment is 37%, for girls 29% and for boys 43%
Inrural Afghanistan, Paktya (67%), Kapisa (62%), Kunduz (59%), Balkh (55%) and Faryab (54%) have the highest rate of enrolment of both girls and boys. Girls’ enrolment is highest in Paktya (56%), Faryab (52%), Hirat (48%), Kunduz (47%) and Kapisa (46%) while boys’ enrolment is highest in Kapisa and Paktya (77%), Kunduz (69%), Balkh (67%), Khost (63%), Parwan (61%) and Panjsher (60%). In contrast, Zabul (<1%), Uruzgan (1%), Hilmand (6%) and Paktika (9%), in the south and south-eastern have the lowest rates of enrolment for girls and boys.
Overall enrolment in urban areas is 53%, with the highest figure in Kunduz (75%), Hirat (74%), Jawzjan (67%) while Kandahar (34%) and Baghlan (36%) present the lowest rates. As the overall enrolment decreases, female and male enrolment also follows the same trend in the respective provinces. In one extreme, the highest overall enrolment in Kunduz is 75% while girls’ enrolment is 74% and that of boys is 76%. In the other extreme, Kandahar has 34% overall enrolment while girls’ enrolment is 28% and that of boys is 36%.
Figure 5: Net enrolment in primary education, both sexes (6-13 years old)
Figure 6: Net enrolment in primary education, girls (6-13 years old)
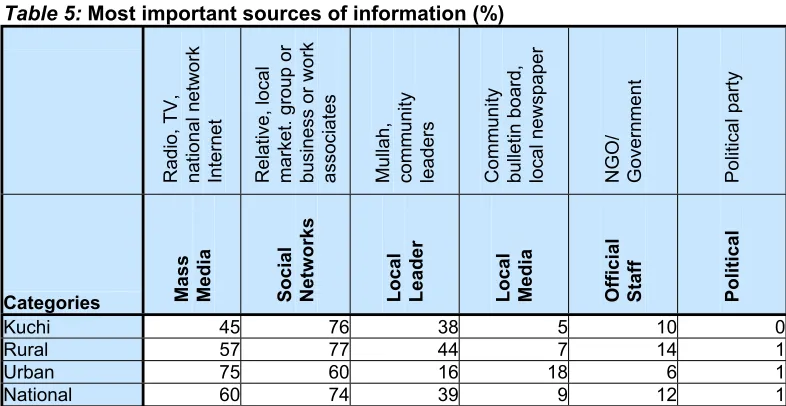
3.3. Access to information
The NRVA 2005 questionnaire included six groups of sources of information:
x Mass media: radio, television, national network and internet.
x Social network: relatives, local market, group or associates, business or work associates.
x Local leaders: mullah and community leaders.
x Local media: community bulleting board and local newspaper.
x Official staff: government officials and NGOs.
x Political: political party.
Overall, the social network accounts for most of the diffusion of information, 74% of all households. Mass media is also an important source (60%), followed by local leaders (39%). Other forms of information such as local media (9%), official staff (12%) and political parties (1%) are far less important.
Table 5: Most important sources of information (%)
Radi
Categories Mass Media Social Network
s
Local Leader Local Media Official Staff Political
Kuchi 45 76 38 5 10 0
Rural 57 77 44 7 14 1
Urban 75 60 16 18 6 1
National 60 74 39 9 12 1
Mass media in Paktika and Laghman is the most important source of information (92%), Sar-I-Pul (29%) and Bamyan (26%). In Kapisa and Takhar, the social network forms the most important source (93%). Local leaders as a source of information are as high as 83% in Nuristan, Badghis (82%) and Sar-I-Pul (80%) or as low as in Logar (3%), Zabul (5%) and Nimroz (6%).
In the rural areas the figures match closely with the national figures. The social network is the most important source of information (77%), followed by the mass media (57%) and local leaders (44%). When these figures are compared with urban data, there is an interesting difference. Because urban life is more anonymous than that in rural areas, it is no surprise that the social network (60%) is less important than the mass media (75%). The role of local leaders in urban areas is even less important (16%).
3.4. Health care
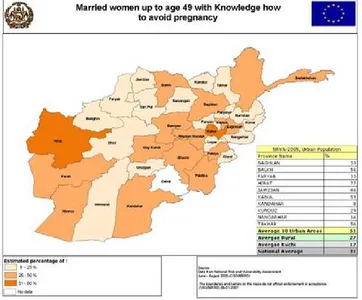
Women marry young, the most common age being 20. However, NRVA 2005 data show 52,700 cases of girls 10 or 11 years old being married (13 girls out of 1000 women).9 Only 19% of the deliveries are born in suitable health facilities such as government hospitals or NGO health centres. The rest are home-delivered or by female neighbours or relatives; out of them 57% were delivered by female relatives or friends, and 41% were delivered by a traditional birth attendant. The map in Fig. 7 shows the distribution of married women in the households up to age 49 with knowledge on how to avoid pregnancy.
Figure 7: Married women in the households up to age 49 with knowledge of how to avoid pregnancy
In general, urban households have higher knowledge of methods to avoid pregnancy. The provinces of Kabul and Hirat, with a high literacy rate and urban populations, show the highest knowledge of birth control methods.
Overall, only 31% of the married woman up to 49 years of age know or have heard about methods to avoid pregnancy. Of those, 44% said that they are using them. Specifically, 44% use the pill, 37% use injection, and 8% use condoms, 6% use early withdrawal, and 3% use sterilization. The percentage use of condoms, restricted to the married woman up to 49 years of age who stated that they are using contraceptive methodes, is 9% in urban areas, 7% in rural and 17% among the
9
Kuchi. The high frequency of use among the Kuchi depends on the fact that the absolute number for Kuchi is lower than urban and rural households. Only a small proportion of Kuchi women are aware of methods to avoid pregnancy; out of them only some use a contraceptive method, and among them only some use condoms. Furthermore, Kuchi woman may not have as much access to other methods as settled population as well.
The map in figure 8 depicts the distribution in use of condoms as one method to avoid contraception or sexually transmitted diseases.
Figure 8: Condom use as contraceptive method by married women
Table 6: Contraceptive methods used by married woman in the households up to age 49, out of those using any of these methods
Categories Pill % Condo
m %
Injection % Sterilization % Early withdra
w
Barriers to health care and perceptions
During 2005 the NSS project as part of the NRVA assessment also collected data from the female and male shuras within a community. This assessment was to record the perceived attitudes of the shuras, which traditionally play an important role in the self governance of the Afghan communities. The lack of health facilities and medical attention has been flagged by the shuras as high priority for public intervention.
Nationally, most of the shuras responded that the closest health care facilities were clinics without beds (basic health centres). Nuristan was the only province which consistently (male or female shura) responded that most of the health facilities were health posts. The most frequent answer among the households in Balkh, Jawzjan and Takhar is that hospitals are their closest health facility.
In those communities that do not have a community health worker, the shuras were asked if they thought a health worker would go to the communities in an emergency. Sixty-seven percent of the female shura recorded that the community did not have a community worker within it and that most of them believed that the health worker would not visit the community, even in the case of emergency. The male shura responded with a higher level of scepticism than the female shura; 72% thought that help would not be provided in case of emergency.
There is need to overcome the barriers in access to health care for all sectors of the population but especially for women. Women above 24 years of age have higher mortality rates than men of the same ages; this is probably related to deficiencies in health care and nutrition. The NRVA 2005 questionnaire did not address the types of health problems prevailing among women. Attention should be paid to the nexus health care and nutrition.
3.5 Housing and services
In the survey, households were asked to characterize their current dwelling. In addition, information was collected on main sources of lighting, electricity, cooking fuel, drinking water and sanitation. Also, the enumerators were instructed to make an evaluation of the housing facilities.
3.5.1 Housing
Overall, single private housing was reported as the most frequent type of dwelling (72%) while 17% of the households share a house with others. In the urban areas
the supply of houses is more limited. In Kabul and urban Nangarhar (Jalalabad) the share of single private houses is the lowest with 56%. In Kabul large numbers of houses have been destroyed during the various periods of war and Jalalabad hosted many internally displaced people from different parts of the country in last years of war. The highest number of households living in a singe private house can be found in Takhar (94%) and Jawzjan (86%). These provinces have suffered comparatively little damage during the years of war. Seven percent of the urban households live in temporary shelters, with Baghlan having the highest frequency (25%).
Table 7: Types of housing (%)
Categories Single famil
y
house Part/ shared house Separate apartment Part/shar
e
d
apartment Tent Temporar
y
shelter / shack Othe
r
Kuchi 20 5 0 0 71 4 0
Rural 77 17 1 0 1 4 0
Urban 63 22 4 1 0 7 2
National 72 17 1 0 4 5 1
In the rural areas 77% of all households live in a single private house, whereas 17% share one. The share of temporary shelters is somewhat lower (4%). In Paktika nearly all households live in a single house (99%), while neighbouring Paktya (43%) and Zabul (27%) have the lowest share of single private houses. Nangarhar (52%) and Paktya (39%) have the highest number of households sharing a house.
The vast majority of all households claim ownership of the house where they live. They have acquired it, either by inheritance (72%) or purchase (13%). Four percent of all households consider themselves as tenants, and another 4% are squatters.10
Table 8: House acquisition
Relative / friend owner squa
tter
There is a great difference between urban and rural areas. In the urban areas the number of tenants is much higher compared to the rural areas – 21% and 1%, respectively. The total number of households that consider themselves as owners is 68% in the urban areas and 91% in the rural areas. Kuchi ownership of housing is somewhat more complicated to interpret because of the mobility of their settlements. Tents can be considered the full ownership of Kuchi households. Any single house or a shared house is also inherited or purchased.
Overall, most of the houses have been acquired by inheritance but many households (44%) do not possess any documentation that proves ownership. Thirty-one percent of those households who claim to be owners have a deed registered in the court or mazkan, and another 13% have their deed registered in district or sub-district offices. Five percent have their deed recorded elsewhere, while 7% of the interviewed household did not know where the deed was registered.
Table 9: Evidence of ownership (%) Categories No
In the urban areas, the majority (61%) have their deed registered in court, ranging from 27% in Hirat to 95% in Jawzjan. Fourteen percent of all the urban households who own a house do not have a deed, with the highest figures in Takhar (28%). In recent years many refugees have returned to the country. In some of the provinces there are areas identified as urban Nahias. Whilst the municipality of the Ministry of Urban Development has not officially distributed land for house building, some urban land-owners have sold their land to the needy people without documentation (Urfe Qabala) so that they can build their houses. This category of urban residents does not have any legal or official document, but they are urban residents.
10
The situation in the rural areas is different: 48% of all households do not have a deed. Panjsher (99%) and Paktya (93%) are the provinces where there are hardly any deeds registered. Of the deeds being registered, 26% are registered in court (Logar with 55% and Bamyan with 54% are the highest), 13% are recorded locally and 5% elsewhere. In rural Afghanistan housing registration has not taken place, so some provinces with limited number of urban households have been considered as rural. The reported deed registration in the court or Mazkan may be of those who live within the urban areas of these provinces, or some rural households refer to the deed they have for the land where they have built their houses. The majority (64%) of
Kuchi households do not have a deed and 20% of households have their deeds registered in court (this maybe the deed of the land where the house was built). Only 2% have had a dispute over land during recent years.
As already mentioned, most houses are being owned by their dwellers. As a result 96% of all households do not pay any rent. Those households that pay rent in all the sample average AFG 2,700 per month. The rural average is AFG 1,448 and the urban average is twice as much (AFG 2,922).
Overall, the highest debts related to housing are in the urban areas (11% of households) followed by 9% of the rural households and only 2% of Kuchi households have one. Fifty-three percent of households in Nuristan have debts. In Nuristan there is a common practice of obtaining goods on credit, and there is a time of the year (generally autumn) when they sell their animals to pay back their loans.
Table 10: Outstanding debt on housing (%)
Categories No Yes
Kuchi 98 2
Rural 91 9
Urban 89 11
The local enumerators were instructed to assess the quality of housing of the surveyed households. This assessment can only be subjective, most likely also relative to their own house when judging other houses. Another factor compounding the subjective assessment is that these questions were included in the male part of the questionnaire; traditionally, the rooms for receiving guests are separate, so it was difficult to quantify their judgment without having access to all rooms of the house.
In some parts of the country such as the east, in the summer (when the assessment took place) the reserved place for male guests is outside, in front of the house (Dera). The lack of access to the main house made it difficult to evaluate the quality of the house. Male enumerators in such circumstances were advised to ask the female enumerators to evaluate the housing condition as they conducted the interview inside of the house. However, equivalence of male and female assessments is relative. Taking this into account, 43% of all dwellings were considered to be in a good condition (windows and doors present and a non leaking roof), 20% of all houses had one or more deficiencies of doors, windows or roof. Thirteen percent of all households live in poor housing conditions. Furthermore, 9% live in a temporary structure that can be described as being good, while 6% live in a poor temporary structure.
Table 11: Housing condition (%)
Categories Non leaking windows, doors, roof Leaking windows, doors, roof Traditional ten
t
Out of all Kuchi households interviewed, 66% lived in traditional tents at the time of the interview, these figures includes semi-nomadic populations, who stay in tents during summer. In the urban areas, 51% of all houses were in good condition, ranging from 2% in Nangarhar to 73% in Kunduz. The highest proportion of temporary structures was 16% in Hirat; out of those, 51% are of good quality and 12% of poor quality.
In the rural areas the housing assessed with good quality was 43%, and 23% was poor. The highest quality of houses was assessed in Paktika and Bamyan (about 90%; this figure may be biased by the local enumerators that compared their own housing with those of interviewees; housing in Bamyan generally looks among the poorest in the country). Ghazni and Zabul had the highest number of temporary structures. Overall, very few households (3%) own a second dwelling. The difference between urban and rural areas is negligible. Ten percent of Kuchi
households possess an alternative dwelling; most likely their winter housing.
Table 12: Ownership of second dwelling (%)
Categories No Yes
Kuchi 90 10
Rural 98 2
Urban 97 3