A Comparative Economic Analysis of Two Seaweed
Farming Methods in Tanzania
By:
Flower E. Msuya Mwanahija S. Shalli
Karen Sullivan Brian Crawford
James Tobey Aviti J. Mmochi
2007
Sustainable Coastal Communities and Ecosystems Program
This publication is available electronically on the Coastal Resources Center’s website: www.crc.uri.edu. It is also available on the Western Indian Ocean Marine Science Association’s website: www.wiomsa.org. For more information contact: Coastal Resources Center, University of Rhode Island, Narragansett Bay Campus, South Ferry Road, Narragansett, RI 02882, USA. Email: [email protected]
Citation: Msuya, F.E., M.S. Shalli, K. Sullivan, B. Crawford, J. Tobey and A.J. Mmochi. 2007. A Comparative Economic Analysis of Two Seaweed Farming Methods in Tanzania. The Sustainable Coastal Communities and Ecosystems Program. Coastal Resources Center, University of Rhode Island and the Western Indian Ocean Marine Science Association. 27p.
Disclaimer: This report was made possible by the generous support of the American people through the United States Agency for International Development (USAID). The contents are the responsibility of the authors and do not necessarily reflect the views of USAID or the United States Government. Cooperative agreement # EPP-A-00-04-00014-00
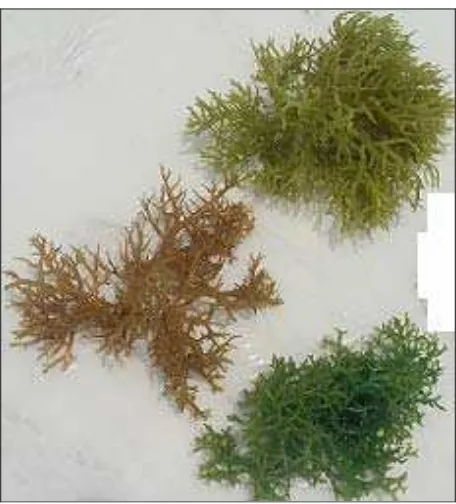
Cover Photos: Women seaweed farmers harvesting seaweed, a peg-and-line off-bottom farm at low tide, and a close up of a piece of Kappaphycus alvarezii know as the "cottonii" variety seaweed
Table of Contents
Page
EXECUTIVE SUMMARY ... 1
1.0 INTRODUCTION ... 3
2.0 SEAWEED FARMING IN MLINGOTINI VILLAGE ... 4
3.0 THE SEAWEED PRODUCTION CYCLE... 6
4.0 COSTS OF SEAWEED FARMING ... 6
4.1 Initial Investment Costs ... 6
4.1.1 Off-Bottom Plots... 6
4.1.2 Floating Line Plots... 7
4.1.3 Initial Investment Costs Applicable to Both the Off-Bottom and Floating Line Methods ... 7
4.2 Labour Costs ... 9
4.2.1 Tying Seed ... 9
4.2.2 Planting ... 10
4.2.3 Farm Management ... 10
4.2.4 Harvesting ... 10
4.2.5 Carrying to Dry ... 10
4.2.6 Packaging... 10
4.2.7 Carrying to the Market... 11
4.2.8 Tie-tie and Rope Separation... 11
5.0 PROFITABILITY... 11
5.1 Off-Bottom Method ... 11
5.2 Floating Line Method ... 16
6.0 DISCUSSION AND ANALYSIS ... 19
7.0 CONCLUSIONS AND RECOMMENDATIONS ... 24
List of Tables
Page
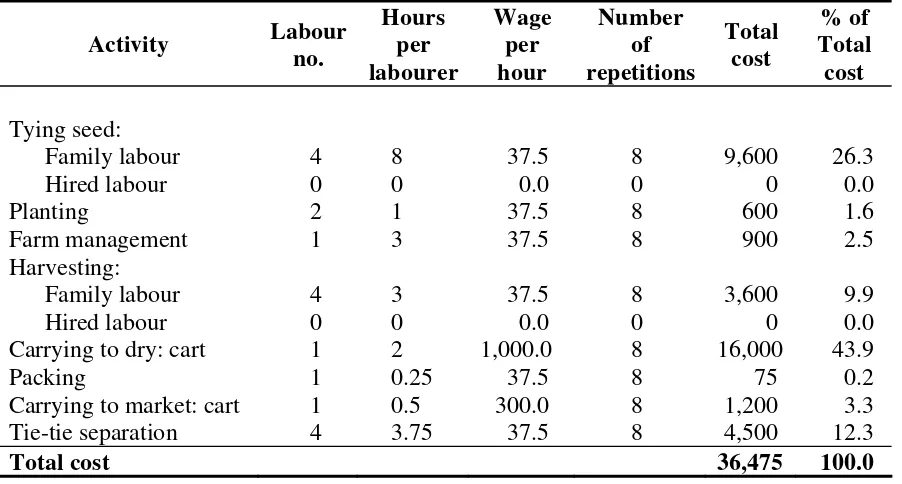
Table 1. Annual labour cost for a woman owned off-bottom plot... 12
Table 2. Annual labour cost for a man owned off-bottom plot. ... 13
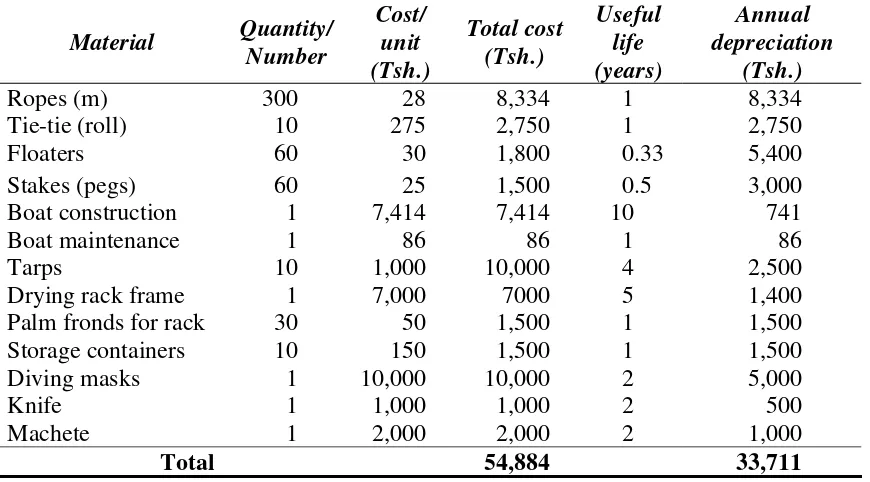
Table 3. Initial investment cost for a woman owned off-bottom plot. ... 13
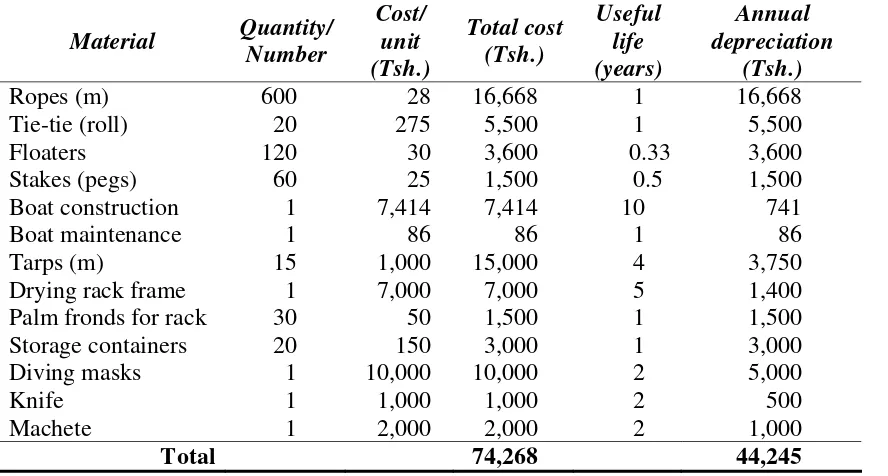
Table 4. Initial investment cost for a man owned off-bottom plot. ... 14
Table 5. Mean cottonii daily growth rate on off-bottom and floating lines... 14
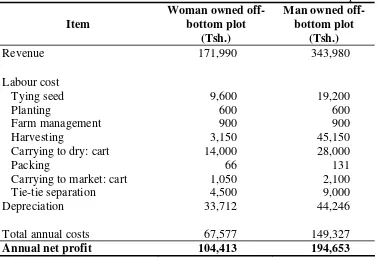
Table 6. Annual costs and returns of woman and man owned off-bottom plots. ... 16
Table 7. Annual labour cost for the floating line plot... 17
Table 8. Initial investment cost of a floating line plot. ... 18
Table 9. Annual costs and returns of a floating line plot. ... 19
Table 10. Comparison of annual material and labour costs by farming method. ... 20
Table 11. Productivity by farming method. ... 21
Table 12. Annual profits of cottonii seaweed farmers by farming method. ... 21
List of Figures
Page Figure 1. Kappaphycus alvarezii (cottonii): (Photo credit: Flower E. Msuya) ... 3Figure 2. Eucheuma denticulatum (spinosum): (Photo credit: Flower E. Msuya) ... 4
Figure 3. One tie-tie of K. alvarezii. (Photo credit: Flower E. Msuya) ... 11
Figure 4. Distribution of labour costs by farming method... 20
EXECUTIVE SUMMARY
The national Seaweed Development Strategic Plan recently adopted by the Tanzanian
government calls for expansion of seaweed farming which has proven to be an important income generator for coastal communities and an export earner for the country. The plan calls for the expansion of farming of Kappaphycus alvarezii, locally called cottonii. Although cottonii is the higher priced variety, it is more environmentally sensitive, leading to disease problems and die-offs. The Sustainable Coastal Communities and Ecosystems (SUCCESS) program has piloted a deep-water floating line method of cottonii farming in Mlingotini village of Bagamoyo District to test whether this method can reduce die offs but still be an economically viable option for farmers.
A comparative economic analysis of two different methods for farming cottonii –– the traditional peg and line off-bottom method and the deep-water floating line method –– is presented in this paper. It compares the productivity and economic returns of the two different methods for farming as well as compares the financial returns of buyer-dependent and independent seaweed farmers. The findings and recommendations are that:
The floating line method is economically superior to the traditionally used off-bottom method of farming cottonii and therefore should be promoted. There is a significant difference between the productivity of the off-bottom and floating line plots attributable to the floating line method’s advantage of reducing die-offs that occur using the off-bottom method. The floating line method also creates a seed bank that minimizes the amount of time a farmer spends trying to produce seed after a die-off, therefore; combining floating and off-bottom farms is advantageous. The floating line plots also act as fish-aggregating devices and by using dema traps, seaweed farmers can also harvest a substantial amount of fish.
Independent seaweed farming is economically superior to buyer-dependent farming. However, independent seaweed farming should be promoted with the caveat that
independent farmers must raise their own capital to purchase inputs and assume greater risk. Independence is advantageous for both the off-bottom and floating farm method regardless of whether loans are needed or not for initial investments in farming. However, the greater profit potential of independent seaweed farming needs to be weighed against the greater economic risks to farmers that also accompany it.
It is recommended that independent farmers expand their current production of cottonii
and that credit be provided for this purpose. Production can be expanded by expanding existing farms or increasing the number of farms. Household farming strategies will be based on time availability and economic comparability of seaweed versus other livelihood options.
1.0 INTRODUCTION
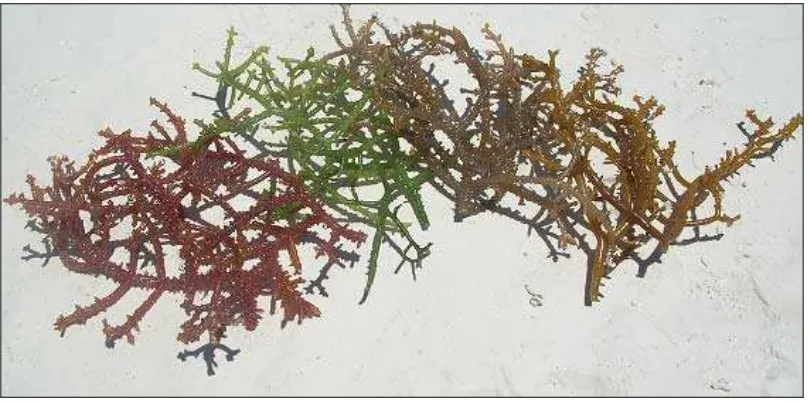
Seaweed farming has become an established aquaculture industry in Tanzania over the last decade. It is a significant export earner as well as an income and employment generator in coastal communities where it is practiced. It is a sustainable form of aquaculture that has particularly benefited women and contributes to the governments’ poverty alleviation program (Bryceson 2002). In Zanzibar, it has become a major source of income for women farmers (Wallevik and Jiddawi 2001). While increasing workload, it also has increased their economic purchasing power as well as created more social empowerment of women (Ako 1997). The Tanzanian government has called for the aggressive expansion of seaweed farming in the recently adopted Seaweed Development Strategic Plan (SDSP 2005). The plan calls for the expansion of Kappaphycus alvarezii commercially known as “cottonii” (Figure 1) which commands a higher farm gate price than Eucheuma denticulatum, commercially known as “spinosum” (Figure 2). However, spinosum is more widely grown within the country since cottonii is more environmentally sensitive, leading to disease problems known as “ice-ice” and die-offs (Doty and Alvarez 1975, Uyenco et al. 1981, Collén et al. 1995, Largo 1998). Farmers have traditionally farmed cottonii using the peg and line method but the mortality rate can be high and following a die-off farmers can spend up to 6 months trying to produce seed rather than farming seaweed (Mmochi et al. 2005, Msuya 2006a). To combat the problem of cottonii die-off that is experienced when the peg and line method is used in Tanzania, the Sustainable Coastal Communities and Ecosystems (SUCCESS) Program has introduced the deep-water floating line method to the Msichoke group in Mlingotini village, Bagamoyo District, Tanzania (Mmochi et al. 2005, Msuya 2006a, 2006b). This method has been recommended as a way to increase seaweed production in Tanzania (Rice et al. 2006).
This paper is a comparative economic analysis of two different methods for farming cottonii, the traditionally used peg and line method (off-bottom plot) and the deep-water floating line method (floating line plot). The objectives of this analysis are to compare the productivity and economic returns of the two different methods for farming cottonii as well as compare the financial returns of a buyer-dependent seaweed farmer with those of an independent seaweed farmer. Buyer-dependent seaweed farmers receive their inputs from a buyer rather than purchasing the inputs themselves as independent farmers do. In Tanzania, seaweed farmers have traditionally not purchased their own inputs (ropes, tie-ties, floats and seedlings) because buyers have provided the inputs in exchange for an agreement to adopt recommended production and quality assurance measures and to sell all of their harvest to the buyer at a fixed price dictated by the buyer (SDSP 2005).
Figure 2. Eucheuma denticulatum (spinosum): (Photo credit: Flower E. Msuya)
For this analysis, information on seaweed production costs, harvests and current market prices were collected during interviews of seaweed buyers and members of the Msichoke seaweed farming group at Mlingotini Village in Bagamoyo District. Productivity estimates are taken and compared from key informant interviews, secondary data and from direct in-situ measurements.
2.0 SEAWEED FARMING IN MLINGOTINI VILLAGE
Mlingotini village is located approximately 10 km south of Bagamoyo town. Mllingotini villagers began individually farming seaweed in 1999. In 2002, the farmers came together to form the Msichoke seaweed farming group and began farming as a group. The Msichoke seaweed farming group consists of 58 people of whom 47 are women and 11 are men. This gender distribution is not uncommon, as seaweed farming in Tanzania is a female dominated activity (Pettersson-Löfquist, 1995).
open market (260 Tsh. per dry kg of cottonii as of March 2007) is higher than the price that buyer-dependent farmers obtain (220 Tsh. per dry kg of cottoni as of March 2007). The group exclusively farms cottonii seaweed using two different methods, the off-bottom method and the floating line method as introduced to them by SUCCESS.
The farming takes place in a semi-enclosed shallow lagoon located adjacent to the village that is well protected from open sea conditions. Mlingotini seaweed farmers report that there are high daily tidal variations in the lagoon that result in good water flow and tidal flushing. There is no direct freshwater flow into the lagoon. However, during the long rainy season, seaweed farmers report that there is significant freshwater inflow, which is suspected to be the cause of the seasonal cottonii seaweed offs that occur with the off-bottom method. As a result of the die-off problem, Mlingotini seaweed farmers had not harvested since November 2003. In 2005 the SUCCESS Program started to assist these farmers by piloting a farming method that was new to Tanzania. The deeper water, floating line method was used successfully in the Philippines to address the disease problem caused by salinity fluctuations associated with rainfall events (Hurtado and Agbayani 2002) therefore, the floating line method was piloted by the SUCCESS Program in Mlingotini lagoon in 2005 to combat the cottonii die-offs experienced with the off-bottom method in Tanzania as well (Mmochi et al. 2005, Msuya 2006a, 2006b).
The off-bottom method is used in the shallow subtidal waters of one foot depth at the lowest tide, while the floating line method is used in deeper waters of at least two meters depth at mean sea level. While the off-bottom method is generally considered to be environmentally benign compared to other forms of mariculture (Bryceson 2002), there are rising concerns that it may reduce abundance and biomass of flora and fauna in the underlying seagrass beds where it is cultivated (Eklof et al. 2005). Mangrove poles are often used for the pegs, creating additional concerns of impact on mangrove stands in proximity to seaweed farming areas. In contrast, the floating line method is considered to have less impact than the off-bottom method for two reasons. First, it does not require mangrove pegs. Instead empty recycled water bottles are used for floats. Secondly, it is farmed in deeper water where trampling of seagrass from farmer foot traffic is eliminated.
The floating line method is new to Tanzania. Floating raft farms using bamboo have been tested previously in Tanzania and demonstrated increased productivity compared to off-bottom
methods (Zuberi 2000). However, bamboo floating rafts were not successfully introduced to commercial farmers since the rafts are not very durable (Msuya et al. 2006, Rice et al. 2006) and would need to be replaced more frequently, resulting in increased production costs. Bamboo is not readily available along the coast. In addition, it is difficult and expensive to increase the size of bamboo rafts to a farm size scale practiced by most farmers. Therefore, a floating line system using nylon lines and water bottles for floats addresses the input supply and cost problems faced by the floating bamboo raft method. The first trial of this new floating line method was
conducted in Mlingotini in 2005 with an initial estimated investment cost for construction and equipment for a plot of 27 lines of 10 meters each of 99,775 Tsh. (US$ 78)1.
1
3.0 THE SEAWEED PRODUCTION CYCLE
In both the off-bottom and the floating line methods of farming cottonii, there are eight
production cycles per year but die-offs are estimated to occur in at least one cycle per year in the off-bottom method. The die-off typically occurs in a cycle following the heavy, rainy season (March to May) and is likely due to water salinity, sedimentation from run-off and/or
temperature differentials during this period (Mmochi et al. 2005). To account for the die-offs associated with the bottom method, this economic analysis bases its calculations for the off-bottom plot on eight effective growing seasons but on only seven harvests per annum. Note that when annual labour costs are calculated for the off-bottom method, this means that those costs associated with seed preparation, planting and farm management are incurred eight times per year and that those costs associated with harvesting and post-harvesting activities are incurred only seven times per year. The calculations for the floating line plot are based on eight effective growing seasons and eight harvests per year.
Either a senior female household member or a male household member manages each seaweed farm, and it is estimated that on the average two persons per family are involved in seaweed farming. Many farmers have more than one farm (ranging between 1-5 farms). Most off-bottom plots owned by men tend to be larger than those owned by women. A large, man owned off-bottom plot consists of 30 lines that are 20 meters each in length and a woman owned off-off-bottom plot consists of 30 lines that are 10 meters each in length. Seaweed seedlings are planted once every six weeks. The seaweed grows for six weeks and is harvested and re-planted in the same tidal cycle. After each harvest, the seaweed is dried and stored by the farmers until buyers purchase it. The buyers then export the seaweed to international carrageenan processors. Carrageenan uses are related to their ability to form thick solutions or gels. Cottonii contains kappa carrageenan, a stronger gel that has a higher commercial value than the weaker gel, iota carrageenan, contained in spinosum. The main application for both types of carrageenan is in the food industry (McHugh 2003).
4.0 COSTS OF SEAWEED FARMING
4.1 Initial Investment Costs
4.1.1 Off-Bottom Plots
Each woman owned off-bottom plot has 20-40 lines of 10 meters (m) each, resulting in an average of 30 lines per plot. Rope costs 28 Tsh. per meter; therefore, the 300 m of rope required for lines on a woman owned bottom plot costs 8,334 Tsh. Each larger, man owned off-bottom plot has 30 lines of 20 m each; therefore, a man owned off-off-bottom plot requires 600 m of rope, which costs 16,668 Tsh.
One roll of tie-tie is required for every three lines of 10 m rope. Each roll of tie-tie costs
lines used on a woman owned bottom plot; therefore, the cost for tie-tie on a man owned off-bottom plot is double the cost as on a woman owned off-off-bottom plot.
A woman owned off-bottom plot requires two floaters per line, while a man owned off-bottom plot requires four floaters per line. This is equivalent to 60 and 120 floaters for a woman and man owned off-bottom plot, respectively. This reveals that both types of plots use approximately one floater per 5 m length of line. The floaters are usually empty recycled plastic mineral water bottles. Each bottle costs between 10 and 50 Tsh., resulting in an average cost of 30 Tsh. per bottle.
On both a man and a woman owned off-bottom plot, each line requires two stakes that are mostly taken from mangrove trees. Two stakes per line is equivalent to 60 stakes for both a woman and a man owned off-bottom plot. One stake costs 25 Tsh.; therefore, 60 stakes cost 1,500 Tsh. Since a man owned off-bottom plot has longer lines than a woman owned off-bottom plot, the unit input cost of stakes per unit output is smaller for a man owned plot than for a woman owned plot.
4.1.2 Floating Line Plots
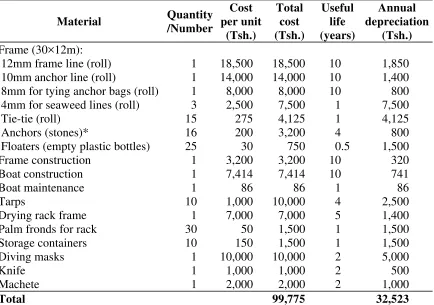
Each floating line plot has 27 lines of 12 m each. A floating line plot frame requires one roll each of 12 mm (18,500 Tsh.), 10 mm (14,000 Tsh.), and 8 mm (8,000 Tsh.) rope.
A floating line plot requires three rolls of 4 mm rope (2,500 Tsh. per roll) for the seaweed lines, and one roll of tie-tie is required for every three 10 m lengths of line. The 27 lines are 12 m each in length; therefore, a floating line plot requires 15 rolls of tie-tie, which costs 4,125 Tsh. when we use the average cost per roll of tie-tie. A floating line plot requires 25 floaters, with an average cost of 30 Tsh. per bottle. Sixteen anchors are also required to secure the floating line plot. Anchors are typically stones that cost approximately 200 Tsh. each.
The total cost of constructing a floating line plot is 63,775 Tsh. This includes the cost of ropes (52,500 Tsh.), tie-ties (4,125 Tsh.), anchors (3,200 Tsh.), floaters (750 Tsh.) and an estimate of the amount that would be paid for the labour to construct the floating line frame and to attach the initial seaweed lines and tie-ties (3,200 Tsh.).
4.1.3 Initial Investment Costs Applicable to Both the Off-Bottom and Floating Line Methods
Farmers work in their farms during spring low tides, each of which lasts about six days. In each six-week production cycle, there is a total of 18 days on which farmers could feasibly work on their farm, but the farm only requires work on eight of the 18 days available per production cycle. Farmers use a non-motorized boat (rowing boat) to work their farms. The SUCCESS Program provided the boat to the farmers. If the farmers had to construct or purchase the same boat themselves, then it would have cost them 430,000 Tsh. A total of 58 farmers use the boat, so each member would have had to contribute 7,413.8 Tsh. The useable life of the boat is about 10 years, and boat maintenance is done once a year at a cost of 5,000 Tsh. Distributing the cost across all 58 farmers, results in a contribution of 86.2 Tsh. per farmer for boat maintenance each year.
Traditionally, seaweed has been dried on palm fronds and cloth materials placed directly on the ground. Ground drying results in poor quality, so drying racks made of wooden stakes and palm fronds that elevate the drying surface off the ground are recommended as a best practice to improve the quality of the final product. (Ask 1999, SDSP 2005) Seaweed should also be covered with tarps during rain events. However, as local buyers do not provide a price differential for seaweed quality, few farmers use racks for drying or cover seaweed with tarps during rainfall events. The poor quality of Tanzania’s seaweed is a continuing problem
expressed by seaweed buyers, and contributes to a lower price when compared with the price that farmers in other countries obtain.2 Farmers will likely use elevated racks and tarps, if buyers are willing to provide a price premium for improved quality product and a price penalty for lower quality product. Without a price differential for quality, farmers do not have an incentive to use drying racks to improve the quality of the final product. Recently, farmers have begun to learn and understand improved post harvest handling best practices, and some farmers have started to construct and use drying racks.
The cost of constructing a drying rack is included in this economic analysis. A drying rack frame is constructed of 2 bundles of wooden stakes each costing 2,000 Tsh. and two rolls of rope each costing 500 Tsh. The construction cost for one rack is approximately 2,000 Tsh., which is the amount paid to a hired builder; therefore, the total cost for a single drying rack frame is 7,000 Tsh. To complete the drying racks, 15 palm fronds are draped across the racks at a cost of 50 Tsh. per frond. The palm fronds must be changed after every three harvests. Tarps are also used to cover and protect the seaweed on the drying racks during rain events.
Farmers also use plastic bags for both carrying wet seaweed from the farm to the drying area and for storage of dried seaweed. A woman owned off-bottom, a man owned off-bottom and a floating line plot require 10, 20 and 10 bags, respectively. Each bag costs between 100 and 200 Tsh., resulting in an average cost of 150 Tsh. per bag.
2
4.2 Labour Costs
This section will identify the labour costs incurred on both a woman and man owned off-bottom plot. The labour costs for a floating line plot are the same in each cycle as those incurred on a woman owned off-bottom plot because they are equivalent in size but with the floating line plot there is no die-off problem, therefore all of the farm operations are done in all eight cycles. 4.2.1 Tying Seed
The seed tying process for both a woman and a man owned off-bottom plot requires the involvement of four family members. Additionally, four youths (aged on average between 10 and 20 years, male and female) are hired to speed up the process of tying seed on a man owned off-bottom plot. For each 20 m line on a man owned off-bottom plot, a hired labourer is paid 80 Tsh. On a man owned off-bottom plot, eight people use eight hours to complete the tying process. Four of the eight people are hired labourers, and are paid a total of 1,200 Tsh., which is equivalent to a wage of 37.5 Tsh. per person per hour. The other four people tying seed on a man owned off-bottom plot are family members who are not paid directly but do incur an opportunity cost3.
In project planning and evaluation “unpaid” family labour often does not appear as an explicit cost of production but in order to achieve a more accurate estimate of production costs and profitability of the various seaweed farming methods in our analysis we will make “unpaid” family labour explicit in our calculations. One reason that “unpaid” family labour does not appear explicitly is that there is substantial debate as to how an opportunity wage or “shadow wage”4 should be chosen or estimated (UNECE et al. 2005). Another reason is that it has
previously been assumed that farm labour is immobile, and therefore; the shadow wage is zero or negligible (Lewis 1954, Ranis and Fei 1961).
One method for estimating the opportunity cost of time for family labour is to use the prevailing market wage assuming that the labour market is at a competitive equilibrium and the farmer is indifferent between working in the farm and in the off-farm market but labour markets in
developing countries frequently do not fit these assumptions, and so there is a substantial debate in development economics as to the appropriate methodology for estimation of a shadow wage for household labour (Jacoby 1993, Skoufias 1994, Menon et al. 2005).
For our analysis, we will use 37.5 Tsh., the hourly amount paid to hired seed tying labour, as a proxy for the shadow wage of family labour. Based on this assumption, on a man owned off-bottom plot, eight people use eight hours to complete the tying process and a labour cost of 2,400 Tsh. is incurred. On a woman owned off-bottom plot, four people use eight hours to complete the tying process and a labour cost of 1,200 Tsh. is incurred. Tying seed is done in all eight production cycles on both off-bottom and floating line plots.
3
The opportunity cost of a person who allocates time to farming is the value of the next best alternative use of the person’s time, which depends on many factors including for example local employment opportunities and
accessibility to urban areas. This value cannot be known for certain as it varies form person to person based on their gender, skills, and mobility.
4
4.2.2 Planting
It is estimated that during each planting period two family members participate in the planting process on both a woman and a man owned off-bottom plot. Working together, the two family members use ½ an hour each to plant a total of 15 lines. Planting is completed over two days in each production cycle; therefore, each family member uses one hour per production cycle to plant a total of 30 lines together. In a year, planting is done in all eight production cycles on both off-bottom and floating line plots.
4.2.3 Farm Management
It is estimated that one family member attends the farm on each outing for management on both a woman and a man owned off-bottom plot. Farm management is done for ½ an hour per day on six days in each production cycle; therefore, there is a total of three man hours allocated to farm management per production cycle. Note that the same amount of time is used for both a woman and a man owned off-bottom plot even though they are different sizes because the men and women farmers travel together in a single boat going out to and coming in from the farms. In a year, farm management is done in all eight production cycles on both off-bottom and floating line plots.
4.2.4 Harvesting
Four family members assist in the harvesting process on both a woman and a man owned off-bottom plot. A man owned off-off-bottom plot must hire an additional four labourers to assist in the harvesting process. It takes one hour for four people to harvest 10 lines of 10 meters each. Both farms harvest up to 10 lines per day, thus they use three days to harvest 30 lines per production cycle. This results in a total of three man hours per person per production cycle for harvesting on both a woman and a man owned off-bottom plot. Each hired labourer is paid 500 Tsh. for one hour of harvesting. In a year, harvesting is done in seven of the eight production cycles on an off-bottom plot and in all eight production cycles on a floating line plot.
4.2.5 Carrying to Dry
A hired cart is used to carry seaweed to the drying place. For every eight lines of 20 m carried to the drying place, 1,000 Tsh. are paid to hire the cart and transport takes one hour to complete. To carry 30 lines of 20 m each, the process takes about four hours, thus it will take two hours to carry 30 lines of 10 m line of seaweed to the drying place. In a year, seaweed is carried to the drying place in seven of the eight production cycles on an off-bottom plot and in all eight production cycles on a floating line plot.
4.2.6 Packaging
4.2.7 Carrying to the Market
A carrying device is hired to carry dried seaweed from storage to the market. The cost of hiring one person or device to carry one sack of 100 kg to the market is 300 Tsh. per hour. A woman owned off-bottom plot requires one sack, while a man owned off-bottom plot requires two sacks. The process of carrying one sack to the market takes about ½ an hour; therefore, a man and woman owned off-bottom plot incur a cost of 150 Tsh. and 300 Tsh., respectively, per cycle for delivery of the dried seaweed to the market. Dried seaweed is carried to the market once per cycle in seven of the eight production cycles on an off-bottom plot and in all eight production cycles on a floating line plot.
4.2.8 Tie-tie and Rope Separation
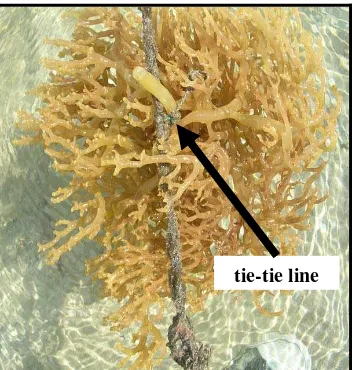
Farmers routinely work to separate tie-ties (see Figure 3) and ropes that are entangled together at sea5. It is estimated that 4 family members separate tie-ties from the rope on both a woman and a man owned off-bottom plot. It takes one hour to separate four lines of 20 m each. For 30 lines of 20 m each it will take 7.5 hours to separate the tie-ties and ropes. Likewise, it takes one hour to separate eight lines of 10 m each, thus for 30 lines of 10 m each it will take 3.75 hours to separate the tie-ties from the ropes. Tie-tie separation is done in all eight production cycles on both off-bottom and floating line plots.
tie-tie line
Figure 3. One tie-tie of K. alvarezii. (Photo credit: Flower E. Msuya)
5.0 PROFITABILITY
5.1 Off-Bottom Method
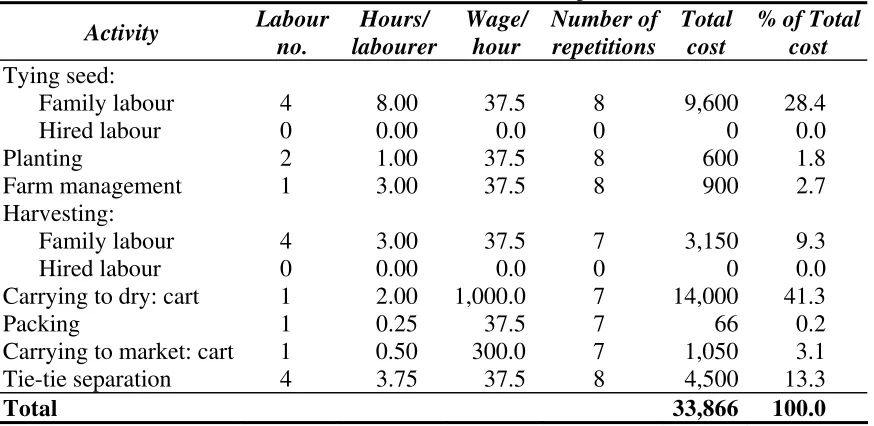
The annual labour cost, initial material investment cost and the returns of a woman and a man owned off-bottom plot are estimated in Tables 1 to 5. Total annual labour cost for a woman
5
owned off-bottom plot (Table 1) is estimated at 33,866Tsh. The total annual labour cost is composed of costs associated with seed preparation such as tie-tie separation and tying seed (41.6%), planting (1.8%), farm management (2.7%), harvesting (9.3%), and post harvesting activities such as carrying to dry, packing and carrying to the market (44.6%). Total annual labour cost for a man owned off-bottom plot (Table 2) is estimated at 105,081Tsh. The total annual labour cost is composed of those costs associated with seed preparation (26.8%), planting (0.6%), farm management (0.9%), harvesting (43.0%), and post harvesting activities (28.8%). The largest share of labour costs incurred at a woman owned off-bottom plot is associated with the labour required to tie seed and to carry dry seaweed to the market, where as on a man owned off-bottom plot the costs associated with harvesting account for the greatest proportion of total labour costs. Harvesting costs are greater on a man owned off-bottom plot than on a woman owned off-bottom plot because in order to harvest the larger quantity of seaweed that is produced on a man owned off-bottom plot, labour must be hired, where as on a woman owned off-bottom plot only family labour is used. Hired labour for harvesting is intensive work and therefore more costly than family labour.
The total initial material investment cost for constructing a woman and man owned off-bottom plot is 55,884 Tsh. and 74,268 Tsh., respectively. Annual depreciation accounts for 33,711 Tsh. and 44,246 Tsh. for a woman and a man owned off-bottom plot, respectively (Tables 3 & 4). Table 1. Annual labour cost for a woman owned off-bottom plot.
Table 2. Annual labour cost for a man owned off-bottom plot.
Table 4. Initial investment cost for a man owned off-bottom plot.
Others (Zuberi 2000, Hurtado 2002) suggest differences in growth rates between off-bottom and floating methods, therefore; we tested this hypothesis. Six lines of harvested seaweed were weighed and daily growth rates were calculated. They showed no statistically significant difference in mean growth rates (see Table 5). Therefore we use an identical growth rate (and productivity estimate) in our revenue and profitability calculations.
Table 5. Mean cottonii daily growth rate on off-bottom and floating lines
Method N Mean SD
Off-bottom 6 0.129 0.029
Floating line 6 0.129 0.034
While we use a constant growth rate for both methods in our analysis , we also assess the impact that higher productivity would have on the profitability of the floating method (in the discussion section) based on previous studies (Zuberi 2000, Hurtado 2002) that have demonstrated higher productivity of floating methods compared to the traditional off-bottom method.
Farmers leave three lines of wet seaweed in the water for seed; therefore, 27 lines are harvested per production cycle on both a man and a woman owned off-bottom plot. Using the SDSP’s productivity estimate, on average in one production cycle a woman owned off-bottom plot’s harvest is 94.5 kg of dry seaweed and a man owned off-bottom plot’s harvest is 189 kg of dry seaweed.
In March 2007, the price of cottonii received by an independent farmer was 260 Tsh. per dry kg, while the price received by a buyer-dependent farmer was 220 Tsh. per dry kg.
Independent farmers received 40 Tsh. more per dry kg than buyer-dependent farmers received; however, they also incurred higher material investment costs than buyer-dependent farmers. Independent farmers incur higher material investment costs because they must purchase all of their material inputs, unlike buyer-dependent farmers who receive a portion of their material inputs, such as ropes and tie-ties, from buyers.
To determine if it is advantageous to be an independent farmer; that is to see if an independent farmer obtains a price premium for each dry kg of seaweed produced and sold, we must compare the difference between an independent and a buyer-dependent farmer’s annual material
investment cost per dry kg of seaweed produced and the current price differential of 40 Tsh. per dry kg.
The difference between an independent and a buyer-dependent’s annual material investment cost is the annual depreciation of ropes and tie ties, which is 11,084 Tsh. and 22,168 Tsh. on a
woman and a man owned off-bottom plot, respectively (Table 3 and 4). The estimated annual average production of seaweed on a woman owned off-bottom plot and a man owned off-bottom plot is 661.5 kg and 1,323 kg, respectively. When we divide the difference between the
independent and buyer-dependent’s annual material investment costs by the annual average production of seaweed, we find that on both a woman and a man owned off-bottom plot an independent farmer must invest 16.8 Tsh. more than a buyer-dependent farmer per kg of dry seaweed produced.
Based on these calculations independent seaweed farmers are receiving a price premium of 23.2 Tsh. per kilogram over what they would be receiving if they were buyer-dependent. However, no interest is used in calculating the annual material investment cost, and independent seaweed farmers may not possess the resources required to purchase the ropes and tie-ties to begin farming; therefore, we must consider the affect that a loan may have on the price premium paid to the independent seaweed farmers.
FINCA, a micro-credit lending group that is supporting some seaweed farmers and others in Mlingotini, charges an effective annual interest rate of approximately 48%. Factoring interest into the difference between an independent and a buyer-dependent farmer’s annual material investment costs, we arrive at a difference of 16,404 Tsh. and 32,809 Tsh. for a woman and a man owned off-bottom plot, respectively. When interest is included, we find that on both a woman and a man owned off-bottom plot an independent farmer must invest 24.8 Tsh. more than a buyer-dependent farmer per kg of dry seaweed produced. Under this scenario, both a man and a woman independent off-bottom seaweed farm receive a price premium of 15.2 Tsh. per
Under normal conditions, a woman owned off-bottom plot produces an estimated annual average of 661.5 kg of dry seaweed, which in is valued at approximately 171,990 Tsh. (94.5 kg X 7 cycles X 260 Tsh.) for an independent farmer, and a man owned off-bottom plot produces an estimated annual average of 1,323 kg of dry seaweed, which is valued at approximately 343,980 Tsh. (189 kg X 7cycles X 260 Tsh.) for an independent farmer. After deducting the depreciated material and the labour costs required to operate the farms, the estimated annual net profit is 104,413Tsh. on a woman owned off-bottom plot and 194,653 Tsh. on a man owned off-bottom plot (Table 6).
Table 6. Annual costs and returns of woman and man owned off-bottom plots. Item
Total annual costs 67,577 149,327
Annual net profit 104,413 194,653
5.2 Floating Line Method
The annual labour cost, initial investment cost and the returns of a floating line plot are estimated in Tables 7, 8 and 9.
The labour costs per production cycle, as shown in Table 6, for a floating line plot are the same as those incurred on a women owned off-bottom plot because they are equivalent in size but with the floating line plot there is no die-off problem; therefore, all the labour activities are carried out in each of the eight production cycles.
To estimate the size of a floating line plot’s harvest, we will use the SDSP’s reported
productivity estimate of 0.35 kg dry seaweed per meter line per harvest cycle. By using 0.35 kg dry seaweed per meter line for the calculation of harvests from a floating line plot, we are
assuming in this part of the analysis that the floating and off-bottom plots are equally productive. Each floating line plot has 27 lines. Farmers keep and use 3 lines of their harvest for seed; therefore, farmers using the floating line plot will harvest 24 lines of 12 m each in length per production cycle. On average in one production cycle a floating line plot harvest will be 101 kg of dry seaweed.
It should be noted that a harvest of 101 kg of dry seaweed in one production cycle is a
conservative estimate. Harvests from the floating line plot could potentially be much higher as demonstrated in previous tests of floating systems (Hurtado 2002, Zuberi 2000). For example, floating rafts made of bamboo were previously tested in Tanzania and demonstrated that yields from the floating method were 3.27 times the yields from the traditional off-bottom method (Zuberi 2000). If this were the case in our example, then on average in one production cycle a floating line plot harvest would be estimated at 330 kg of dry seaweed.
In March 2007, the price of cottonii received by an independent farmer was 260 Tsh. per dry kg, while the price received by a buyer-dependent farmer was 220 Tsh. per dry kg.
Independent farmers received 40 Tsh. more per dry kg than a buyer-dependent farmer received; however, independent farmers also incurred higher material investment costs than
buyer-dependent farmers because inbuyer-dependent farmers must purchase all of their inputs, where as, buyers provide input materials, such as ropes and tie ties, to buyer-dependent farmers. Table 7. Annual labour cost for the floating line plot.
Table 8. Initial investment cost of a floating line plot.
* Stones can be replaced by sand-filled plastic bags at a cost of 100 Tsh. per empty bag and 300 Tsh. per bag of sand.
To determine if it is advantageous to be an independent farmer; that is to see if an independent farmer obtains a price premium for each dry kg of seaweed produced and sold, we must compare the difference between an independent and a buyer-dependent farmer’s annual material
investment cost per dry kg of seaweed produced and the current price differential of 40 Tsh. per dry kg. The difference between an independent and a buyer-dependent’s annual material
investment cost on a floating plot is the annual depreciation of ropes and tie ties, which is 15,675 Tsh. The estimated annual average production of seaweed on a floating line plot is 808 kg. When we divide the difference between the independent and buyer-dependent’s annual material investment costs by the annual average production of seaweed, we find that on a floating line plot an independent farmer must invest 19.4 Tsh. more than a buyer-dependent farmer per kg of dry seaweed produced.
Factoring interest (48% - based on the actual annual rate charged by FINCA) into the difference between an independent and a buyer-dependent farmer’s annual material investment costs, we arrive at a difference of 23,199 Tsh. When interest is included, we find that on a floating line plot an independent farmer must invest 28.7 Tsh. more than a buyer-dependent farmer per kg of dry seaweed produced. Under this scenario, an independent floating line farmer receives a price premium of 11.3 Tsh. per kilogram over what they would be getting if they were
buyer-dependent.
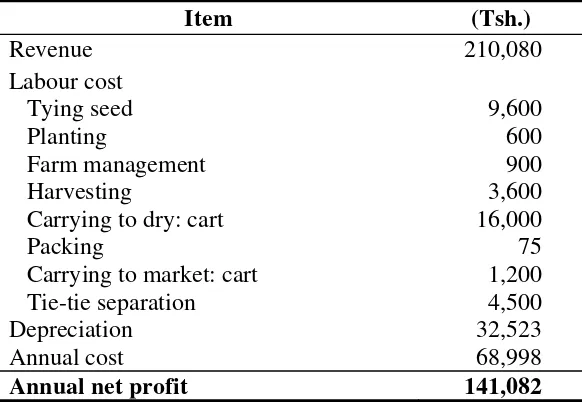
Under normal conditions, a floating line plot produces an annual average of 808 kg of dry seaweed, which is valued at approximately 210,080 Tsh. (101 kg X 8cycles X 260 Tsh.) for an independent seaweed farmer. After deducting all material and labour costs required to operate a farm, the estimated annual net profit is 141,082Tsh. on a floating line plot (Table 9). Note that this is a conservative estimate of the annual net profit from a floating line plot. If we estimate the annual net profits using productivity rates demonstrated in Zuberi (2000), then the estimated annual net profit would be 617,963 Tsh.
Table 9. Annual costs and returns of a floating line plot.
Item (Tsh.)
Revenue 210,080
Labour cost
Tying seed 9,600
Planting 600
Farm management 900
Harvesting 3,600
Carrying to dry: cart 16,000
Packing 75
Carrying to market: cart 1,200
Tie-tie separation 4,500
Depreciation 32,523
Annual cost 68,998
Annual net profit 141,082
6.0 DISCUSSION AND ANALYSIS
The main purpose of this comparative economic analysis is to calculate and compare the financial returns of two different methods of farming cottonii. An additional purpose is to compare the financial returns of a seaweed farmer who is buyer-dependent with one who is independent. This section will make such comparisons, and the final section will identify the recommendations that arise from this analysis.
man owned off-bottom plot, harvesting is also a large component of the labour costs. Planting and farm management are the least costly activities in terms of labour for both methods. Table 10. Comparison of annual material and labour costs by farming method.
Annual Costs (Tsh.)
Annual depreciation of initial investment costs 33,711 44,246 32,523
Annual labour cost 33,666 105,081 36,475
Total annual costs 67,377 149,327 68,997
Total annual cost per meter of line 225 249 213
1
Number of meters of line in a standard women owned off-bottom plot is 300
2
Number of meters of line in a standard man owned off-bottom plot is 600
3
Number of meters of line in a standard floating plot is 324
0
Figure 4. Distribution of labour costs by farming method.
Table 11 summarizes the productivity of cottonii growth by method. The analysis here uses the same harvest per meter of line per cycle for woman and man owned off-bottom plots and a floating line plot6. The results show a significant difference between the off-bottom and floating line plots when we look at annual production – harvest per meter of line per year. On average the floating line method produces 0.35 kg more seaweed per meter line per year than the off-bottom method. The reason for the difference in annual productivity between the off-bottom and the floating line method is that die-offs are less likely with the floating line method. The reason why
6
die-offs are less likely with the floating line method is not known but may be due to non-ideal conditions for cottonii of temperature, suspended sediments and salinity of the off-bottom method in the shallow water where the off-bottom method is conducted, compared to conditions in deeper water where floating line plots are located.
Table 11. Productivity by farming method.
Farmer Type
Estimated seaweed production per cycle (dry kg) 94.5 189 101
Number of harvests per year 7 7 8
Estimated annual seaweed production (dry kg) 661.5 1,323 808 Harvest per meter of harvested line1 per year ( dry kg) 2.45 2.45 2.80 1
The total length of line harvested per production cycle on a woman owned off-bottom, man owned off- bottom, and floating line plot is 270 m, 540 m, and 288 m, respectively.
Table 12 summarizes the total annual profit for farming cottonii for both the off-bottom and floating line methods for buyer-dependent, independent, and independent seaweed farmers with FINCA financed ropes and tie-ties. The results of this analysis reveal that the most profitable method of seaweed farming regardless of whether a farmer is buyer-dependent or independent is the floating line method. As depicted in Figure 5, the average annual profit per meter line on a floating line plot (435 Tsh.) is greater than that which is obtained per meter line on either a woman or a man owned off-bottom plot (348 and 324 Tsh., respectively). Note that the average annual profit per meter line on a floating line plot of 435 Tsh. is a conservative analysis. If we estimate annual production based on the productivity demonstrated in Zuberi 2000, then the average annual profit per meter line on a floating line plot would be 2,145 Tsh. The results depicted in Figure 5 also show that independent seaweed farming is the advantageous ownership decision for both methods regardless of whether or not loans are needed for initial investments in farming. Additionally, as the number of independent growers increase, their bargaining power with buyers is likely to increase. This might provide higher and more advantageous price premiums in the future.
Table 12. Annual profits of cottonii seaweed farmers by farming method.
Annual Profits (Tsh.)
Buyer-dependent4 cottonii seaweed farmer 93,329 172,485 125,408 Independent5 cottonii seaweed farmer 104,413 194,653 141,083 Independent cottonii seaweed farmer with
FINCA financed ropes and tie-ties 99,093 184,013 133,559 1
Number of meters of line in a standard women owned off-bottom plot is 300
2
Number of meters of line in a standard man owned off-bottom plot is 600
3
Number of meters of line in a standard floating plot is 324
4 The price per kg of
cottonii received by a buyer-dependent seaweed farmer is 220 Tsh.
5
0
50
100
150
200
250
300
350
400
450
500
Woman Owned Off-bottom Man Owned Off-bottom Floating Line Seaweed Framing Method
Average Annual Profit per Meter of Line (Tsh.)
Buyer-Dependent Farmer FINCA Financed Independent Farmer Independent Farmer
Figure 5. Average annual profit per meter line of cottonii by farming method.
The “Msichoke” group at Mlingotini has expressed a desire to expand their seaweed production by expanding the size of each member’s farm from 30 to 90 lines and by recruiting new
members into their farming group. Some seaweed buyers confirm that current market demand would support the expansion target of Mlingotini.
Some seaweed buyers in Tanzania advocate a production target of 1000 kg of dry seaweed per farmer per cycle on a plot of 100 lines of 10 meters each. This is equivalent to 10 kg per line per production cycle. In order for a farmer to reach this target on a woman owned off-bottom, a man owned off-bottom and a floating line plot, the farmer would need to increase the number of lines by approximately eleven, five and ten times the current number of lines in their plots,
respectively. This would increase production on a woman owned bottom, man owned off-bottom and a floating line plot from 94.5 kg, 189 kg and 101 kg, respectively, to 1000 kg per harvest per production cycle.
days in each production cycle. To reach the production goal of 1,000 kg per farmer, a current floating line plot would need to be increased to about 10 times its current size - 270 lines of 12 meters each. A floating line plot of this dimension would require approximately 667.5 person hours per production cycle, assuming that constant economies of scale persist as production is scaled up. If farmers continued farming on only eight of the 18 days available in each
production cycle for farming, the floating line plot of 270 lines would require 83.4 person hours per day. It is likely that the farmer would choose to tend to the farm over a greater number of days in each production cycle. For example, if the farmer chooses to tend to the farm on all of the 18 days available per production cycle, then the floating line plot of 270 lines would require 37 person hours per day. A farmer’s ability to reach a production target of 1,000 kg per cycle depends on the amount of free time the farmer has that he or she would be willing to allocate to seaweed farming, on the farmer’s ability and desire to reallocate time from another activity to seaweed farming, and on the farmer’s ability to obtain assistance from the casual labour pool. In Zanzibar, seaweed farming has replaced some economic activities of women seaweed farmers including reducing the time spent to camp in land-based agricultural activities
(Pettersson-Löfquist 1995, Msuya 2006c). The level of effort (37 person hours/day) required in Mlingotini to meet the production targets mentioned above would also require substitution of seaweed farming for other productive and/or non-productive activities. This level of effort is questionable and may not even be desirable. For instance, women are often involved in numerous productive and household activities such as firewood gathering, cooking, cleaning, child-rearing and agricultural production. Men are often engaged in fishing and other productive activities as well. Youths, if of school age, will unlikely have that much additional labour time available. It may even be undesirable to promote large increases in work hours as it may have negative social impacts, such as increasing school drop out rates among youths who may spend more time farming. There is a need to look carefully at daily and seasonal calendars of activities of household members – men, women and youths to see if there is free time available. Current farmers would need to be asked about their willingness and ability to increase farm size and allocation of time to seaweed farming and about their willingness to substitute seaweed farming for other
productive activities. It is uncertain whether this is an economically and socially viable option. There is also a need to compare relative economic advantage of seaweed farming to earnings from other productive activities as was done in Zanzibar (Shechambo et al. 1996).
The advantages of increased production cannot be overemphasized since seaweed farming has been shown to have positively impacted coastal households and women in particular
(Shechambo et al. 1996, Mshigeni 1998, Msuya 2006c). There are alternative strategies for increasing production rather than just raising individual farmer output. For instance, farms that are under individual or family ownership could hire additional contract labour, increasing the total labour pool per farm, since increasing household labour may not be viable or sufficiently large enough to make up the difference required. Alternatively, the number of farms of the same size could be increased to increase overall production in a village. Often, buyers are not as interested in per farmer output, as long as a critical mass of good quality seaweed is available for purchase at one time. If stored for too long in the villages, seaweed quality deteriorates. Buyers would like to see large enough quantities produced (and stored properly) so that the time
between scheduled product pick-ups is reduced. Transport costs from the village to the
worthwhile. Buyers therefore want to see large quantities of the product available for purchase at any one time to make a separate purchase trip to the village worthwhile.
Rather than individual farmer production targets, it may be worthwhile to consider what is the optimum or minimal total production per harvest needed for the village as a whole to make the marketing trips worthwhile to buyers, and use this as a village/lagoon production target rather than individual production quotas. If we know what the minimal monthly production
requirements are, and what the farm production rates are, we can determine the total potential production capacity needed in a village.
While the floating line plot method is used to combat the problem of cottonii die-off and increased production (Msuya 2006a, 2006b) they are also acting as fish-aggregating devices (FADs). Initial experiments on using basket traps known as “dema” at Pande have estimated fish catch of 10 kg per dema or 30 kg of fish for three dema every second day. This added product has lead to some farmers commenting that they want to farm seaweed in floating line plots in order to harvest more fish. Unfortunately, this feature of floating line plots has also led to conflicts between farmers and fishers who like to fish within the seaweed farm plots.
Entanglement of fishing and farming lines occurs which leads to damage of seaweed farm plots. There is also competition and conflicts over marine space. Space is needed for the passage of boats coming into and going out of the lagoon, as well as mooring space. Due to competition for space between fishers, seaweed farmers and passageways for boats, the SUCCESS Program began developing community-based zoning plans for the Mlingotini lagoon. Seaweed farmers in the nearby villages of Kondo and Pande, who were also attempting to use the floating line
method, have stopped farming in part due to these conflicts over space. The villages of Mlingotini, Pande and Kondo have drafted by-laws that are now pending final approval by the district. Farmers interested in re-establishing and expanding floating farms have stated that they will redeploy their floating farming gear once the ordinances are endorsed by the district.
7.0 CONCLUSIONS AND RECOMMENDATIONS
Based on the results of this comparative economic analysis of the off-bottom and floating line methods of farming cottonii, the following conclusions and recommendations have been drawn: The floating line method is economically superior to the traditionally used off-bottom method of farming cottonii and therefore should be promoted. This is based on our findings that on an annual basis there is a significant difference between the productivity of the off-bottom and floating line plots. On average the floating line method produces 0.35 kg more dried cottonii per meter line than the off-bottom method. This difference is attributable to the floating line advantage of reducing the die-offs that commonly occur when cottonii is farmed using the off-bottom method. The floating line method creates a seed bank that can be moved if
device, and by setting up basket traps known as “dema,” seaweed farmers can also harvest a substantial amount of fish.
Independent seaweed farming is economically superior to buyer-dependent farming. However, independent seaweed farming should be promoted with the caveat that
independent farmers must raise their own capital to purchase inputs and assume greater risk. This economic analysis finds that independence is advantageous for both the off-bottom and floating farm system since the profit per kg of dried cottonii is higher for independent farmers than for buyer-dependent farmers regardless of whether loans are needed or not for initial investments in farming. However, it should be noted that although the independent farmer achieves a higher profit per kg, they must also assume a greater degree of risk than the buyer-dependent farmer. The greater profit potential of inbuyer-dependent seaweed farming needs to be weighed against the greater risks that also accompany it.
It is recommended that independent farmers expand their current production of cottonii. Production can be expanded by either current seaweed farms expanding in size or additional farmers starting new farms. It is likely that some form of combined strategy will be needed. It is unlikely that individual farmers could reach the 1000 kg harvest goal per production cycle unless they tap assistance from an additional casual labour pool. Expanded production can be catalyzed if farmers have access to loans for capital investment. FINCA currently has granted loans to farmers in Mlingotini at a rate of 48% but the loans are generally not used for investing in
seaweed farming because the frequency of loan payments is inconsistent with the production and sale cycles of seaweed farming. Seaweed farming using either the off-bottom or floating farm method is profitable even if a loan is required at this interest rate. Therefore alternative micro credit schemes should be investigated to identify financing options with lower interest rates and with loan repayment schemes that are more consistent with the production and sales cycle of seaweed farming. One such option to investigate is a Savings and Credit Co-operative Society (SACCOS). Overall production in Mlingotini will be limited by farming space availability within the lagoon.
REFERENCES CITED
Ako, R.M. 1997. Household resource management and patriarchal relationships: the impact of seaweed farming in Paje village, Zanzibar. In: C. Creighton and C.K. Omari (eds.) Gender, Family and Household in Tanzania. p.156-177.
Ask, Erik I. 1999. Cottonii and Spinosum Cultivation Handbook. FMC Corporation. 32p. Bryceson, I. 2002. Coastal aquaculture developments in Tanzania: sustainable and
non-sustainable experience. Western Indian Ocean J. Mar. Sci. 1(1):1-10.
Collén, Jonas, Matern Mtolera, Katarina Abrahamsson, Adelaida Semesi and Marianne Pedersén. 1995. Farming and Physiology of the Red Algae Eucheuma: Growing Commercial Importance in East Africa. Ambio 24(7-8): 497-501.
Doty, M. and V. Alvarez. 1975. Status, problems, advances and economics of Eucheuma farms. Marine Technology Society 9(4):30-34.
Eklof, J.S., M. de la Torre Castro, L. Adelskold, N.S. Jiddawi and N. Kautsky. 2005.
Differences in macrofaunal and seagrass assemblages in seagrass beds with and without seaweed farms. Estuarine, Coastal and Shelf Science 63:385-396.
Hurtado, A.Q. and R.F. Agbayani. 2002. Deep-sea farming of Kappaphycus using multiple raft long-line method. Botanica Marina 45(5):438-444.
Jacoby, H. Gl 1993. Shadow Wages and Peasant Family Labour Supply: An Econometric Application to Peruvian Sierra. Review of Economic Studies 60(4): 903-21.
Lewis, W. A. 1954. Economic development with unlimited supplies of labour. Manchester School of Economic and Social Studies 22: 139-191.
McHugh, Dennis J. 2003. A guide to the seaweed industry. FAO Fishers Technical Paper, No. 441.
Mmochi, A.J., Y.W. Shaghude and F.E. Msuya. 2005. Comparative Study of Seaweed Farms in Tanga, Tanzania. Submitted to USAID-ACDI/VOCA SEEGAAD Project, August 2005, 37p.
Mshigeni, K.E. 1998. The seaweed resources of Tanzania. In: A.T. Critchley & M. Ohno (eds.) Seaweed Resources of the World. p.389-397.
Msuya, F.E. 2006a. Seaweed Farming as a Potential Cluster In:Proceedings of the Innovation Systems and Clusters Programme in Tanzania (ISCP-Tz): Cluster Initiative Launching Workshop, Dar es Salaam, Tanzania, Feb. 9, 2006. p.102-113.
Msuya, F.E. 2006b. The Seaweed Cluster Initiative in Zanzibar, Tanzania. Paper presented at the 3rd Regional Conference on Innovation Systems and Innovative Clusters in Africa, Kunduchi Beach Hotel, 3-7 September 2006. 12p.
Ranis, G. and J. Fei. 1961. A theory of economic development. American Economic Review 56: 533-558.
Rice, M.K., A.J. Mmochi, L. Zuiberi and R.M. Savoie. 2006. World Aquaculture 37(4):50-57. SDSP. 2005. Seaweed Development Strategic Plan Ministry of Natural Resources and Tourism,
The United Republic of Tanzania, Dar es Salaam, Tanzania. 47p.
Shechambo, F., Z. Ngazy and F.E. Msuya. 1996. Socio-Economic Impacts of Seaweed Farming in the East Coast of Zanzibar, Tanzania. Report submitted to the Canadian International Development Agency (CIDA), Institute of Marine Sciences, University of Dar es Salaam, Zanzibar, Tanzania, IMS 1997/06. 81p.
Largo D.B., K. Fukami, M. Adachi and T. Nishijima. 1998. Immunofluorescent detection of ice-ice disease promoting bacterial strain Vibrio sp. P11 of the farmed macroalga,
Kappaphycus alvarezii (Gigartinales, Rhodophyta). Journal of Marine Biotechnology 6(3):178-182.
Menon, M., F. Perali and F. Rosati. 2005. The Shadow Wage of Child Labour: An Application to Nepal. Understanding Children’s Work: An Inter-Agency Research Cooperation Project.
Pettersson-Löfquist, Per. 1995. The Development of Open-water Algae Farming in Zanzibar: Reflections on the Socioeconomic Impact. Ambio 24(7-8): 487-491.
Skoufias, E. 1994. Using Shadow Wages to Estimate Labour Supply of Agricultural Households. American Journal of Agricultural Economics 76(2):215-27
UNECE, Eurostat, FAO, OECD, and World Bank. 2005. The Wye Group Handbook: Rural Households’ Livelihood and Well-Being. Prepared by a Task Force of the
Intersecretariat Working Group on Agriculture Statistics and Rural Indicators
Uyenco F.R., L. S. Saniel and G. S. Jacinto. 1981. The “Ice-Ice” Problem in Seaweed Farming. In: Xth International Seaweed Symposium. Walter de Gruyter, New York, p.625-630. Wallevik, H.B. and N. Jiddawi. 2001. Impacts of Tourism on the activities of the women of the
southeast coast of Unguja, Zanzibar. In: M.D. Richmond and J. Francis (eds.) Marine Science Development in Tanzania and Eastern Africa. Proceedings of the 20th
Anniversary Conference on Advances in Marine Science in Tanzania. 28 June – 1 July 1999, Zanzibar, Tanzania. Institute of Marine Sciences, University of Dar es Salaam and the Western Indian Ocean Marine Science Association. p.535-550.
Zuberi, L. 2000. The Final Report on Seaweed Farming Raft Method of Cultivation, Held at Moa, Kijiru Villages of Tanga Region. Tanga Coastal Zone Conservation and