Page 1 of 10
THIS REPORT CONTAINS ASSESSMENTS OF COMMODITY AND TRADE ISSUES MADE BY USDA STAFF AND NOT NECESSARILY STATEMENTS OF OFFICIAL U.S. GOVERNMENT POLICY
Date: GAIN Report Number:
Approved By:
Prepared By:
Report Highlights:
Post forecasts that in marketing year (MY) 2017/18 Indian almond imports (shelled-basis) will show a year on year decrease of five-percent to 95,000 MT. This decrease is expected because the Indian festive season begins earlier than the crop harvest in the United States, which will make US imports less attractive. To fill the gap, domestic walnut production is expected to rise by six-percent in MY 2017/18 to 34,000 MT (in-shell basis). Nevertheless, despite this increase in production, demand growth will continue to outpace production and eventually imports will again rise.
Shubhi Mishra Mark Wallace
2017
Tree Nuts Annual
India
Page 2 of 10
Commodities:
Production:
Domestic almond production in MY 2017/18 (August/July) is forecast at 1,000 MT (kernel-weight basis), a nine-percent decrease over last year. Indian almond production is limited to the hill states of Jammu & Kashmir and Himachal Pradesh; the annual yield per tree is usually low and ranges between 1,000-1,500 nuts. Shelling rates generally range between 20 and 30 percent for hard-shell varieties, but are about 40 percent for thin-shelled varieties.
Consumption:
Demand growth for almonds is mostly driven by India’s expanding middle class and increased
consumer awareness of products perceived as healthful. Indian almond consumption in MY 2017/18 is forecast at 97,000 MT, a 10 percent increase over the previous year. This increase is driven by low market prices, a weaker dollar, changing consumer preference, and increased demand during the non-festive season. Also, the early non-festive season is expected to lead to higher almond stocks in MY 2017/18, which are forecast at 39,400 MT.
Traditionally, demand for nuts mostly occurs during the festive season, which runs from September to January. Now, however, growing perception among Indian consumers about nutritional and health benefits associated with almonds is driving domestic demand beyond just the festive and winter season. Indian consumers regard almonds as a high-energy food, one which is well-suited for children,
physically active people, and recovering patients. In addition to increased consumer preference for whole nuts, food processors are also using almonds in a broader variety of product categories such as breakfast cereals, snack foods, health foods, beverages, and confectionary products. The cosmetic industry, as well, is also increasing its use of oil extracted from lower-quality almond kernels.
Prices:
Price-sensitive consumers find current market prices attractive, particularly for Californian non-pareil
almonds, which have the size, uniform ‘eye’ shape, and sweetness desired. Australian non-pareil and Carmel varieties also account for a growing segment of the Indian market. Iranian varieties like Mamra
and Qumi are popular in the western and northwestern regions of India (e.g. Rajasthan and Gujarat), and often get a price premium.
Ample production and a strong rupee relative to the US dollar have driven average almond prices in India down by about 30 percent in MY 2016/17 (Table 3); these conditions are expected to remain constant through the festive season.
Page 3 of 10 Source: Industry and Trade Sources
Trade:
Low market prices, a relatively strong Indian rupee, changing consumer preference, and increased demand during non-festive season have driven almond imports to a record high at 99,500 MT in MY 2016/17. For 2017, however, the early festive season and late harvest in the United States likely will depress imports by five percent from that figure.
During MY 2016/17, the U.S. market share accounted for 78 percent of India’s total volume of almond
trade. Australia, the next largest exporter to India, had 17 percent market share (Table 4.1 and 4.2). Almond imports from the United States and Australia are mostly in-shell, non-pareil or Carmel varieties and are shelled locally. Almonds from other origins are typically already shelled. Most almonds in India are sold by weight in loose form; only about six to eight percent of retail sales are packaged.
Trade Policy and Marketing Opportunity:
Although India does not maintain quantitative restrictions for almond imports, U.S. almonds face tariffs of INR 35/kg (in-shell basis) and INR 65/kg (shelled basis) (Table 6). Also, since 2006, India’s
Directorate of Plant Protection, Quarantine and Storage Amended Order 2003 has required phosphine fumigation in the country of origin prior to shipment. In addition, the new Goods and Service Tax (GST), implemented July 2017, will assess a 12 percent tax on both domestic and imported almonds. (Table 6).
Page 4 of 10 bakeries, boutique pastry shops, food processors such as cookie manufacturers and breakfast cereal companies, and institutional end users. Regions in southern and eastern India may also present new marketing opportunities.
Production, Supply and Demand Data Statistics:
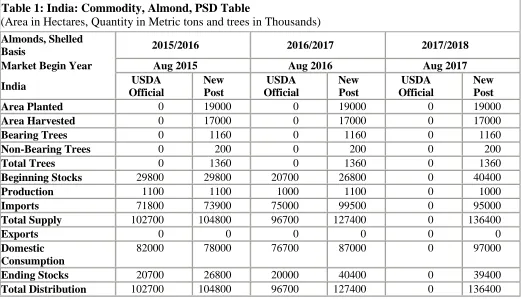
Table 1: India: Commodity, Almond, PSD Table
(Area in Hectares, Quantity in Metric tons and trees in Thousands)
Almonds, Shelled
Basis 2015/2016 2016/2017 2017/2018
Market Begin Year Aug 2015 Aug 2016 Aug 2017
India USDA
Official
New Post
USDA Official
New Post
USDA Official
New Post
Area Planted 0 19000 0 19000 0 19000
Area Harvested 0 17000 0 17000 0 17000
Bearing Trees 0 1160 0 1160 0 1160
Non-Bearing Trees 0 200 0 200 0 200
Total Trees 0 1360 0 1360 0 1360
Beginning Stocks 29800 29800 20700 26800 0 40400
Production 1100 1100 1000 1100 0 1000
Imports 71800 73900 75000 99500 0 95000
Total Supply 102700 104800 96700 127400 0 136400
Exports 0 0 0 0 0 0
Domestic Consumption
82000 78000 76700 87000 0 97000
Ending Stocks 20700 26800 20000 40400 0 39400
Total Distribution 102700 104800 96700 127400 0 136400
Page 5 of 10
Commodities:
Production:
Domestic walnut production is expected to increase by three percent to reach 34,000 MT (in-shell basis) in MY 2017/18. Weather conditions were reported as favorable during the flowering period of March– April in the Kashmir valley, but rains in July/August may affect the quality of the crop. Typically,
India’s walnut harvest runs from late August through September, with market arrivals peaking during late October. Indian walnut production is cyclical in nature and yields can vary by as much as 20 percent, depending on weather conditions at the time of blossom and harvest. Post production estimates for MY 2016/17 are revised to 32,000 MT to reflect the latest production estimates from trade sources.
Indian walnut production is primarily confined to the hill states of Jammu and Kashmir, Himachal Pradesh, and Uttarakhand. Lack of infrastructure in producing states, long gestation periods, poor orchard management, and uneven yields keep walnut production relatively flat (yields range from 18-50 kg/tree/year with nut sizes varying from 24-32 mm). Indian walnuts are classified as hard, medium, or thin shell (kaghazi) and the average shelling rate is about 40 percent.
Consumption:
Given consistent supplies, domestic demand driven by more consumer awareness of the healthful benefits of tree nuts will push walnut consumption in MY 2017/18 up by 15 percent to 49,000 MT. Of Indian-produced walnuts, 60 to 65 percent are consumed domestically, of which more than half are consumed during the festive and winter season. Industry sources estimate that over 10 percent of walnuts are used by the food processing industry. An additional three to four percent are crushed for oil usage by businesses in the cosmetic industry (such use usually involves nuts that became rancid as a result of high oil content or lack of proper storage).
With prices holding steady, the forecast growth in consumption stems from the rising perception among middle class consumers that walnuts are healthy: they are believed to reduce cholesterol, and may have particular health benefits for diabetic patients, and more. The wider usage of attractive consumer packaging (vacuum packs) is improving the shelf life and quality of walnuts, which encourages year-round consumption of nuts as snacks. Some companies which have major processing facilities for shelling and packing walnuts in the state of Jammu and Kashmir are now expanding into facilities in the cities of Mumbai and New Delhi.
Prices:
Prices of domestic walnuts have surged by an average of 20 percent on new demand driven by more informed, health-conscious consumers. In turn, favorable domestic demand and prices reduced exports. Related to that, prices of imported walnuts ranged between INR 75,000 – 80,000 per kilogram. (Table 5).
Page 6 of 10 Trade:
Walnut exports from India have declined in response to growth in domestic demand. In MY 2016/17 exports are reported at 5,000 MT, a 34 percent decline year on year. In MY 2017/18 domestic consumption will likely keep pace with increases in domestic production, so exports are projected to remain at 5,000 MT.
Domestic demand should boost imports in MY 2016/17 by 70 percent to 19,500 MT; in 2017/18 demand should increase imports by over 25 percent to reach 26,000 MT.
More than 95 percent of Indian walnuts are exported as kernels in vacuum packs (35-40 percent light halves, 35-40 percent amber halves/light broken, and the balance as amber halves). Market sources report that the walnuts from the United States, Mexico, Chile, Turkey, China, and Ukraine compete with India on the international market (particularly markets for shelled walnuts).
Trade Policy:
The Government of India allows import of walnuts from the United States if shippers provide required declarations and meet special fumigation conditions (GAIN IN3082). Walnuts are imported without
quantitative restrictions under India’s Open General License (OGL) program. Imports are subject to an effective import duty of 30.9 percent (Table 6) except for imports originating from Afghanistan and the South Asian Association for Regional Cooperation (SAARC) countries. On August 5, 2016, the
Page 7 of 10 Production, Supply and Demand Data Statistics:
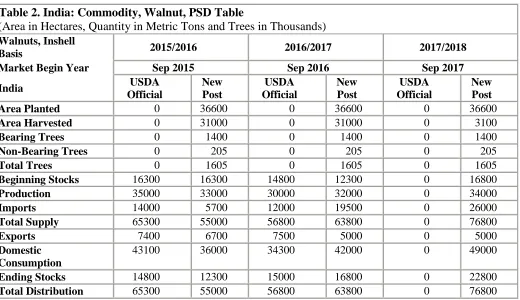
Table 2. India: Commodity, Walnut, PSD Table
(Area in Hectares, Quantity in Metric Tons and Trees in Thousands)
Walnuts, Inshell
Basis 2015/2016 2016/2017 2017/2018
Market Begin Year Sep 2015 Sep 2016 Sep 2017
India USDA
Official
New Post
USDA Official
New Post
USDA Official
New Post
Area Planted 0 36600 0 36600 0 36600
Area Harvested 0 31000 0 31000 0 3100
Bearing Trees 0 1400 0 1400 0 1400
Non-Bearing Trees 0 205 0 205 0 205
Total Trees 0 1605 0 1605 0 1605
Beginning Stocks 16300 16300 14800 12300 0 16800
Production 35000 33000 30000 32000 0 34000
Imports 14000 5700 12000 19500 0 26000
Total Supply 65300 55000 56800 63800 0 76800
Exports 7400 6700 7500 5000 0 5000
Domestic Consumption
43100 36000 34300 42000 0 49000
Ending Stocks 14800 12300 15000 16800 0 22800
Total Distribution 65300 55000 56800 63800 0 76800
Page 8 of 10 OTHER STATISTICAL TABLES
Table 3.1 India: Commodity, Almond (Shelled), Prices Table Country India
Commodity Almonds, Shelled Basis
Prices in Rupees Per uom 100 Kg
Year 2016 2017 % Change
Jan 50000 58000 14
Feb 50000 58500 15
Mar 50000 58500 15
Apr 50000 58500 15
May 52500 60000 13
Jun 55000 61000 6
Jul 55000 67000 8
Aug 60000 67500 2
Sep 59000 67500 12
Oct 59000 13
Nov 57000
Dec 58000
Exchange Rate INR 64.19 Local Currency/US $ Date of Quote 9/14/2015 MM/DD/YYYY
Table 3.2 India: Commodity, Almond (In-Shelled), Prices Table Country India
Commodity Almonds, In-Shelled Basis
Prices in Rupees Per uom 100 Kg
Year 2016 2017 % Change
Jan 50000 41000 -22
Feb 50000 41500 -20
Mar 50000 41500 -20
Apr 50000 41500 -20
May 52500 42500 -24
Jun 55000 44000 -25
Jul 55000 46000 -20
Aug 60000 48000 -25
Sep 45000 48000 6
Oct 41500
Nov 40000
Dec 41000
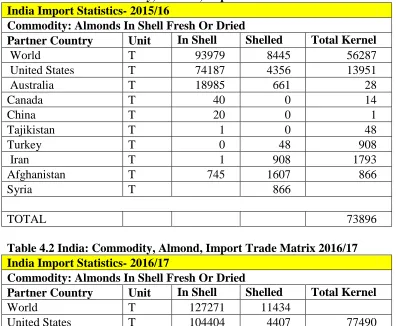
Page 9 of 10 Table 4.1 India: Commodity, Almond, Import Trade Matrix 2015/16
India Import Statistics- 2015/16
Commodity: Almonds In Shell Fresh Or Dried
Partner Country Unit In Shell Shelled Total Kernel
World T 93979 8445 56287
United States T 74187 4356 13951
Australia T 18985 661 28
Canada T 40 0 14
China T 20 0 1
Tajikistan T 1 0 48
Turkey T 0 48 908
Iran T 1 908 1793
Afghanistan T 745 1607 866
Syria T 866
TOTAL 73896
Table 4.2 India: Commodity, Almond, Import Trade Matrix 2016/17 India Import Statistics- 2016/17
Commodity: Almonds In Shell Fresh Or Dried
Partner Country Unit In Shell Shelled Total Kernel
World T 127271 11434
United States T 104404 4407 77490
Australia T 21546 1398 16480
Uzbekistan T 6 4
Hong Kong T 61 43
Iran T 1326 1326
Afghanistan T 758 2486 2676
Syria T 1680 1680
TOTAL 99698
Source: Global Trade Atlas
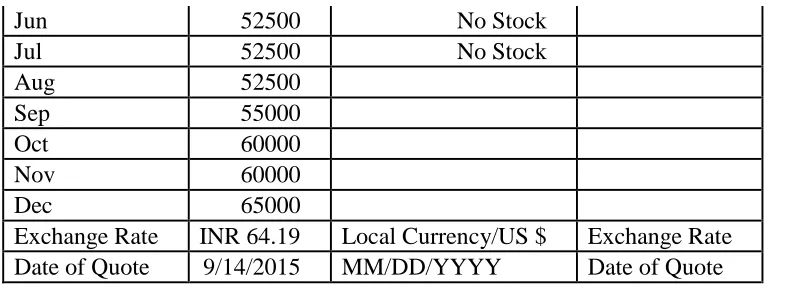
Table 5. India: Commodity, Domestic Produce Walnut, Price Table Country India
Commodity Walnuts, In shell Basis
Prices in Rupees Per uom 100 Kg
Year 2015 2016 % Change
Jan 42500 65000 35
Feb 52500 65000 19
Mar 55000 65000 15
Apr 55000 65000 15
Page 10 of 10
Exchange Rate INR 64.19 Local Currency/US $ Exchange Rate Date of Quote 9/14/2015 MM/DD/YYYY Date of Quote Source: Trade and Industry Sources
Table 6. India: Almond and Walnut Tariffs
Comm
* For almonds, which are assessed basic duty on a per kilo basis, the base cost used for 1 kilo is the average CIF Mumbai price of one kilo of in shell or shelled almonds for June 2017.
Cost: Tentative for calculation purpose
Cost A: Cost X Applicable Duty
Cost B: Cost A X Education Cess 2%
Cost C: Cost A X Education Cess 1%
Cost D: (Cost + Cost A+ Cost B + Cost C)* GST % Total Duty Cost: Cost A+ Cost B + Cost C + Cost D
Notes on Tariff:
/1: OGL (Open General License) – no quantitative restrictions.
/2: Under the Indo Afghan Preferential Trade Agreement, a tariff concession of 50 percent is applied on the basic import duty for these goods if imported from Afghanistan.
/3: Almonds in-shell are exempted from the education cess.