THIS REPORT CONTAINS ASSESSMENTS OF COMMODITY AND TRADE ISSUES MADE BY USDA STAFF AND NOT NECESSARILY STATEMENTS OF OFFICIAL U.S. GOVERNMENT POLICY
The United States is the most important supplier of almonds to Chile. The Chilean confectionary industry is the largest user of U.S. almonds as an ingredient for chocolate, with imports expected to reach 3,100 MT or 3.3 percent (%) increase over MY2016/17. Chile’s walnuts planted area is projected to keep increasing at an 8 % annual average growth rate for the next 10 years. MY2017/18 is expected to have a good harvest of walnuts. As a result, exports are expected to increase by 7.1 % in volume totaling 105,000 MT (In-shell).
Sergio Gonzalez, Agricultural Specialist Marcela Rondon, Agricultural Attaché
U.S. Almond exports to Chile expected to reach nearly 3,100 MT
in MY2017/18
Tree Nuts Annual
Chile
CI1715
9/15/2017
Commodities:
Production:
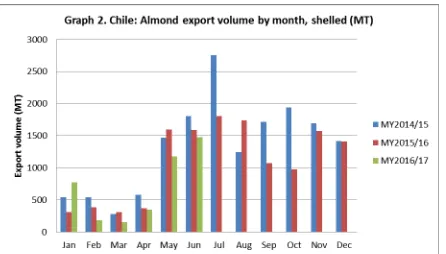
Chile’s almond planted area grew up to reach 8,457 hectares (ha) in MY2009/10, but started to decrease slightly down to 7,932 ha in MY2015/16 (see Graph 1). Almond planted area is concentrated in
Metropolitana and O’Higgins regions which hold 42% and 29%, respectively (see Table 1).
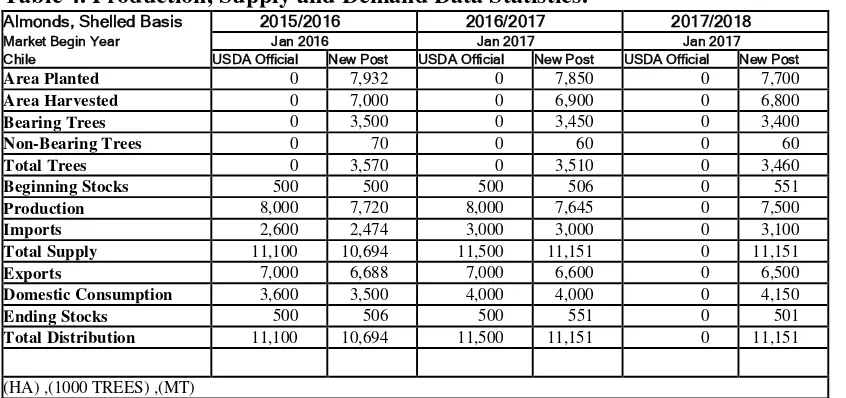
In MY2017/18 almond planted area is projected to decrease slightly to 5,800 ha, adjusting to current market conditions, which favor the plantation of alternative crops that are more profitable such as walnuts or cherries. Post expects production of almonds to decrease to 7,500 MT or 1.9%.
The most efficient and productive Chilean almond growers are the ones who remain and keep producing almonds for exports.
Source: ODEPA/CIREN
Table 1. Chile: almonds planted area MY2015/16 (ha)
Chilean confectionary industry uses almonds as an ingredient for snacks, chocolates, and sweets. The confectionary industry requires uniform flat and rounded almonds, which perform better in the
production of snacks, chocolates, and sweets. These unique characteristics are found in U.S. almond varieties, which explain why Chilean confectionary industry prefers to import from the U.S. In
MY2015/16, the processing industry, in general, faced several problems because of adjustments that had to be made to comply with the Nutritional Labeling Law which was implemented June 2016 (see Gain Report). Initially industry had to quickly sell the stocks that did not comply with the Nutrition Labeling Law, and afterwards some products had to be reformulated or labeled. According to Post sources, the confectionary industry has already made the adjustments and demand for U.S. almonds recovered in MY2016/17.
Trade:
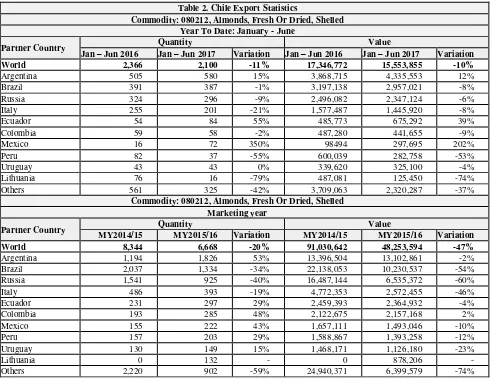
Chilean almond exports in MY2016/17 decreased by 11% in volume and 10% in value (Jan-Jun) over MY2015/16 (see Table 2).
Argentina is the top market for Chilean almond exports, followed by Brazil, and Russia. From the top ten markets, only exports to Argentina, Ecuador, and Mexico have grown in MY2016/17, and these increases have not been enough to compensate the decrease in exports to the other markets.
On the other hand, almond imports in MY2016/17 have increased by 57% over MY2015/16 (Jan-Jun).
The U.S. is the top supplier of almonds, with 99% of market share (see Table 3).
Table 2. Chile Export Statistics
Commodity: 080212, Almonds, Fresh Or Dried, Shelled Year To Date: January - June
Partner Country Quantity Value
Jan – Jun 2016 Jan – Jun 2017 Variation Jan – Jun 2016 Jan – Jun 2017 Variation
World 2,366 2,100 -11% 17,346,772 15,553,855 -10%
Argentina 505 580 15% 3,868,715 4,335,553 12%
Brazil 391 387 -1% 3,197,138 2,957,021 -8%
Russia 324 296 -9% 2,496,082 2,347,124 -6%
Italy 255 201 -21% 1,577,487 1,445,920 -8%
Ecuador 54 84 55% 485,773 675,292 39%
Colombia 59 58 -2% 487,280 441,655 -9%
Mexico 16 72 350% 98494 297,695 202%
Peru 82 37 -55% 600,039 282,758 -53%
Uruguay 43 43 0% 339,620 325,100 -4%
Lithuania 76 16 -79% 487,081 125,450 -74%
Others 561 325 -42% 3,709,063 2,320,287 -37%
Commodity: 080212, Almonds, Fresh Or Dried, Shelled Marketing year
Partner Country Quantity Value
MY2014/15 MY2015/16 Variation MY2014/15 MY2015/16 Variation
World 8,344 6,668 -20% 91,030,642 48,253,594 -47%
Argentina 1,194 1,826 53% 13,396,504 13,102,861 -2%
Brazil 2,037 1,334 -34% 22,138,053 10,230,537 -54%
Russia 1,541 925 -40% 16,487,144 6,535,372 -60%
Italy 486 393 -19% 4,772,353 2,572,455 -46%
Ecuador 231 297 29% 2,459,393 2,364,932 -4%
Colombia 193 285 48% 2,122,675 2,157,168 2%
Mexico 155 222 43% 1,657,111 1,493,046 -10%
Peru 157 203 29% 1,588,867 1,393,258 -12%
Uruguay 130 149 15% 1,468,171 1,126,180 -23%
Lithuania 0 132 - 0 878,206
-Others 2,220 902 -59% 24,940,371 6,399,579 -74%
Source of Data: Chile Customs - Servicio Nacional de Aduana Note: In-Shell to shelled conversion rate = 0.6
Table 3. Chile Import Statistics
Commodity: 080212, Almonds, Fresh Or Dried, Shelled Year to date (January - June)
Partner Country Quantity Value
Jan – Jun 2016 Jan – Jun 2017 Variation Jan – Jun 2016 Jan – Jun 2017 Variation
World 805 1,264 57% 7,096,304 7,616,489 7%
United States 805 1,252 56% 7,094,437 7,531,593 6%
Spain 0 10 - 0 72,338
-Germany 0 0 - 461 474
-Others 0 2 - 1,406 12,084 759%
Commodity: 080212, Almonds, Fresh Or Dried, Shelled MY2014/15 - MY2015/16
Partner Country Quantity Value
MY2014/15 MY2015/16 Variation MY2014/15 MY2015/16 Variation
World 2,700 2,474 -8% 26,436,621 17,882,415 -32%
United States 2,699 2,451 -9% 26,426,107 17,703,434 -33%
Spain 0 17 - 1,112 119,161 10616%
Germany 0 6 - 0 57,215
-Others 1 0 -100% 9,402 2,605 -72%
Source of Data: Chile Customs - Servicio Nacional de Aduana
Note: In-Shell to shelled conversion rate = 0.6
Table 4. Production, Supply and Demand Data Statistics:
Almonds, Shelled Basis 2015/2016 2016/2017 2017/2018
Market Begin Year Jan 2016 Jan 2017 Jan 2017
Chile USDA Official New Post USDA Official New Post USDA Official New Post
Area Planted 0 7,932 0 7,850 0 7,700
Area Harvested 0 7,000 0 6,900 0 6,800
Bearing Trees 0 3,500 0 3,450 0 3,400
Non-Bearing Trees 0 70 0 60 0 60
Total Trees 0 3,570 0 3,510 0 3,460
Beginning Stocks 500 500 500 506 0 551
Production 8,000 7,720 8,000 7,645 0 7,500
Imports 2,600 2,474 3,000 3,000 0 3,100
Total Supply 11,100 10,694 11,500 11,151 0 11,151
Exports 7,000 6,688 7,000 6,600 0 6,500
Domestic Consumption 3,600 3,500 4,000 4,000 0 4,150
Ending Stocks 500 506 500 551 0 501
Total Distribution 11,100 10,694 11,500 11,151 0 11,151
(HA) ,(1000 TREES) ,(MT)
Note: In-Shell to shelled conversion rate = 0.6 Source: post estimations
Walnut planted area has increased at a 10% average annual growth rate since 2003 (see Graph 3) and is projected to keep increasing at an 8% annual average growth rate for the next 10 years. Post sources indicate that profits obtained from walnut exports are higher than other species, thus producers are investing more resources in the production of walnuts and others are moving away from less profitable crops (apples, table grapes, pears, peaches, and nectarines) in the last years.
The production potential for Chilean walnuts has not been reached yet since it takes four to five years to produce the crop, however, it is expected to reach its potential in 10 years. There are a number of factors that influence production of walnuts such as inputs, varieties and orchard management, but in Chile, climatic conditions are the most important factors that have the greatest influence on the actual volume of the harvest. The climatic conditions in the months before the harvest are critical, and they can affect negatively or favor the overall results greatly. Harvest is concentrated in the months of March and April, which means that during the winter, in the months of June and September of the previous calendar year, there has to be enough number of chill hours (hours under 45 degrees Fahrenheit) and rainfall accumulation; and during the spring months, September through December, there has to be sufficient number of growing degree days (measure of heat accumulation for plant development). Finally, during the summer months, December through March, rainfall also could damage the harvest.
MY2015/16 was characterized by unexpected rainfall that took place in mid-April, reducing the volume of the harvest and the quality of the walnuts exported to the world.
MY2016/17 presented better climatic conditions for walnut production, with high temperatures during the summer that allowed for rapid development of early varieties favoring the quality of the walnuts (light color and proper conditions for drying and processing), and with absence of rainfall during the harvest months. Production in MY2016/17 is expected to reach 95,000 MT (In-shell).
MY2017/18 is expected to have a good harvest of walnuts. The winter has presented enough amounts of chill hours and rainfall which will favor blooming and water availability for irrigation. As new orchards come into production, walnut production is expected to increase by 7.5% and reach 107,500 MT in MY2017/18.
Table 5. Chile: Walnut planted area MY2015/16 (ha)
The majority of walnut production is destined to the export market and around 5% is used for domestic consumption. Walnuts are consumed in-shell or shelled and the food processing industry uses walnuts to produce oil, beverages, dairy products, bakery products, snacks, cereals and cosmetic products.
Trade:
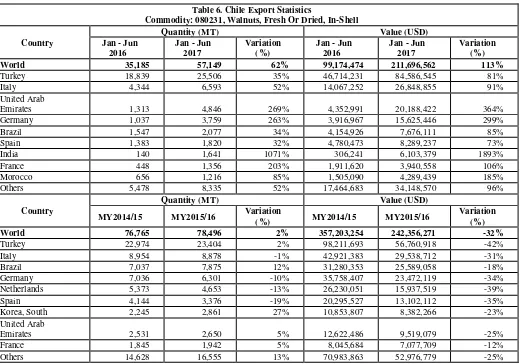
In MY2015/16 walnut exports reached 78,496 MT, which represented a 2% increase over the previous MY (see Table 6). However, value decreased 32%, as a result of lower quality walnuts that faced rainfall during harvest season.
In MY2016/17 (Jan-Jun) exports increased by 62% in volume and 113% in value over MY2015/16. The top market destination for Chilean walnuts is Turkey which has grown by 35% in MY2016/17 and has a 45% market share. Italy is the second top market for Chilean walnuts and has grown 52% compared to the previous year, while United Arab Emirates, the third top market, has grown by 269%.
The fastest growing market for Chilean walnuts is India, which allows phosphine fumigation instead of methyl bromide since August 2016.
Table 6. Chile Export Statistics
Commodity: 080231, Walnuts, Fresh Or Dried, In-Shell
Country
World 35,185 57,149 62% 99,174,474 211,696,562 113%
Turkey 18,839 25,506 35% 46,714,231 84,586,545 81%
Italy 4,344 6,593 52% 14,067,252 26,848,855 91%
United Arab
Emirates 1,313 4,846 269% 4,352,991 20,188,422 364%
Germany 1,037 3,759 263% 3,916,967 15,625,446 299%
Brazil 1,547 2,077 34% 4,154,926 7,676,111 85%
Spain 1,383 1,820 32% 4,780,473 8,289,237 73%
India 140 1,641 1071% 306,241 6,103,379 1893%
France 448 1,356 203% 1,911,620 3,940,558 106%
Morocco 656 1,216 85% 1,505,090 4,289,439 185%
Others 5,478 8,335 52% 17,464,683 34,148,570 96%
Country
World 76,765 78,496 2% 357,203,254 242,356,271 -32%
Turkey 22,974 23,404 2% 98,211,693 56,760,918 -42%
Italy 8,954 8,878 -1% 42,921,383 29,538,712 -31%
Brazil 7,037 7,875 12% 31,280,353 25,589,058 -18%
Germany 7,036 6,301 -10% 35,758,407 23,472,119 -34%
Netherlands 5,373 4,653 -13% 26,230,051 15,937,519 -39%
Spain 4,144 3,376 -19% 20,295,527 13,102,112 -35%
Korea, South 2,245 2,861 27% 10,853,807 8,382,266 -23%
United Arab
Emirates 2,531 2,650 5% 12,622,486 9,519,079 -25%
France 1,845 1,942 5% 8,045,684 7,077,709 -12%
Others 14,628 16,555 13% 70,983,863 52,976,779 -25%
Source of Data: Chile Customs - Servicio Nacional de Aduana Note: Shelled to in-shell conversion rate = 2.34
Source of Data: Chile Customs - Servicio Nacional de Aduana Note: Shelled to in-shell conversion rate = 2.34
Policy:
Table7. Production, Supply and Demand Data Statistics:
Walnuts, In-shell Basis 2015/2016 2016/2017 2017/2018
Market Begin Year Jan 2016 Jan 2017 Jan 2018 Chile USDA Official New Post USDA Official New Post USDA Official New Post
Area Planted 0 36,664 0 39,360 0 42,000
Area Harvested 0 25,664 0 27,552 0 29,400
Bearing Trees 0 4,600 0 5,000 0 5,385
Non-Bearing Trees 0 1,840 0 1,900 0 2,046
Total Trees 0 6,440 0 6,900 0 7,431
Beginning Stocks 593 593 443 500 0 400
Production 80,000 80,500 100,000 100,000 0 107,500
Imports 1,000 361 1,000 365 0 370
Total Supply 81,593 81,454 101,443 100,865 0 108,270
Exports 79,000 78,496 90,000 98,000 0 105,000
Domestic Consumption 2,150 2,458 11,250 2,465 0 2,770
Ending Stocks 443 500 193 400 0 500
Total Distribution 81,593 81,454 101,443 100,865 0 108,270
(HA) ,(1000 TREES) ,(MT)
Source: post estimations
Note: Shelled to In-shell conversion rate = 2.34