6
Chapter 2
Literature Review
2.1Previous Research
Recommender systems have changed the way of people in shop online (Millner et al, 2003). The result of that study conclude that recommender system have potential to provide value to their users. Recommender systems are providing value to users in many different content and commerce environment (Millner et al, 2004).
In the previous research about extended weighted tree similarity algorithm (Sarno et al, 2003), it’s concluded that the implementation of it makes the system select more preferred agent (buyer or seller agent) among agents having the same similarity value.
Application of Weighted Tree Similarity for E-Business environment on another previous research concluded that this algorithm can be parameterized by different functions to adjust the similarity of the sub trees. The algorithm can also be applied in other environments wherein weighted trees are used, and implemented in many programming languages (Bhavsar et al, 2005).
The application of Extended Weighted Tree Similarity in Job Searching had not too wide result like OR method and also not too strict result as AND method (Yulianti, 2010). This research suggested that the application will be better if it became on line application.
2.2 Web Crawling
Web crawling, or Web Spider or Web Robots is an autonomous user agent that retrieve page from the web (Senellart, 2009). To crawl the web, the user agent will follow several step, they are:
7
2. Retrieve and process the corresponding page 3. Discover new URLs
4. Repeat on each found URL
As can be seen above, the key steps are step 1, 2 and 3. Step 4 just repeats the previous steps, especially step 2 and 3. To execute the fourth step, there are three Graph Browser methods that can be used by the user agents (Senellart, 2009).
1. Depth First
The User Agent will process the first found URL before search other URLs on the page
2. Breath First
The User agent will search all URLs on the page before process the first found URLs
3. Combination of Depth and Breath First
Bread first with limited depth on each discovered website
This Research will use the third method, Combination of Deep and Breath First to collect mobile phone’s information from the website to be compared with mobile phone’s criteria from the user of the recommender system.
2.3 Regular Expression
Chapter 2.2 has explained about four steps of web crawling. It also explained that step four just repeat steps 2 and 3. In step 2, the user agent will retrieve and process the web page to discover new URLs (step 3). Some sources of new URLs that can be found on HTML page (Senellart, 2009):
8
<iframe src = “…”/> 4. JavaScript link
Example: window.open(“…”) 5. Referrer URLs
6. Sitemaps 7. Etc
This research need to find source 1 and 2, hyperlink and media, especially image to collect data for the recommender system. And to find out the specific resource that mentioned above on HTML page, the system need to apply regular expression.
Regular expression (Goyvaerts and Levithan, 2009) is specific kind of text pattern that can be used with many modern application and programming language. Regular expression is used to search, edit and manipulate text (Vogel, 2007).
As a note, the recommender system in this research will be build use Java programming language, so regular expression that is discussed here just regular expression in Java.
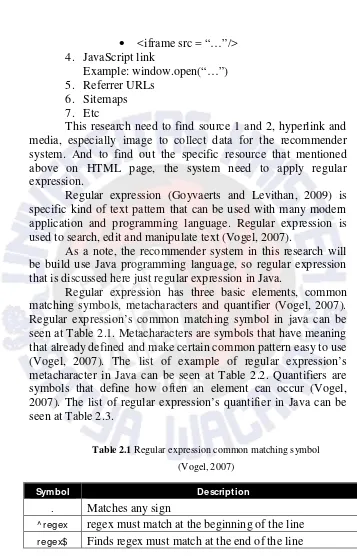
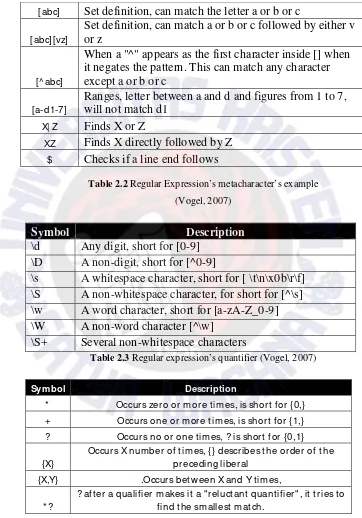
Regular expression has three basic elements, common matching symbols, metacharacters and quantifier (Vogel, 2007). Regular expression’s common matching symbol in java can be seen at Table 2.1. Metacharacters are symbols that have meaning that already defined and make certain common pattern easy to use (Vogel, 2007). The list of example of regular expression’s metacharacter in Java can be seen at Table 2.2. Quantifiers are symbols that define how often an element can occur (Vogel, 2007). The list of regular expression’s quantifier in Java can be seen at Table 2.3.
Table 2.1 Regular expression common matching symbol (Vogel, 2007)
Symbol Description
. Matches any sign
9
Table 2.2 Regular Expression’s metacharacter’s example (Vogel, 2007)
Symbol Description
\d Any digit, short for [0-9] \D A non-digit, short for [^0-9]
\s A whitespace character, short for [ \t\n\x0b\r\f] \S A non-whitespace character, for short for [^\s] \w A word character, short for [a-zA-Z_0-9] \W A non-word character [^\w]
\S+ Several non-whitespace characters
Table 2.3 Regular expression’s quantifier (Vogel, 2007)
Symbol Description
* Occurs zero or more times, is short for {0,} + Occurs one or more times, is short for {1,} ? Occurs no or one times, ? is short for {0,1}
{X}
Occurs X number of times, {} describes the order of the preceding liberal
{X,Y} .Occurs betw een X and Y times,
* ?
? aft er a qualifier makes it a "reluctant quantifier", it tries to find the smallest match.
[abc] Set definition, can match the letter a or b or c
[abc][vz]
Set definition, can match a or b or c followed by either v or z
[^ abc]
When a "^" appears as the first character inside [] when it negates the pattern. This can match any character except a or b or c
[a-d1-7]
Ranges, letter between a and d and figures from 1 to 7, will not match d1
X| Z Finds X or Z
10
2.5 Extended Weighted Tree Similarity
Weighted Tree Similarity is a tree similarity for match-making of agents (Bhavsar et al, 2005). The agents are Buyer agent, that deal with information that the buyer want to buy and Seller agent, that deal with information that the seller want to sell (Yang et al, 2000). The tree that is used in this research is XML tree base on weighted extension of Object-Oriented RuleML (Boley, 2003). The agents are represented by the XML tree that consists of Node-Labeled, Arc-Labeled, and Arc-Weighted (Bhavsar et al, 2005). Node-Labeled is data structure for information representation in various areas. Arc-Labeled is representation of attributes of product. Arc-Weighted is representation of the relative importance of the product’s attributes. Criteria, specification and detail are Node-Labeled .Label is Arc-Labeled and weight is Arc-Weighted. As mentioned in chapter 1, the criteria of the mobile phone that will be counted in this research are price, vendor, and feature.
Formula 2.1 is show the how to decide weight of child of XML tree (Sarno, 2003). The formula to count similarity using Extended Weighted Tree Similarity is shown in Formula 2.2 (Sarno, 2003):
Formula 2.1 Formula to decide weight in Extended Weighted Tree Similarity
Explanation: W : Weighted
N : count of the item Freq : Frequency
Formula 2.2 Formula to count similarity using Extended Weighted Tree Similarity
11 Explanation:
S : Similarity
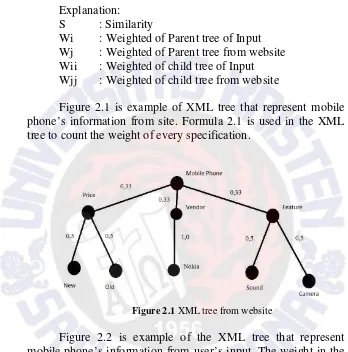
Wi : Weighted of Parent tree of Input Wj : Weighted of Parent tree from website Wii : Weighted of child tree of Input Wjj : Weighted of child tree from website
Figure 2.1 is example of XML tree that represent mobile phone’s information from site. Formula 2.1 is used in the XML tree to count the weight of every specification.
Figure 2.1 XML tree from website
12
Figure 2.2 XML tree from user’s input
Formula 2.2 will be used by the recommender system to count the similarity. The following lines is shown the example how the formula count similarity between XML trees in figure 2.1 and figure 2.2
S = ( (0.33*0.2) * ( ( 0.5 * 0.4 ) + ( 0.5 * 0.6 ) ) * ( ( 0.33 * 0.7 ) * ( 1.0 * 0.8 ) ) + ( ( 0.33 * 0.1) * ( ( 0.5 * 0.7 ) + ( 0.5 * 0.3 ) )
S = ( 0.66 * ( 0.2 + 0.3 ) ) + ( 0.231 * 0.8 ) + ( 0.033 * ( 0.35 + 0.15 ) )
S = 0.33 + 0.1848 + 0.0165 S = 0.5313
As can be seen in the previous lines, the similarity between XML trees in figure 2.1 and figure 2.2 is 0, 5313. The implementation of the formula in the code will be discussed in chapter 4.
2.2 Recommender System
Recommender system is system that has ability to tailor its output to a particular user implies that it must be able to infer what the user requires based on previous or current interaction with user or other similar user (Mobasher, 2007).
13
From architectural point of view, recommender system has two different generation approaches that classify it to 2 main categories (Mobasher, 2007):
1. Memory based
Memory based systems simply memorize all the data and generalize from it at the time of generating recommendations. They are therefore more susceptible to scalability issues.
2. Model based
Model based approached is that perform the computationally expensive learning phase offline. In other hand, from algorithm point of view, recommender system is classified to 2 different categories, they are (Mobasher, 2007):
1. Knowledge based
Knowledge based recommenders rely either on explicit domain knowledge about the items or knowledge about the users (Burke, 2000).
2. Content Filtering
In Content-based filtering systems, a user profile captures the content descriptions of items in which that user has previously expressed interest
3. Collaborative Filtering
14
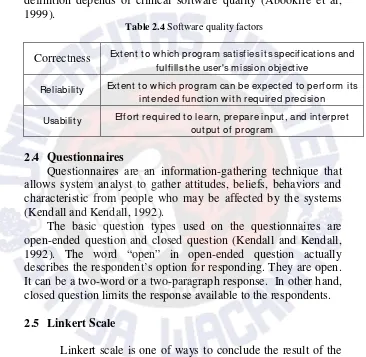
specification itself. On their research, this system is applied in recommender system for alternative therapies or diagnostics method.
Table 2.1 is showed software quality factors and their definition depends of clinical software quality (Abookire et al, 1999).
Table 2.4 Software quality factors
Correctness Extent to w hich program sat isfies its specifications and fulfills the user's mission objective
Reliability Extent to w hich program can be expected to perform its intended function w ith required precision
Usability Effort required to learn, prepare input, and interpret output of program
2.4 Questionnaires
Questionnaires are an information-gathering technique that allows system analyst to gather attitudes, beliefs, behaviors and characteristic from people who may be affected by the systems (Kendall and Kendall, 1992).
The basic question types used on the questionnaires are open-ended question and closed question (Kendall and Kendall, 1992). The word “open” in open-ended question actually describes the respondent’s option for responding. They are open. It can be a two-word or a two-paragraph response. In other hand, closed question limits the response available to the respondents.
2.5 Linkert Scale
15 1. Defining the focus
First step to use Linkert scale is defining what the measurement that is tried to search in the research. 2. Generating the items
After defining the measurement, the next step is creating scale of Disagree – Agree response. It is can be 1 to 5, 1 to 7 and etc.
3. Rating the items
The next step is rating the items on the Disagree and Agree response scale. This is example of the rating in 1 to 5 scale:
1 = strongly unfavorable to the concept 2 = somewhat unfavorable to concept 3 = undecided
4 = somewhat favorable to the concept 5 = strongly favorable to the concept 4. Selecting the items
The next step is to compute the intercorrelation between of item that is already chosen by the users or respondents based on the rating of the judges.
5. Administering the items