Mémoire de Master
Présenté pour l’obtention du diplôme de
Master de sciences, mention : Environnement, Spécialité: EBE (Ecologie, Biodiversité, Evolution),
Année 2009-2010
Simulation & Gaming to promote communication
between researchers, managers and blue swimming crab fishery communities
in Kung Krabaen Bay, Chanthaburi Province, Thailand.
Implementation of a participatory process using the Companion Modelling approach.
Présenté par Elsa LETEURTRE le 28 Septembre 2010
Structure d’accueil : L’unité de recherche GREEN, CIRAD, Montpellier, France Sous la direction de : Christophe LE PAGE
En collaboration avec: the Tropical Ecology Laboratory, Chulalongkorn University, Bangkok, Thailand
Jury:
ACKNOWLEDGEMENTS
My first thought is for Miss Chutapa Kunsook with gratitude and affection for her involvement in our collaboration. I wish that this project was as interesting for her as it was for me.
This work is also the reflection of my exchanges with my advisor Dr. Christophe Le Page. I would like to thank him to have opened me the door to informatics dialogue and for his useful guidance which lets me free in my project without gets lost on the way.
I express my sincere gratitude to Dr. Nantana Gajaseni and Dr. Guy Trebuil who helped me to set up this project and followed its progress with judicious advices.
I am thankful to all the Tropical Ecology laboratory members of Chulalongkorn University for their welcoming in the team. Especially, I friendly greet Mr. Pongchai Dumrongrojwatthana and Mr. Kobchai Worrapimphong for their help and our pleasant exchanges which marked my daily life in Bangkok.
I would like to thank the CIRAD GREEN unit team to have trust me in this project. Our discussions, and those with ComMod association’ members, have guided my analysis and I wish to continue to follow and to contribute to the development of the ComMod approach.
All my sympathy goes to local actors I have met in this experience: they were the heart of this project. They have stimulated my reflections and I hope it was reciprocal.
My acknowledgement also falls to Kung Krabaen Bay (KKB) Royal Development Study Centre and to the National Research Council of Thailand (NRCT) that made possible this project implementation.
CONTENTS
Page ACKNOWLEDGEMENTS………... CONTENTS………... PREFACE. INSTITUTIONAL CONTEXT………... CHAPTER 1. INTRODUCTION: PROJECT PRESENTATION………....
1.1. Project justification………... 1.2. Project objectives………. 1.3. Kung Krabaen Bay’ blue swimming crab fishery……… 1.4. The methodological approach……….. 1.5. Project study site delimitation……….. CHAPTER 2. DESIGN OF THE ‘KKB’ AGENT BASED MODEL………...
2.1. Description of the conceptual model by ODD protocol………... 2.2. Implementation under Cormas software………... CHAPTER 3. DEVELOPMENT OF THE ‘IdeasFishery’ ROLE PLAYING GAME 3.1. Game rules’ design……… 3.2. Construction of game supports………. 3.3. Game tests………. CHAPTER 4. GAME ORGANISATION WITH LOCAL STAKEHOLDERS…….
4.1. Choice of participants and determination of their gaming profiles…………. 4.2. Workshop schedule and location………. 4.3. Workshop management and monitoring……….. CHAPTER 5. WORKSHOP ANALYSIS:
SEQUENCES OF EVENTS & GAME RESULTS……… 5.1. Participants’ used of game indicators and choice of results’ presentation….. 5.2. First session description………... 5.3. Second session description………... 5.4. Logistic perturbations………... CHAPTER 6. WORKSHOP ANALYSIS:
“Tell me and I forget. Teach me and I remember. Involve me and I learn.” Benjamin Franklin
PREFACE. INSTITUTIONAL CONTEXT
This project was based on a collaboration between the GREEN research unit of CIRAD center, Montpellier, France, and the Tropical Ecology Laboratory of Chulalongkorn University, Bangkok, Thailand. It followed a previous collaboration between these two institutes, the COMMOD / CU project (2004-2009)1, that already allowed the implementation of several Companion Modelling processes in Thailand. These two institutes as well as the additional partners that approved and followed the project are presented below.
GREEN research unit1 of CIRAD research center, Montpellier, France.
CIRAD (Centre de coopération internationale en recherche
agronomique pour le développement) is a French research centre working for
international development. Most of its research is conducted in partnership with the all
range of developing countries. It is a public industrial and commercial enterprise (EPIC)
under the joint authority of the Ministry of Higher Education and Research and the
Ministry of Foreign and European Affairs.
The GREEN research unit (Gestion des ressources renouvelables et environnement) belongs to the CIRAD Environment and Societies (ES) department. Its aim is to provide knowledge, methods and tools based on the modelling of complex systems to support collective processes for renewable resource management and to help stakeholders to improve their capacity to manage their eco-social system. In this objective, they participate to the research and development of a participatory approach calls ‘Companion Modelling’ (ComMod) which is now represented by an association of the same name (see below).
1
Tropical Ecology Laboratory,
Chulalongkorn University2, Bangkok,Thailand ‘Chulalongkorn University (CU) is Thailand’s first institution of higher education founded nearly a century ago. As a national intellectual center, the university produces the finest quality graduates with a high level of knowledge and skills in the arts and sciences that they can use to contribute to society.’ (Professor Pirom Kamolratanakul, MD, President, March, 2009)2.
The Tropical Ecology Laboratory belongs to Department of Biology of the Faculty of science. Its team offers courses on Man and environment; Principles of ecology for economists; and Society, business & environment. Research projects adopt a system modeling approach to forest or coastal environment or deal with the valuation of ecological services.
Master EBE3, Paris, France.
The master EBE (Ecologie, Biodiversité, Evolution) is a French postgraduate course in ecology discipline. It is taught in partnership with five French universities: UPS11, UPMC, AgroParisTech, ENS and MNHN. It aims to educate future researchers and practitioners who could understand and solve ecological issues. Their background will be a good understanding of the different components of socio-ecological systems, of their evolutions and their interactions.
National Research Council of Thailand (NRCT)4, Bangkok. Thailand operates a permit system for foreign researchers. This permit is designed to promote research activities and enhance collaboration between Thai and foreign researchers by given them an official status and by facilitated the further used of the research results. This project was approved and followed by the Foreign Researcher Management Section (project id 2488).
2
http://www.chula.ac.th/cuen 3
http://www.ese.u-psud.fr/masterEBE 4
Companion Modelling (ComMod) association5, Paris, France.
Since 2010, this association under the French law status of 1901 brings together researchers and practitioners involve in the development of the Companion Modelling approach. This approach belongs to the participatory processes in the field of renewable resource management. It aims to tackle issues regarding decision processes, common property, co-ordination among actors, etc. Its originality come from: the repeated involvement of local stakeholders in its implementation; the use of modeling tools to represent the issues at stake (particularly Agent-Based Models and Role-Playing Games); and from the importance gives to collective debriefings of these models outputs (Etienne, 2010). Working with models and games has been a mean to cross disciplines boundaries and to recognize the complex nature of the systems under study. This approach should be understood as an ethic posture, rather than a modelling handbook, and it has been formalized in a charter (available in Barreteau, 2003).
Kung Krabaen Bay Royal Development Study Center6, Chanthaburi province, Thailand.
This management institute is a centre of studying, researching and experimenting on several topics that fit the environment and lifestyle of the local residence. Its started in 1981 from His Majesty the King project. Its five objectives are: (1) To study the structure of coastal resource management. (2) To become the training center and pass on the study outcome to the private and public sectors. (3) To enhance living conditions and occupations of the residence, especially for the poor residence. (4) To improve fishery and coastal aquaculture to increase the production volume of the country. (5) To preserve the environment to sustain the special characteristics of the area (Satumantpan, 2005).
[Project contact: Elsa LETEURTRE. Tel (France): +336 84 38 39 07. Mail: [email protected].]
5
http://www.commod.org 6
CHAPTER 1. INTRODUCTION: PROJECT PRESENTATION
1.1. Project justification.
In the actual paradigm of sustainable development, the linkage between natural resources and their use by the society is re-questioned. Nature is not seen anymore as objects’ collections whose definitions are stated by scientists, but as complex socio-ecological systems (SES) identified by the society. It has been recognized that its definition is highly variable and depends of individual representations. It leads to the existence of several ‘natures’ and both practitioners as well as researchers stress the importance to implement natural resource management collectively by incorporating views of local stakeholders. Participatory approaches have then progressively gained popularity in territory management politics.
The Companion Modeling (ComMod) approach relies on the use of simulation tools to implement a participatory process. It aims at sharing representations among stakeholders and at improving their communication network, the quality of the discussion process being judged more important that its result itself. Indeed, in referring to post-normal science, it recognizes the importance of uncertainties and stochastic events which, in addition to the complexity of human behaviours, challenges the relevance of designing predictive expert models of SES. It is the improvement of communication between stakeholders that is seen as the key to enhance SES resilience. ComMod is used to enforce local resource users’ self-organisation ability; and to strengthen their collaboration with territory managers as well as with researchers (Barreteau, 2003).
1.2. Project objectives.
The project had a twofold operational and scientific objective:
The first objective, related to development, was to collaborate with Miss Kunsook, to design and to implement a ComMod approach to promote communication between researchers, managers and BSC fishing communities in Kung Krabaen Bay.
The second objective, related to methodological aspects of participatory modeling approaches, aims to experiment and question the collaboration work between scientific experts of the domain and approach designers; its pertinence for short term project (four months and a half locally); and the local co-supervision by previous PhD students who implemented a ComMod approach themselves, providing them the opportunity to transfer their skills and advise newcomers (see further, project monitoring part 1.4).
1.3. Kung Krabaen Bay’ blue swimming crab fishery
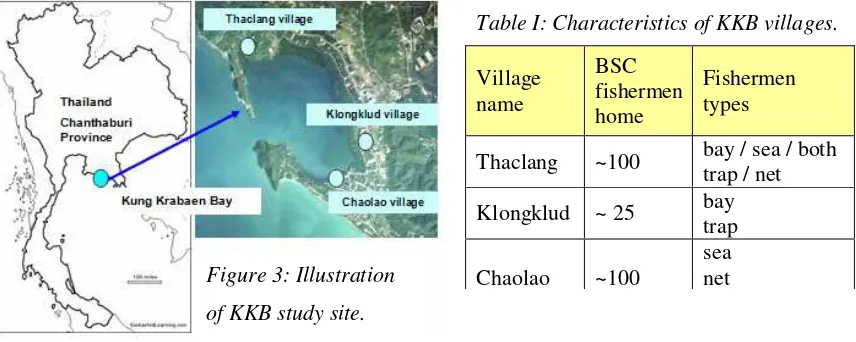
Kung Krabaen Bay (KKB) is localized on the northern part of the Gulf of Thailand, in Chanthaburi Province, at around 260 km East from Bangkok (see figure n). Since 1981, with the development of His Majesty the King project, it is an important research field for the study and the conservation of natural coastal resources. Several universities, among which Chulalongkorn, and a Royal Development Study Centre (RDSC) are involved in the area (see these institutions’ description in preface).
In this context, to improve the understanding of the KKB ecosystem and to provide insights to support management decisions, Miss Kunsook started a PhD study in 2005. Her study focused on the BSC population structure and migration patterns at KKB.
Beside the academic research, the RDSC represents the main institution to develop and coordinate management actions in the area. A weakness of Thai fishery management often recognized is the out of date state of its legal acts (the main one being the Fishery Act dated of 1947) (Nasuchon, 2009). Its main strength is its politic of decentralization started
since 1992 and favoring cooperation with local stakeholders (same author). The objective to
focus on human as central for development to achieve resources sustainability was also
recently enlightened in the Tenth National Economic and Social Development Plan
(ONESDB, 2007-2010) given by the King. The RDSC of KKB plays this role of catalyst
among the different stakeholders. Its officers organise regularly seminars to discuss
management issues with local fishermen. They also experiment local management project
For instance, a crab bank project started recently in Klongklud village with the creation of a
center to receive and conserve harvested egg-bearing BSC females until they release their
eggs (see details on crab bank systems on Suanrattanachai, 2009). However, it remained not
used and local fishermen seemed poorly concerned in conservation issues. RDSC officers
were then interested to follow our project to experience a new participatory approach aiming
at promoting better communication with the fishermen.
1.4. The methodological approach.
ComMod approach originality is the use of models as dialogue tools to represent the system stakes. This paragraph presents the project use of models, data collection, monitoring and framework.
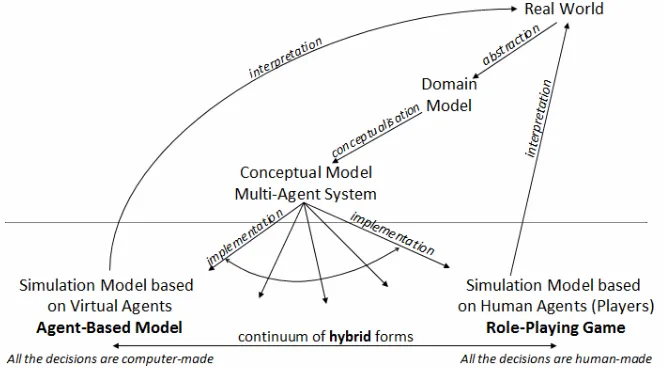
computational simulation tool seemed an adapted method to guide the conceptualization of our representation. The following modeling phases were then: to delimit our project domain, to conceptualise its representation via the construction of an ABM and to adapt this computational tool in a role playing game. These different phases and their links are summarized figure 1.
Figure 1: From reality to the implementation of simulation models based on agents (from Le Page et al., 2010).
Data collection. Data used to construct our system representation were recorded by different ways: frequent discussions with Miss Kunsook, literature review, two field trips, and several interviews of stakeholders. Interviews were carried out in two times. A first field trip aimed to introduce myself and the project to local stakeholders. Meetings were led by open discussions and carried out mainly with stakeholders known by Miss Kunsook. It was the occasion to discover the area and I had the opportunity to be initiated to BSC trap fishery. A second field trip was organised to conduct a set of prepared interviews based on qualitative open-questionnaires to understand stakeholders’ representations (see appendix 1). Stakeholders who were then interviewed were: all range of fishermen types (see point 1.5 our social delimitation); the village headmen and Miss Kunsook local facilitators in each village considered; prey shop and BSC market’ owners (eleven interviews in total). A logbook was used to record details of all meetings. Methodology of workshop sessions recording is detailed chapter 4.
audio conferences (using Skype, which allows sharing computer screens). Additionally, a local co-supervision was provided by two post-PhD students, Mr Pongchai Dumrongrojwatthana and Mr Kobchai Worrapimphong, who just finished similar projects and who could thus take over the relay of advisors.
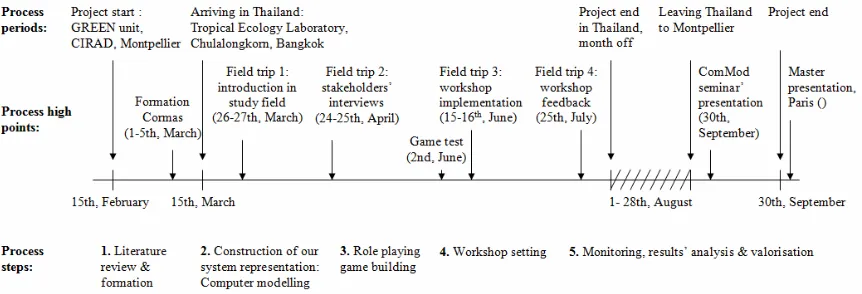
Project framework. The project framework is presented figure 2. Four months and a half were spent in Thailand, hosted by the Tropical Ecology Laboratory of Chulalongkorn University in Bangkok (see detailed section on its institution in preface). One field trip per months was organized to create continuity in our exchanges with local stakeholders. Two first ones were described above. The third one was the workshop implementation and the last one aimed to evaluate its feedbacks. In between the part in Thailand, the project also included two stays in the GREEN research unit of CIRAD, in Montpellier. During these periods, two main events can be enlightened: one week training course to Cormas software and Smalltalk computational language before the departure to Thailand; and the project presentation in ComMod association’ seminar at our return.
Figure 2: Methodological framework.
1.5. Project study site delimitation.
Collaborating with Miss Kunsook, she introduced me to the field and therefore the project site delimitation was set up accordingly to her PhD work. Its description can be separated under three components as following:
scientists regarding the biotic distribution among these two areas. Do they correspond to the habitats of two different populations or rather to the habitats of two subpopulations belonging to one common population? The distinction between the two BSC groups of the bay and the sea being made, and the definition of the FAO fisheries glossary7 for habitat being ‘the place where an organism lives’, we distinguished one habitat per fishing zone. A population is defined by the FAO fisheries glossary as ‘a group of interbreeding organisms that represents the level of organisation at which speciation begins’; while subpopulations correspond to ‘distinct groups in the population between which there is little exchange’. The actual state of research suggested that it is two subpopulations and it is the hypothesis that we kept in this project. Indeed, Miss Kunsook capture-mark-recapture experiments, showed an effective migration of BSC individuals from the bay to the sea (Kunsook, 2005-2010); and Mr Tantichaiwanit study on zooplankton dynamics suggested that both BSC groups of the bay and the sea are contributing to the same common pool of larvae (Tantichaiwanit, 2010). Both areas ‘bay’ and ‘sea’ were then included in the project to stimulate discussions on the topic of BSC spatial distribution between the different stakeholders. However, the global BSC population on which KKB fishery harvest is probably even widely spread in reality, as ‘sea’ was delimited in this project to the coastal zone in front of the bay with roughly the same surface area than the bay.
Biological delimitation: The project was limited to the BSC species even if other species are harvested as by-catches by BSC fishermen. To describe BSC subpopulations, a differentiation by sex, size (carapace length) and female bearing eggs or not was selected to allow considering interesting economic and conservation aspects. As a matter of fact, BSC value increases with its size and it is commonly argued that overexploitation is worsened by high catches of immature crabs and egg-bearing females.
Social delimitation: The project was limited to the local fishermen targeting BSC, excluding other fishermen in the area who harvest BSC as by-catches. Even if trawlers recently arrived in the nearby off-shore area, it was decided to consider only small-scale fisheries. Among local BSC fishermen, different types were distinguished, based on their fishing gears: traps or nets, and their fishing zone(s): bay or sea or both. Representatives of both gears’ types are represented in each fishing zone(s) category. Each gear type has
7
different characteristics of use, selectivity and catchability. The selectivity being defined by the FAO fisheries glossary as ‘the ability to target and capture preys by size and species’; and the catchability as ‘the measure of fishing mortality generated on a stock by one unit of effort’. A social disconnection exists between all these different types of fishermen. Net users notably blame trap users to harvest immature crabs by using a too small mesh size (Kunsook, 2005-2010). In consideration to the cultural custom to avoid confrontation, the term of ‘disconnection’ seems more appropriate than ‘conflicts’. Finally, this project study site delimitation included three villages located around the bay as illustrated in figure 3. Their villagers’ inter-exchanges are very limited even if colleagues meet during fishing activities. These three villages have different size and different representation in term of fishermen types: see table I.
CHAPTER 2. DESIGN OF THE ‘KKB’ AGENT BASED MODEL
Agent Based Models (ABM) are a class of computational models used to represent autonomous agents situated in a common environment and to simulate their actions and interactions while keeping a view on the system as a whole to assess their individual effects at the micro-level on its evolution (at the global level). The ABM described here corresponds to a personal representation of the study site that emerged from a literature review and from the direct interactions with Miss Kunsook and with local stakeholders.
2.1. Description of the conceptual model by ODD protocol.
ODD (Overview, Design concepts, and Details) is a protocol proposed in 2006 to standardize and publish descriptions of individual-based and agent-based models (Grimm et al., 2006). It organises the description under several elements followed below.
Table I: Characteristics of KKB villages.
Figure 3: Illustration
of KKB study site.
Village name
BSC fishermen home
Fishermen types
Thaclang ~100 bay / sea / both trap / net
Klongklud ~ 25 bay trap
Chaolao ~100
Overview:
Purpose. This model was built to represent our understanding of KKB BSC fishery socio-ecosystem. It allowed us identifying its influential entities, variables and their inter-relations as well as assessing system uncertainties. Moreover, it was used as a dialogue tool through its co-construction with Miss Kunsook and as a guideline to organise the literature review. In a second stage, it aimed to be adapted in a role playing game to promote communication between local stakeholders.
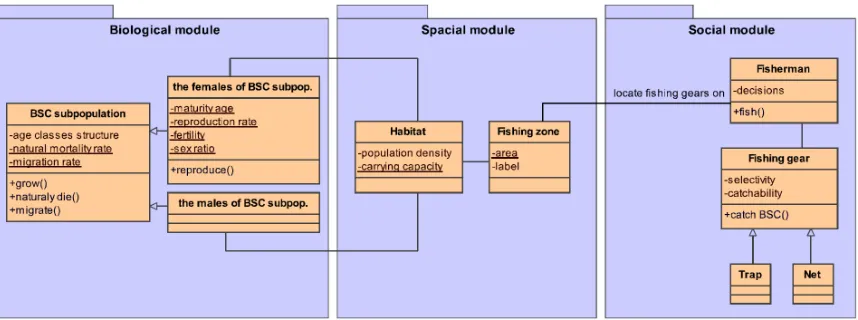
State variables and scales. The model is structured as a set of modules, each module being made of inter-related entities. Entities are characterized by a set of state variables and a set of operations. Modules, entities, state variables and main operations of KKB model are illustrated in a UML8 class diagram figure 4. The model structure is described below.
Accordingly to our study site delimitation (see point 1.5), three modules were distinguished in KKB model: a spatial module, a biological module and a fishing module. The spatial module is composed of one fishing zone entity and one habitat entity. A fishing zone refers to the fishermen representation and is characterized by an area and a label: ‘bay’ or ‘sea’. A habitat refers to a biotic distribution and is characterized by a carrying capacity. The biological module is composed of two entities: the females of a BSC subpopulation and the males of a BSC subpopulation. These entities are similarly characterized by: an age class distribution in 1-month age classes (straightforwardly correlated to a length class distribution), a natural mortality rate and a migration rate. Four additional variables are specifically associated to ‘the females of a BSC subpopulation’ entity: a sex ratio, a maturity age, a reproduction rate and a fertility rate. In a given habitat, the males and the females of a BSC subpopulation are paired. As detailed part 1.5, we made the hypothesis that each fishing zone corresponds to a different habitat, each habitat being the location of one BSC subpopulation, and the two subpopulations are linked by migration processes and a shared recruitment. Finally, the fishing module is composed of three entities: the fishermen, and two fishing gear entities, the traps and the nets. Traps and nets are both characterized by a specific selectivity and catchability (as defined point 1.5). Fishermen are characterized by a collection of fishing
8
gears. At each time step, they can update the size of this collection and then they have to decide the location of each fishing gears on fishing zones.
The spatial scale is defined by the two fishing zones as the two model space units. To fit the biological module, the model time step was set to one month and the model was calibrated for a time horizon of ten years.
Figure 4: KKB model UML diagram. Boxes represent model entities with in the middle part their state variables and in the lower part their operations. Simple lines indicate inter-relations, an ending triangle signifying a specialization.
Process overview and scheduling. Within each month (time step), six phases are processed in the following order: (i) all BSC subpopulations growth, (ii) a part naturally die, (iii) the females of the BSC subpopulations reproduce, (iv) new recruits are equally shared between each BSC subpopulations; (v) fishermen go fishing; (vi) a part of each BSC subpopulation migrates. The phase of fishery is split into three actions: (i) fishermen locate their fishing gears in fishing zones; (ii) the fishing gears catch some BSC that are removed from their respective BSC subpopulations; (iii) fishermen take back their fishing gears and catch data are recorded.
Design concepts:
Design concepts.
Adaptations: However, the BSC subpopulations’ fitness is density dependent. Indeed, habitats are characterized by a carrying capacity which limits females’ fertility. Below this limit, their fertility increases with their density decrease. Fishing gears’ catchability is of course dependent of the BSC subpopulation density.
Predictions: Predictions of the model evolution is then a decrease of the BSC subpopulations’ density in case of over-exploitation, which can go until their total extinction; or their increase until their habitat carrying capacity in case of under-exploitation.
Stochasticity: from the catchability of a given fishing gear and the BSC density in the fishing zone where the fishing gear is located, the number of crabs to be caught by the fishing gear is computed. Then, to determine in which age class to select these crabs, there is a probabilistic function based on the frequency of each class.
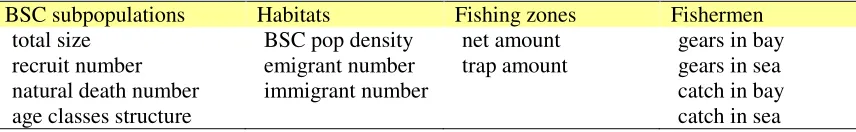
Observations: For testing, understanding, and calibration of the model, probes were defined to track the evolution of several variables, as presented table II.
Table II: KKB model probes.
BSC subpopulations Habitats Fishing zones Fishermen total size BSC pop density net amount gears in bay recruit number emigrant number trap amount gears in sea natural death number immigrant number catch in bay
age classes structure catch in sea
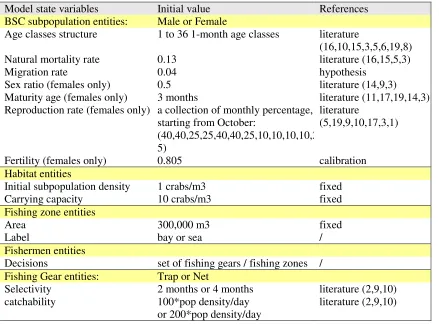
Details:
Table III: KKB model state variables, their initial values and related references. References’ numbers refer to our bibliography.
Model state variables Initial value References BSC subpopulation entities: Male or Female
Age classes structure 1 to 36 1-month age classes literature
(16,10,15,3,5,6,19,8)
Natural mortality rate 0.13 literature (16,15,5,3)
Migration rate 0.04 hypothesis
Sex ratio (females only) 0.5 literature (14,9,3)
Maturity age (females only) 3 months literature (11,17,19,14,3) Reproduction rate (females only) a collection of monthly percentage,
starting from October:
(40,40,25,25,40,40,25,10,10,10,10,2 5)
literature
(5,19,9,10,17,3,1)
Fertility (females only) 0.805 calibration
Habitat entities
Initial subpopulation density 1 crabs/m3 fixed
Carrying capacity 10 crabs/m3 fixed
Fishing zone entities
Area 300,000 m3 fixed
Label bay or sea /
Fishermen entities
Decisions set of fishing gears / fishing zones / Fishing Gear entities: Trap or Net
Selectivity 2 months or 4 months literature (2,9,10) catchability 100*pop density/day
or 200*pop density/day
literature (2,9,10)
Regarding the literature review, data used in the model were as much as possible taken from works conducted in KKB or considering the locality of the other referenced papers. Indeed, it has been found that BSC life cycles highly vary between locations, notably with latitude (Kangas, 2000; Dineshbabu, 2005). This attention in choosing the values of the parameters aimed to assess the state of existing knowledge and to highlight scientific uncertainties. Many aspects related to the biology of BSC remained unknown, however, we did not aim to build an expert model and therefore, some unclear values were roughly approximated to represent the system tendencies, with the idea to discuss them with the stakeholders.
Sub-models. This last part aims to detail all processes described above to allow their full understanding and the model duplication. This part is presented in appendix 2.
species in tropical water, leads to the design of length-based models to estimate growth parameters. From these models, the correlation age/length can be calculated by a standardized equation: the Von Bertalanffy growth equation (1) (Sparre, 1998; still cited as reference in the updated version Gayanilo, 2005).
From the literature, growth parameters selected were: L : 20 cm; K: 1.4 and t0: -0.041. We used these parameters values to build the correlation age/size used in our model.
2.2. Implementation under Cormas software.
The conceptual model was implemented with the Cormas platform, a generic agent-based simulation software developed by the Green research unit (Bousquet et al., 1998) using the object-oriented programming language Smalltalk.
Two main features were added to the conceptual model at its implementation to allow its utilisation in a role playing game. To allow the connection between fishermen’ virtual agents and players, an interactive interface was built to input players’ decisions. Based on our game design (see chapter 3), this interface was opened every twelve time steps to account for yearly decisions. Decisions inputted were then re-used at each time step (month) during one year. Based on our game indicators (see chapter 3), an Excel file was then constructed to receive and organize the presentation of several model outputs.
CHAPTER 3. DEVELOPMENT OF THE ‘IdeasFishery’ ROLE PLAYING GAME
3.1. Game rules’ design.
Game rules were designed by considering three guideline choices: to focus on communication among participants; to create a simple game with few rules but many indicators as a wide angle panorama to be refined collectively; to provide public display of information to encourage exchanges.
villages were included in our study area. However, the invitation of a too small number of participants from each village would have not allowed their good representation. It was then decided to design a game for ten players equally divided in two villages and to simulate the action of a third community composed of five fictive fishermen. An equivalent number of players per village was wished to insure equity. The simulation of one village also allowed discussing the effects of actors involved in the system but outside of the communication arena.
Players’ profile. Players’ profiles were defined with the aim to ease participants’ identification. Each participant played a fisherman with a profile similar to his status in reality and determined by 4 characteristics: a village origin, a fishing area (composed of one or two fishing zones), a fishing gear type (net or trap) and an initial number of gears. It was decided that the profile of a player should be easily accessible to everyone by its notification on id tags and by assigning specific colors to each village and to each player. To mark the game schematic nature, villages and players names were replaced by numbers. At the game initialisation, players would thus receive a kit composed of: an id tag noticing their profile, a game sheet, a variable number of gear cards and a pen.
Players’ goal. Players’ goal was defined as: to harvest enough crabs to satisfy their needs year after year. This formulation allowed referring to individual ambitions as well as to a sustainable management.
their gears) for one day representative for this year; the system monthly variations would be introduced by the game indicators.
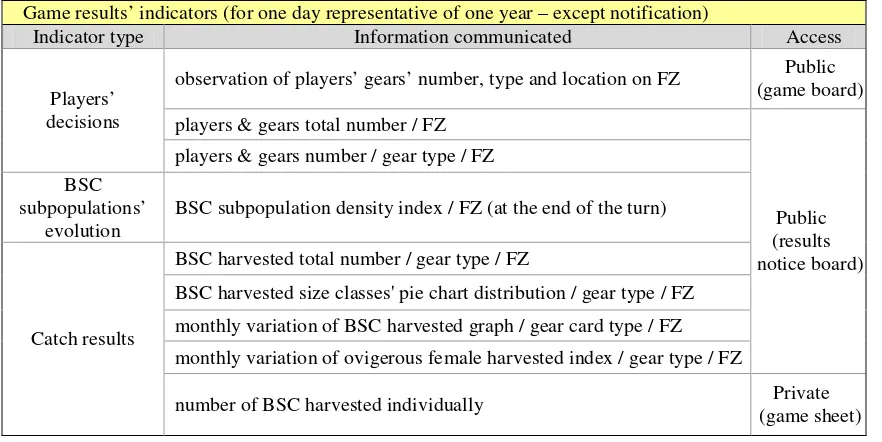
Game indicators. Game indicators aimed to offer to stakeholders a wide set of discussion elements on the system evolution and to look at how participants would make them theirs. They were built by considering stakeholders’ representations via individual interviews (see data collection methodology). They can be divided in three types detailed in table IV and defined as:
- Indicators of players’ decisions: These indicators are published on the game board to provide a synthesis of players & gears number per gear types and per fishing areas. - Indicators ofBSC subpopulations’ evolution: It consists of two density indexes, one per subpopulation, arbitrarily initiated at 1 to allow monitoring the evolution of BSC subpopulations. It refers to a scientist notion and its value is not available in reality. However, it was thought interesting to introduce it in the game to emphasize the direct link between crab subpopulations evolution and fishing activities; and to provide both scientists and resource users’ representations.
- Indicators of catch results: Accordingly to everyone’s decisions, players obtain at the end of the turn their respective catch amount for one day representative for the year. Additionally, information about catches at the community level are displayed as: monthly variations of catches and of ovigerous females harvested, as well as the distribution of BSC harvested size classes and the total catch amount.
Table IV: IdeasFishery indicators. FZ: fishing zones.
Game results’ indicators (for one day representative of one year – except notification)
Indicator type Information communicated Access
observation of players’ gears’ number, type and location on FZ Public (game board) players & gears total number / FZ
Players’ decisions
players & gears number / gear type / FZ BSC
subpopulations’ evolution
BSC subpopulation density index / FZ (at the end of the turn)
BSC harvested total number / gear type / FZ
BSC harvested size classes' pie chart distribution / gear type / FZ monthly variation of BSC harvested graph / gear card type / FZ monthly variation of ovigerous female harvested index / gear type / FZ
Public (results notice board)
Catch results
1
2
3
4
Gaming areas. Four different gaming areas were devised: two village places composed of a circle of chairs; a fishing area represented by a game board divided in two fishing zones; and one collective domain to publicly display game results. It was decided to separate players per village at the game initiation. Village places would be lay apart to recreate their distance in reality and to observe the setting up of communication considering this obstacle. Separation in space of villages and of the fishing areas seemed also important to put players in action physically and to give them the opportunity to re-organise by themselves. Finally, it was though interesting to open the access of a shared domain and to observe its use by participants.
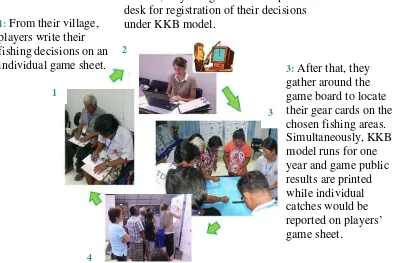
Game sequence. The game sequence of one turn articulates players’ actions in the different gaming areas. A turn of play is made of four gaming (figure 5).
Figure 5: Gaming steps of IdeasFishery.
Additional rules. On the third turn, an announcement is made by the game master to offer to players the opportunity to acquire for free one or two additional gears of their choice.
2: Then, they bring it to the computer desk for registration of their decisions under KKB model.
1: From their village, players write their fishing decisions on an
individual game sheet. 3: After that, they gather around the
Play ending. The game ends after four turns but this limit can be extended up to six turns. At the end of the game, 15 minutes break are given to players after what a collective debriefing is organised to discuss the game events.
Game scenarios. To initiate a discussion on the function of communication among the community, two different communication scenarios were proposed: one forbidding exchanges among villages and one offering a five minutes free consultation time (extendable) between each turn. To evaluate participants’ spontaneous use of exchanges, it was decided to announce the ban of communication only if necessary.
Game supports. This design led to the construction of several game supports: a set of player kits, a game board, a results notice board. Additional information boards were also created to make explicit all indicators and therefore to open them clearly to discussions. A computer with KKB model software and a printer were also necessary.
3.2. Construction of game supports.
Game supports have to be easy to understand and to manipulate for all participants. Moreover, their symbolism needs to be questioned in the cultural context. For example in our case, red and yellow colours were excluded due to their political connotation. All the game supports are illustrated in box 1 and some of their features are detailed below.
Player kits, game board and results notice board. These elements were built following the rules’ specifications. Regarding the gear cards, they were represented by a trap or net drawing and symbolized one unit of fishing pressure without correlation to a real number of gears. This enlightened the schematic nature of the game and its role of dialogue tool rather than expert tool. Colour sets selected were: to print id tags and player game sheets in differently coloured papers for village 1 (pink) and for village 2 (blue); to use coloured post-its as player-code on their id tags, game sheet and gear cards. Game indicators were displayed in several forms (graphs, pie charts, index and numbers) as presented in table IV.
Box 1. Illustration of IdeasFishery game supports
1 : player kit. 2 : game board. 3 : results bulletin board. 4 : third village player’ counter. 5: information boards. 6: BSC carapace shells. 7: a computer with KKB model software and a printer.
3 4
5
6 2
1
3.3. Game tests.
Before implementation, game tools and sequences were experimented with five undergraduate students from Chulalongkorn University. It influenced the game design; and it notably encouraged the collectivization of all indicators results to open information exchanges and to reduce printing time. An example of public result sheet in its last version was then presented to few local stakeholders to test its legibility.
CHAPTER 4. GAME ORGANISATION WITH LOCAL STAKEHOLDERS
4.1. Choice of participants and determination of their gaming profiles.
Considering the game limitation to five players per village, to invite participants from two villages, the selection criteria were:
To play with Klongklud and Thaclang villagers. Indeed, they formed a pertinent group by representing 90% of BSC fishermen in the bay (Kunsook, 2005-2010). It was also the two villages were Miss Kunsook had the main contacts and Thaclang offered the highest diversity among fishermen.
To invite local facilitators as players and village headmen as observers. The involvement of local facilitators in game action seemed important regarding an objective of approach transmission. Moreover, they have a major role in group cohesion. Village headmen are influent stakeholders who can support further process development. Their social status required a tactful consideration and they were invited as observers.
To respect real fishery categories’ distribution in gear type and fishing area. To select participants able to defend their interests and likely to disseminate their experience. These features were evaluated from our interviews as well as on Miss Kunsook, her local facilitators and the village headmen suggestions.
To favour stakeholders known by Miss Kunsook. Thus, she could better interpret their behaviours in game by comparison to reality.
To invite KKB RDSC representatives as observers, with the objectives of influent actors’ inclusion and of approach transmission. The center director and Miss Kunsook contact were invited but only this last one joined the group.
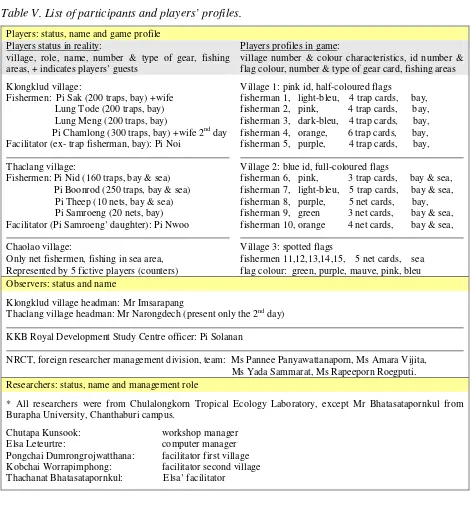
Accordingly, the list of participants’ selected is presented Table V, with the profiles of players.
Table V. List of participants and players’ profiles. Players: status, name and game profile
Players status in reality:
village, role, name, number & type of gear, fishing areas, + indicates players’ guests
Players profiles in game:
village number & colour characteristics, id number & flag colour, number & type of gear card, fishing areas Klongklud village:
Fishermen: Pi Sak (200 traps, bay) +wife Lung Tode (200 traps, bay) Lung Meng (200 traps, bay)
Pi Chamlong (300 traps, bay) +wife 2nd day Facilitator (ex- trap fisherman, bay): Pi Noi
Village 1: pink id, half-coloured flags
Fishermen: Pi Nid (160 traps, bay & sea) Pi Boonrod (250 traps, bay & sea)
Pi Theep (10 nets, bay & sea) Pi Samroeng (20 nets, bay) Facilitator (Pi Samroeng’ daughter): Pi Nwoo
Village 2: blue id, full-coloured flags
fisherman 6, pink, 3 trap cards, bay & sea,
Only net fishermen, fishing in sea area, Represented by 5 fictive players (counters)
Village 3: spotted flags
fishermen 11,12,13,14,15, 5 net cards, sea flag colour: green, purple, mauve, pink, bleu Observers: status and name
Klongklud village headman: Mr Imsarapang
Thaclang village headman: Mr Narongdech (present only the 2nd day)
KKB Royal Development Study Centre officer: Pi Solanan
NRCT, foreign researcher management division, team: Ms Pannee Panyawattanaporn, Ms Amara Vijita, Ms Yada Sammarat, Ms Rapeeporn Roegputi. Researchers: status, name and management role
* All researchers were from Chulalongkorn Tropical Ecology Laboratory, except Mr Bhatasatapornkul from Burapha University, Chanthaburi campus.
Chutapa Kunsook: workshop manager Elsa Leteurtre: computer manager Pongchai Dumrongrojwatthana: facilitator first village Kobchai Worrapimphong: facilitator second village Thachanat Bhatasatapornkul: Elsa’ facilitator
4.2. Workshop schedule and location.
current gathering place between villages during this agency conferences and it offered the required equipments. Though, we recognise that it was not a neutral place and with more time an alternative may have been found. Afternoon sessions were decided regarding fishermen availabilities: they are used to go fishing on mornings. It also allowed us to keep free morning of the second day to adapt the game if necessary and to discuss our project with NRCT members. It was planed that Thaclang villagers, far from the gathering place, would be picked up by van, while Klongklud villagers would come on their own. Players received a compensation of 300 baths per day (500 baths for local facilitators) which was not announced in the invitations.
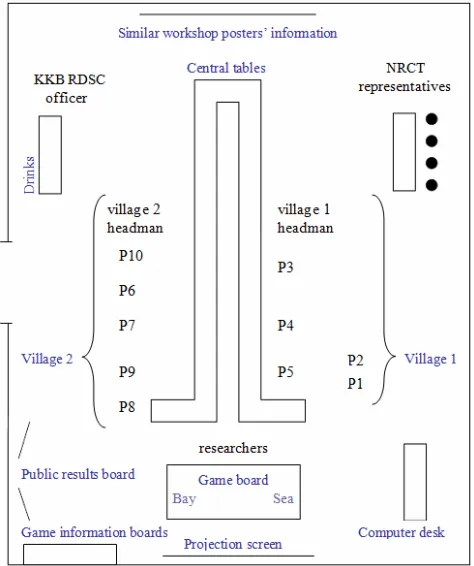
Workshop sessions’ timetable and room setting. One afternoon represented one workshop session and one game scenario. Each workshop session followed the same schedule: a short introduction, a game scenario play, a break, a collective debriefing, and a set of individual interviews. Game plays ran for around 1 to 2 hour and collective debriefings for around 1 to 1 hour and a half (second session being longer than the first one). Considering game features, the workshop room was set in a way to separate the four gaming areas: the two villages, the game board and the public results board. Observers’ desks were laid out in stand back and informative posters on similar experiences were hanged at the back of the room. Space setting is illustrated figure 6.
Figure 6. IdeasFishery room setting and participants’ disposition.
4.3. Workshop management and monitoring.
Team organisation for sessions’ management. The workshop was led in Thai by Miss Kunsook while our two colleagues experimented in ComMod approach played a role of facilitator for each village. I was software manager: recording data, printing and displaying game results. A fifth partner assisted me to follow Thai discussions. The way of leading the process was discussed in advance in order to avoid interruptions as much as possible. However, when new questions arose, my colleagues came ask me how I wanted to answer them. Game debriefings were conducted based on collective analysis of results during break times. After each game session, interviews of participants were translated in English and researchers’ perceptions were debated. The brainstorming following the first afternoon was completed by a Skype exchange with my CIRAD project advisor before we agreed on next session adaptations. Despite assistance, game conduction was absorbing and in practice it was difficult to follow all events and discussions. Besides to limit individual sensibility bias, multiplicity of observer appeared then essential.
Data collection. Workshop sessions were recorded by several methods: saving of all model inputs and outputs, collection of individual and public game sheets, realization of a set of photography, and recording of researchers’ cross-observations. Moreover, participants’ feedbacks were collected via individual questionnaires at three different intervals: after each afternoon by researchers and after one or two weeks by telephone.
CHAPTER 5. WORKSHOP ANALYSIS: SEQUENCES OF EVENTS & GAME RESULTS
For more legibility it was decided to separate the description of workshop events and the analysis of participants’ feedbacks (chapter 6). For the same reason, a chronological narration was the method selected to present workshop sessions.
5.1. The use of game indicators by participants and choice of results’ presentation.
results displayed; then the bulletin board was partly left aside, as participants focused mainly on their personal outcomes(individual catches re presented in table VI, while appendix 3 summarizes players’ strategies made explicit in individual interviews). Public results were mainly discussed during debriefings and focused on: the evolution of gear cards number (Unit Effort), the related Catch Per Unit of Effort (CPUE) and its consequences on BSC subpopulations density index. These results are presented table VII. Evolution of total catches, BSC size distribution, monthly variations of catch amount and ovigerous female harvested index were appreciated in interviews as realistic elements (see appendix 6) but not discussed. Their evolution is presented in appendix 4.
5.2. First session description.
Scenario: No communication; Objective: To create a baseline reflecting the lack of exchanges in reality, by forbidding communication between players (if they were to spontaneously engage in collective discussions).
Introduction: After stakeholders’ presentation, Miss Kunsook opened the meeting by a short introduction on her project progress, its link with our collaboration and the game presentation.
Debriefing: Three main points were then discussed collectively: game tool perceptions, game results and game improvements. First and third parts are detailed in appendix 6. Regarding game results, participants found them realistic but uninspiring. Discussions were slow to start and mainly in a question-answer way between researchers and individual players. However, when they were requested to imagine solutions to avoid CPUE decrease, exchanges drifted to a collective but confuse state. Players talked more directly to each other and mentioned diverse management actions which largely out-scaled game representations such as crab bank or budget handling.
5.3. Second session description.
Scenario: set of five minutes consultation time (extendable) between each turns; Objective: To encourage communication among players.
Introduction: After the first day, it seemed that the influence of others’ actions on individual catches and the direct link between the total fishing pressure and the BSC subpopulations’ density was not clear for players. Indeed, all recognized they did not pay attention to others’ way of playing further than ‘good’ locations on gear board and several mentioned the unpredictability of catch variations. It was then decided to start the session with a brief discussion on two simulation graphs showing the evolution of the BSC subpopulations’ density related to different fishing pressures. The first scenario was based on the four turns of the first gaming session with additional two years under the same fishing pressure as in fourth turn; while the second one presented the situation where all players would have used for five years only one gear less than their maximum. The first scenario led to subpopulations extinction while it increased in second scenario. The link between fishing pressure, BSC subpopulations’ density and individual catches was then re-opened to discussions. Moreover, it allowed researchers to elaborate on the role of the computer and to question the fatalist picture of BSC subpopulations’ decrease.
a bit among players. The most talkative participants enunciated that crab subpopulations’ density should be taken into account but justifications and consequences on their fishing behaviour remained unspecified. No clear approval from all players was requested and game decisions during the progress of the game were not controlled. Consultation periods between turns remained then underused as players did not want to use them anymore. During the first year, all players used less gear than their maximum. Then, strategies were diverse but all kept a relative low number of gears: only four reached their maximum and nobody requested additional ones. As game was running in an easy way with still little interest of players for collective actions, we decided to double the third village’ fishing pressure during the fourth year. This technique of breaching aimed to disrupt the course of actions in order to provoke thinking and to take a new look at situations (Daré, 2005). A fifth game turn was added to allow players to react. However, none of the participants seemed surprised. The event was not discussed among players and except player 9 who used one more gear than her baseline decision, no change in the behaviours of players was observed. CPUE and BSC subpopulations’ density indexes, which were first increasing, decreased strongly in the sea zone from this fourth turn, followed by a decrease in bay in the fifth turn due to the effect of migration.
Debriefing: We came back on this event during the collective debriefing. Participants acknowledged that it could actually happen because a lot of fishermen are present in the area and even people from other villages far away are now fishing in this zone. Then, they spontaneously mentioned additional influent actors such as other fishermen for whom BSC is an important bycatch species. After a slow start, discussions were again poping up in many directions, out-scaling village boarder. One player from Thaclang developed his idea of a reserve area. It was submitted to others but without positive returns. Crab bank management solution was again mentioned but this time Thaclang village headman was present and he asked advices on the start up of this procedure to his colleague from Klongklud village. The idea to experiment a new crab bank project unified Thaclang villagers and they invited KKB RDSC officer to join a prospecting visit of their village area.
5.4. Logistic perturbations.
instead of full pink. Second day, player 6 gears in fourth year were located in the wrong software area and fifth turn was ran for only eleven months. However, these errors did not cause major disruptions as they did not change systems dynamics (player 6 individual results were corrected and CPUE was the mean value of all months in the turn). If software manipulation can be source of mistakes in ComMod implementations; in this case hast and lack of detachment due to researcher first experience were the main errors’ cause. To take time for control model inputs and outputs carefully (personally or with the help of an assistant) should not be too long and appeared essential.
Box 2. Illustration of IdeasFishery game events
1 : gears’ localisation on the game board. 2 : players’ requesting additional gears at the computer desk. 3 : interview after session. 4 : collective debriefing.
5: public results display. 1
2
3
4
CHAPTER 6. WORKSHOP ANALYSIS:
COMMUNICATION NETWOKS & PARTICIPANTS’ FEEDBACKS
More subjective, this chapter completes the workshop description by presenting a synthesis of researchers and stakeholders’ perceptions.
6.1. Synthesis of researchers’ observations on group exchanges’ dynamics. Communication network analysis focused on three observation points:
Participants’ use of the different game spatial areas. As presented chapter 4, figure n, the two villages were separated during the workshop by a line of tables. However, it appeared that despite of constituted an obstacle, it facilitated inter-villages exchanges as villagers took place face to face around them. When open-questions raised, they were then shared inside this global cycle of players rather than inside the village structures. From this organisation, players switched to a disposition per fishing areas by intermixing around the game board. Nevertheless, this practical arrangement did not support specific exchanges. Players seemed to be led by strong individual behaviours and despite researchers’ notices to wait everyone decisions, they frequently moved from one step to the other separately. Regarding to public bulletin board area, it was not used by players. Game observers remained back from the game areas.
influence exchanges’ directions. Overall, only two partner relationships were clearly noticeable and concerned the oldest participants (P2, P9) which requested support from one of their colleagues (respectively P1, P8).
Structure of exchanges in time. During the workshop, four types of exchanges’ times could be distinguished: the game initiations, the plays, the collective debriefings and a set of informal times such as the break intervals, the sessions’ interval and the transportation intervals. Separation of the game period was strikingly noticed by confused and collective exchanges during the first years while the rest of the plays were dominated by individual behaviours. Informal intermissions remained mainly out of observations. However, the way back in van on the second day led to multiple exchanges between Miss Kunsook and Thaclang villagers about their feedbacks on this experience.
6.2. Stakeholders’ perceptions from individual interviews’ analysis.
Appendix 6 presents an analysis of participants’ answers to individual game questionnaires. Five elements can be enlightened:
A good transposition by stakeholders of their reality into the game. Players found the game’s representation realistic and accepted it, some of them suggesting to add new elements such as boats or specific landscape references. Moreover, the genuine nature of fishermen behaviours was noticed by Miss Kunsook and by our facilitator in Klongklud . A common recognition of the playful atmosphere and of the exchanges’ quality. Conversations were judged easy. Moreover, if the exchanges with other participants were firstly let aside in players’ comments; aspects related to communication took more importance the second day and it was their main remembering few weeks after the workshop. Recognition of others and of their thinking came back several times in observations. However, the acknowledgment of a group influence on players decisions during the game remained moderated.
A small increase of conventional knowledge. Scientific learning appeared limited as participants were not curious to question game indicators. Though, it was not our aim and five participants perceived their meeting with others as a source of knowledge.
A keen interest for a little while. The workshop ended with renewed discussions of several projects such as the crab bank experimentation in Thaclang and the setting up of its management group, or the use of individual baskets as personal crab banks in Klongklud. The two following weeks, participants continued to discuss about these intentions and their experience; mainly with their close relatives. However, after one month and a half, no concrete projects had emerged and discussions seemed closed.
CHAPTER 7. DISCUSSION
7.1. Contributions of this experience in the development context of KKB. The participatory gaming and simulation workshops are the key components of the ComMod approach. They refer to what has been recently popularized as serious games. Certainly KKB role playing game primary purpose was not pure entertainment, but to what extent did it effectively stimulate the reflections on BSC fishery management? Ability to make theirs the game and its stakes depends of how participants relate them to their reality and behave during the gaming sessions accordingly. On this point, it seemed that participants easily transposed their representations into the game, which allowed discussions on concrete facts while the game itself was just a simulacrum. However, the observation and analysis of how participants’ interacted with and through the game belongs to social sciences. Its discussion is limited by our inexperience on conflicts management, grasping of game/reality representations… Nevertheless, several observations can be discussed.
remained difficult for them to balance between both frameworks during this first exercise. As ‘group of fishermen’ seemed an ungrounded concept in participants’ reality, it did not take over from the ‘group of players’ concept introduced in the game. It confirmed that collective reflection on the system is not usual for participants and it can explain that the public bulletin board domain remained un-used. Though, the re-forming of the ‘group of players’ during the initialization stage of the second day of the workshop suggests that it is a spontaneous tendency which could be developed.
A starting point to nurture future participatory processes. The aim of this experience was not to find management solutions, but rather to initiate participants to a new approach to grasp their environment and their role in its management. These processes take time and are generally included in wider spheres of management. Impacts are then difficult to evaluate, especially, in a short term project as this one. If participants remained divided on the project impacts in reality; they all appreciated the experience and they attached importance to the recognition of others: first steps to any collaborative projects. By being sensitive to the concerns of fishermen as well as the other organizations (management center, represented by KKB RDSC officer, and research center, represented by
Miss Kunsook), the group enhance its trust building capacity (Hahn et al. 2006).
It was enlighten by Hahn et al. (2006) that trust building and knowledge generation are the central components to collaboration. These lead to increase the local legitimacy for ecosystem management and to facilitate the identification and creation of win–win situations
and conflict resolution.
7.2. Re-assessing the model after its use in the workshop
To design a simulation model imposes to take positions on parameters’ choice, value and presentation. Analysing these choices a posteriori in light of participants’ reactions is very interesting. Two sensitive points are enlighten below: the representation in the game of an information that is not accessible in reality (the BSC subpopulation density), and the removal of another one which exists in reality but was not included in the game (the crab bank tool).
Inclusion of BSC subpopulations density. BSC subpopulation density was an unusual information as it is not a data that can be directly measured in reality. Its availability during the gaming sessions induced perplexity among the players, as reflected by the doubt about their objective they expressed on the second day: ‘the aim of this new game is it to increase the BSC subpopulations’ density?’ This question revealed the gap that can still exist between their understanding and perception of conservation stakes and their interests. Moreover, it led to a common awareness and recognition of the key question in management: the balance between biological and social dynamics.
absence from the game, even if some are existing in reality, invites the participants to clarify and justify collectively their opinions on these elements and by this way to share a common understanding that can be later on referred to in case the players request to finally include a particular element. The collective decision to include a new element in the game and the discussions needed to specify how to concretely do it represent one way to involve the participants of a participatory simulation workshop in the design of the model. Thus the modelling process becomes a co-modelling process. As a result, participants gain a sense of ownership of the model, which progressively evolves as a shared and well accepted representation of the socio-ecosystem, paving the way toward its collective management.
7.3. Collaboration between system expert and ComMod designers.
ComMod process designer) request specific aptitudes and engagements, which enlighten the pertinence of collaborations.
Interest in term of approach transmission. A current question raised by researchers on the development of ComMod approach is how to transfer it. Its learning by its practice is a usual method but it requests a close supervision. This project beneficiated from a local collaboration with post-PhD students who just finished similar projects and who could thus perform a form of tutoring under a global supervision by my CIRAD advisor.
CONCLUSION: TOWARD A PROFESSIONALISATION?
REFERENCES
Numbers refer to Table III references.
(1)
(2)
(3)
(4)
(5)
(6)
Barreteau O., Antona M., d’Aquino P., Aubert S., Boissau S., Bousquet F., Daré W., Etienne M., Le Page C., Mathevet R. 2003. Our companion modelling approach. JASSS, 6 (2): 1. [Available online the: 22/04/2010, at:
http://jasss.soc.surrey.ac.uk/6/2/1.html]
Batoy C.B., Sarmago J.F., Pilapil B.C. 1987. Breeding season, sexual maturity and fecundity of the blue crab, Portunus pelagicus (L.) in selected coastal waters in Leyte and vicinity, Philippines.
Bousquet F., Bakam I., Proton H., Le Page C. 1998. Cormas: common-pool resources and multi-agent Systems. Springer826-837.
Boutson A. 2008. Behavior of Blue Swimming Crab for improving catch selectivity and efficiency of collapsible pot in Thailand.
Daré W.s. 2005. Comportements des acteurs dans le jeu et dans la réalité : indépendance ou correspondance ? Analyse sociologique de l’utilisation de jeux de rôles en aide à la concertation. Thèse pour l’obtention du grade de Docteur de l’ENGREF, spécialité : Sciences de l’Environnement.,
Dineshbabu A.P., Shridhara B., Muniyappa Y. 2008. Biology and exploitation of the blue swimmer crab, Portunus pelagicus (Linnaeus, 1758), from south Karnataka coast, India. Indian J. Fish., 55(3) : 215-220.
Dixon C.D., Hooper, G.E., Ward, T.M. 2008. Blue Crab (Portunus pelagicus) Fishery 2006/07. Stock Assessment Report to PRISA Fisheries. South Australian Research and Development Institute (Acquatic Sciences), Adelaide. F2007/000729-4.
Etienne M., coordinateur. 2010. La modélisation d'accompagnement. Une démarche participative en appui au développement durable (Coll. UPdate Sciences technologies). Editions Quae.
FAO. 2010a. Blue Swimming Crab (Philippines). FishSource database. [Available online the: at:
http://www.fishsource.org/fishery/blue%20swimming%20crab%20(philippines)]
FAO. 2008. Species Fact Sheets, Portunus pelagicus (Linnaeus, 1758). FishSource database. [Available online the: at:
(7) Information Series (Fisheries). No. 8, Revised version. Rome, FAO. 2005. 168 p.
Grimm V., Berger U., Bastiansen F., Eliassen S., Ginot V., Giske J., Goss-Custard J., Grand T., Heinz S.K., Huse G. 2006. A standard protocol for describing individual-based and agent-based models. 198 (1-2): 115-126.
Hahn T., Olsson P., Folke C., Johansson K. 2006. Trust-building, knowledge generation and organizational innovations: the role of a bridging organization for adaptive comanagement of a wetland landscape around Kristianstad, Sweden. 34 (4): 573-592.
Josileen J., Menon N.G. 2005. Growth of the blue swimmer crab, Portunus pelagicus (Linnaeus, 1758)(Decapoda, Brachyura) in captivity. Crustaceana, 78 (1): 1-18.
Kangas M.I. 2000. Synopsis of the biology and exploitation of the blue swimmer crab, Portunus pelagicus Linnaeus, in Western Australia. Fisheries research report no. 121, Western Australian Marine Research Laboratories.
Kunsook C. 2005-2010. Unpublished work. Master and thesis work: Assessment of stock and movement pattern of blue swimming crab Portunus pelagicus (Linnaeus, 1758) for sustainable management : Case study in Kung Krabaen Bay, Chanthaburi Province, Thailand. Bangkok: Chulalongkorn University.
Le Page C., Abrami G., Barreteau O., Becu N., Bommel P., Botta A., Dray A., Monteil C., Souchère V. 2010. Des modèles pour partager des représentations. . In Chapitre 3, Etienne, M. 2010. La modélisation d'accompagnement. Une démarche participative en appui au développement durable (Coll. UPdate Sciences technologies). Editions Quae.
Maheswarudu G., Jose J., Nair K.R., Arputharaj M.R., Ramakrishna A. 2008. Evaluation of the seed production and grow out culture of blue swimming crab Portunus pelagicus (Linnaeus, 1758) in India. 37: 313-321.
Marshall S., Warburton K., Paterson B., D. M. 2005. Cannibalism in juvenile blue-swimmer crabs Portunus pelagicus (Linnaeus, 1766): effects of body size, moult stage and refuge availability. Applied Animal Behaviour Science, 90: 65-82.
Nasuchon N. 2009. Coastal management and community management in Malaysia, Vietnam, Cambodia and Thailand, with a case study of Thai fisheries management. The United Nation, New York: Division for ocean affairs and the law of the sea office of legal affairs.