Move on with Grace
in Steadiness
CHAPTER
I
The Indonesian Economy in 2009
The global economy that was sill under pressure from the crisis posed major challenges for the Indonesian economy during 2009. These challenges emerged mainly at the beginning of the year due to the lingering impact of the global economic crisis that reached its peak in the fourth quarter of 2008. The uncertainies correspond to the depth of the global contracion and the speed of the global economic recovery, not only heightened risks in the inancial sector, but also adversely impacted economic acivity in the domesic real sector. These unfavourable circumstances bore down heavily on monetary and inancial system stability in the irst quarter of 2009, while economic growth posed downward trend contributed from steep contracion in exports of goods and services. These adverse developments in turn undermined the conidence of economic agents both in the inancial sector and real sector and potenially reduce posiive achievements in the previous years.
various other policies, including measure to curb excess volaility in the foreign exchange market. Bank Indonesia policies for the banking system were focused on improving banking industry resilience through further acions to strengthen the banking intermediaion funcion. In iscal policy, the Government with approval of the Indonesian Parliament implemented a substanial iscal simulus, involving tax relief and measures to safeguard public purchasing power. Furthermore, the Government in the beginning of the year has lowered prices for subsidised premium gasoline and automoive diesel. In addiion the government has implemented sectoral policies to bolster the resilience of the domesic economy.
These policies persued succeeded not only in safeguarding macroeconomic and inancial system stability, but also in strengthening domesic economic resilience, with the economy showing iniial improvement in the second quarter of 2009. Financial system and macroeconomic stability also maintained steady improvement for the rest of 2009, relecing in various improvement inancial sector indicators such as CDS, the Jakarta Composite Index, yield on government securiies and the exchange rate. The improvement in inancial system stability subsequently paved the way for strengtened
conidence among economic agents in the real sector and subsequently invigorated economic acivity, which passed its lowest growth in the third quarter of 2009.
Overall, the Indonesian economy emerged from the challenging year in a good shape. Despite lower than 2008, economic grew 4.5% in 2009, the third highest growth in the world ater China and India. Further slowdown in economic growth was avoided due to the domesic demand-driven structure of the economy. Inlaion also came to a modest 2.78%, the lowest level in the past decade. The inancial system stability was maintained with the onset of recovery in the bank intermediaion funcion mainly during the second half of 2009. Further downward pressure on the domesic inancial system was contained to some extent by regulaions prohibiing domesic banks from engaging in speculaive aciviies, most importantly that related to structured products. These regulaions comprise the series of policies for strengthening and consolidaing the banking system in the wake of the 1997/1998 crisis.
1.1
The Global Economy
The global economic crisis that reached its peak in the
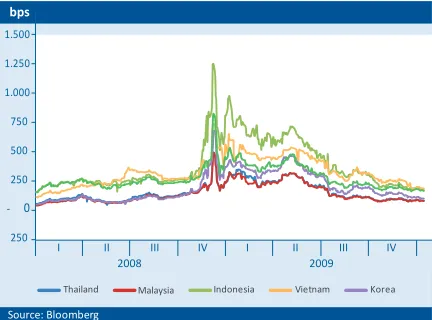
last quarter of 2008 sill coninued unil early of 2009. Global inancial markets remained fraught with instability due to strong negaive seniment of the outlook for global economic recovery as well as deterioraing the performance of leading US inancial insituions such as Ciigroup, AIG and BoA. This unfavourable environment lead the investors to scaled back their porfolios in credit markets and capital markets, both in advanced and emerging markets. The declining fund placements on emerging markets was also driven by heightened risk percepions on emerging markets as described, among others, in the CDS levels for some Asian emerging markets which remained high, averaging 450 bps at end-March 2009 compared to the normal level of about 100 bps recorded in the irst half of 2008 (Chart 1.1). Under these uncertainies, global investors shited their porfolios to risk-free assets such as US Treasury Bonds. On money markets, the coninuing liquidity crunch was relected in the widening USD LIBOR-Overnight Index Swap (OIS) spread (Chart 1.2). At the end of March 2009, the spread in advanced economies such as the US, UK and the European Union was sill around 150 bps, well above the normal level of about 70 bps such as recorded in the irst half of 2008. On stock markets, an ongoing exodus of investor funds coninued to bear down on global stock indices (Chart 1.3).
The development in the global inancial sector impacted global economic growth. The consolidaion process and uncertainies in the inancial sector impoded lows of
contracion in the global economic growth. Following the uncertainies in the inancial sector, global economic growth projecions were steadily revised downwards. Internaional inancial insituions such as the IMF made several revisions to world economic growth projecions during 2009. In April 2009, the IMF forecasted that the world economy would pose 1.3% contracion, down considerably from November 2008 when growth was sill projected at a posiive 2.2% (Table 1.1). The global economic contracion was driven to a large extent by contracion in advanced economies, while growth in developing economies remained in posiive territory, driven by the performance of China, India and Indonesia.
In line with the declining of world economic growth, contracion also took place in world trade volume (Table 1.1). In April 2009, world trade volume in 2009 was esimated to record a negaive growth around 11.0%, down considerably from the posiive 3.0% in 2008. This contracion represents the steepest decline since the irst publicaion of world trade volume staisics in 1970 (Chart 1.4). In this respect, some Asian economies heavily reliant on trade recorded a signiicant contracion due to declining exports, triggered by plunging commodity prices and falling demand in developed economies.
Chart 1.1 CDS of the Emerging Countries Chart 1.2 LIBOR and 3 Months OIS Spread bps
Source: Bloomberg
US Euro UK AUS
bps
Source: Bloomberg
Thailand Malaysia Indonesia Vietnam Korea
Table 1.1 World Economic Growth
percent
Source: World Economic Outlook (WEO), IMF
Countries Periods of Projecion
Nov-08 Jan-09 Apr-09 Jul-09 Oct-09 Jan-10
World 2.2 0.5 -1.3 -1.4 -1.1 -0.8
Advanced Economies -0.3 -2.0 -3.8 -3.8 -3.4 -3.2
USA -0.7 -1.6 -2.8 -2.6 -2.7 -2.5
European Union -0.5 -2.0 -4.2 -4.8 -4.2 -3.9
Japan -0.2 -2.6 -6.2 -6.0 -5.4 -5.3
Emerging Markets 5.1 3.3 1.6 1.5 1.7 2.1
Commonwealth Countries in Eastern Europe 3.2 -0.4 -5.1 -5.8 -6.7 -7.5
Asian 7.1 5.5 4.8 5.5 6.2 6.5
China 8.5 6.7 6.5 7.5 8.5 8.5
India 6.3 5.1 4.5 5.4 5.4 5.6
ASEAN-5 4.2 2.7 0.0 -0.3 0.7 1.3
Middle East 5.3 3.9 2.5 2.0 2.0 2.2
Western Hemisphere 2.5 1.1 -1.5 -2.6 -2.5 -2.3
The downturn in global economic growth in turn
contributed to low levels of global commodity prices and weak global inlaionary pressures. Decreasing demand for global commodiies pushed downward pressure on prices for energy and non-energy commodiies (Chart 1.5). Despite a modest upturn ater the end of March 2009, world oil prices in irst quarter of 2009 stayed at around 48 US dollars per barrel (Chart 1.6). Low commodity prices and the slowdown in global demand eased inlaionary pressures, both in the advanced economies and the developing economies (Chart 1.7).
The uncertainies and pressures in the global economy triggered by the ongoing global liquidity crunch, had led many countries to implement intensive policy responses, both for convenional and un-convenional policy. Central banks pursued convenional policies by cuing policy rates to near-zero levels in some developed economies. The convenional policy was reinforced by un-convenional
policies in some advanced economies, such as expanding
the basis of collateral used in central bank monetary
operaions, extending the tenor of liquidity support and buying securiies including mortgage-backed. Other policy acions included blanket guarantees on bank deposits, recapitalisaion of inancial insituions and measures to limit porfolio losses in the banking sector. Financial insituions in some advanced countries, including the United States and Europe, were bailed out by central banks in order to preserve inancial system stability and to prevent further negaive impact on the economy. The force of the pressure bearing down on inancial markets also prompted the Federal Reserve, Bank of England, European Central Bank, Bank of Japan and the Swiss Naional Bank to set up currency swap agreements to ease the US dollar liquidity crunch in some regions.
On the iscal side, governments in developed and developing countries implemented substanial iscal
Chart 1.6 Internaional Oil Price Chart 1.5 Commodity Price Index
Chart 1.3 Stock Indices of Developed and Emerging Countries Chart 1.4 World Trade Volume Growth
simulus to push demand and to miigate rising unemployment. Governments took these policies ater
considering that the room for further interest rate cuts
became more limited. The iscal simulus in the US soared to 787 billion US dollars (5.5% of GDP) comprising 287 billion US dollars in tax relief, which 500 billion US dollars allocated for infrastructure projects and other social programmes. In Europe, iscal simulus packages in the four major economies (Germany, UK, France and Italy) amounted to 1% of GDP, while three simulus packages launched by the government of Japan totalled 12 trillion yen represening an equivalent 122 billion US dollars. In China, the government released 4 trillion yuan into the economy, an amount equivalent to 586 billion US dollars or 13.3% of GDP, allocated primarily for infrastructure development.
The various policy measures launched in many countries succeeded in reducing systemic risk on inancial markets and restoring market paricipants conidence since second quarter of 2009. The liquidity injecions by central banks eased credit market ightness as well as lowering the LIBOR-OIS spread down to levels before the Lehman Brothers bankruptcy in September 2008. At the same ime, intervenion by central banks in developed countries through expanded scope and intensity of monetary operaions, as well as measures to consistently safeguard the inancial system have diminished the systemic risk on inancial markets. On one hand, the response from some major central banks to buy higher-risk securiies had increased markets aciviies that were previously weaken due to the reluctance of market paricipants to engage in transacions. On the other hand, the purchase of securiies was also aimed
at reducing short-term inancing costs for the private sector.
In subsequent developments, the decline in inancial market risk were also described in the narrowing of the CDS and 3-month LIBOR-OIS spread in some countries since the second quarter of 2009 (Charts 1.1 and 1.2). In line with this environment, the risk percepions in stock market also improved, generaing incrising global inancial markets, including stock markets in Asia (Chart 1.3). The rising stock market performance in Asia were partly contributed by low interest rates and slower economic recovery in developed countries, that subsequently encouraged higher capital lows into Asian stock markets (Chart 1.8).
With recovery under way in the inancial sector, the improvement was also observed in world economic growth. The signiicant iscal simulus had a beneicial efect on household consumpion, which resumed an upward trend. The posiive indicator in consumpion was followed by improvement in manufacturing sector staring in third quarter of -2009. Even the US housing sector, the original trigger of the crisis, was believed to have passed its lowest point since the third quarter of 2009. Aggressive interest rate cuts accompanied by purchasing policies of mortgage-based debt securiies had also reduced the cost of home inancing in the US. Responding to low interest rates on home mortgages, home purchases by the households had resumed, resuling in a gradual rise in housing prices.
The role of developing Asian countries to global
economic recovery were quite substanial. In this regards,
Chart 1.7 Inlaion of Advanced and Developing Countries Chart 1.8 Capital Flow to Asia Stock Market
Source: Bloomberg
Advanced Country Developing Country (right side)
Source: Bloomberg millions of USD
higher economic growth in Asia’s emerging markets had compensated the sluggish recovery in advanced economies (Chart 1.9). In China, the iscal simulus had boosted growth in government-sponsored infrastructure projects, minimizing the impact of slow recovery in exports. In India, the vibrant manufacturing sector had helped sustain posiive growth in the economy. Rising demand from China and India had beneited exports from other Asian economies. The improvement in exports along with iscal simulus and accommodaive
monetary policy had contributed to Asian economies to
reach a more rapid recovery compared to other regions. Along with this improving trend, the world economy had undergone a faster than expected recovery and esimated to record 0.8% contracion, a more favourable igure when
compared to earlier forecasts (Table 1.1).1
The faster than predicted recovery in the global economy and accommodaive global policies had boosted the prices of the world energy and non-energy commodiies. While demand in advanced countries remained weak, demand in emerging markets, led by China, had spurred increases in commodity prices. Robust demand in Asian emerging markets for biofuels as an alternaive energy, had boosted the prices for primary commodiies such as soy beans and CPO. The rising prices for mining commodiies such as coal and metal ores were also consistent with the increasing trend of manufacturing sector in developing countries. Oil prices at end-December 2009 reached 79.4 US dollars per barrel, up from of 33.9 US dollars recorded in the second week of February 2009. The escalaion in global commodity prices and strengthening world demand subsequently contributed to rising global inlaionary pressure at the end of 2009 (Chart 1.7).
1 For the latest esimaion of world economic growth in 2009, see the WEO Update January 2010
During the period of global economic recovery, many countries have taken policies to safeguard inancial system stability and promote economic recovery. Albeit pursued less intensively compared to the irst quarter of 2009, monetary policy remains in easing stance,. Approaching year end, some central banks started to raise their policy rates to respond to future inlaionary pressure. In addiion to monetary relaxaion, central banks in developed countries, such as the Federal Reserve, Bank of England, European Central Bank, Bank of Japan and the Swiss Naional Bank extended their currency swap
agreements to ease pressure on US dollar liquidity in
some regions unil October 2009. The Federal Reserve also expanded the guarantee for securiies accepted within the framework of the Term Asset-Backed Securiies Loan Facility (TALF) and eased the term of collateralised securiies.
Chart 1.9 World Economic Growth
Source: IMF
percent, qtq, annualized
1.2
To miigate the impact of the global economic crisis on the Indonesian economy, Bank Indonesia and the Government took a series of policies to reinforce earlier measures. Some policies were aimed at restoring conidence among economic agents both in the inancial and non-inancial sectors, overcoming the liquidity ightness in the banking system and strengthening economic growth momentum. Other policies were also implemented to mantain inancial system resilience and monetary stability, in order to support sustainable economic growth.
The various policies undertaken in 2009 were a coninuaion of the series of policies implemented by Bank Indonesia and the Government in the fourth
quarter of 2008.2 In response to instability in the inancial
market, the Government issued three new Government Regulaions in Lieu of Low (PERPPU), namely PERPPU No. 1 of 2008 concerning Amendment to the BI Law, permiing credit rated with current collecibility to be used as collateral for the Short-Term Funding Facility (FPJP), PERPPU No. 3 of 2008 concerning Amendment to the Indonesian Deposit Insurance Corporaion (LPS) Law, seing forth the basis for increasing the LPS customer deposit guarantee ceiling from Rp 100 million to Rp 2 billion, and PERPPU NO. 4 of 2008 concerning the Indonesian Financial Safety Net (IFSN), used among others to provide setlement guarantee if a bank or non-bank inancial insituion (NBFI) experiences liquidity diiculies
2 A full descripion of the policies adopted by Bank Indonesia and the Government in Q4/2008 is presented in ”Indonesian Economic Report 2008.”
or is declared a systemically important failed bank or NBFI. PERPPU No. 4 of 2008 also sipulates the establishment of the Financial System Stability Commitee (FSC) comprising the Minister of Finance, Governor of Bank Indonesia and the FSC secretary. Besides these policies, Bank Indonesia announced some improvements to exising regulaions in the fourth quarter of 2009, including updaing regulaion concerning Short-Term Funding Facility (FPJP) which subsequently revised as the Emergency Liquidity Assistance (ELA), extending the FX swap tenor, issuing regulaion limiing currency speculaion against the rupiah and a prohibiing transacion on structured product derivaives linked to foreign exchange transacions.
g Monetary Policy Response
Bank Indonesia maintained easing monetary policy stance during 2009. With minimum inlaionary pressure, Bank Indonesia saw the necessity to boost the domesic economy while ensuring inancial system stability. The inclusion of inancial system stability in these monetary policy formulaion has a strategic importance, because Bank Indonesia observed for coninuaion instability in the inancial system may trigger further pressure on macroeconomic stability and potenially disrupt the economy. This policy direcion and strategy is consistent with the implementaion of the ITF in striking the opimal balance between achievement of the inlaion target and economic growth over the last 5 years.
With this monetary policy direcion, Bank Indonesia lowered the BI Rate in 2009 in diferent magnitudes, divided into three phases, based on a comprehensive assessment on the current state and the outlook of the economy. During the irst phase in January-March 2009, the BI Rate was cut by 50 bps each month to 7.75% (Chart 1.10). The bold response in the BI Rate cuts was taken by considering the remain considerable pressure sill linger the inancial system and the coninuing slowdown in economic growth. Against this, future inlaionary pressures were esimated to be benign. In the second phase of April-August 2009, BI Rate cuts were done in lower magnitude of 25 bps per month, bringing the rate to 6.50% in August 2009. This policy course was taken ater considering waning pressures on the inancial system and contained inlaionary pressure, while economic growth was quite mild. In the third phase from September to December 2009, the BI Rate was held steady at 6.50%. With inancial system stability irmly in hand, the 6.50% level of the BI Rate was adequately consistent with the
inlaion target for 2010-2011, while allowing room for measures to boost economic growth. During 2009, the BI Rate was slashed 275 bps from the December 2008 level of 9.25%.
Bank Indonesia also implemented some operaional policies on the foreign exchange and rupiah money markets to strengthen monetary policy efeciveness. The objecive of these polices is to provide assurance for short-term liquidity in money market while simultaneously opimising bank liquidity management. On the foreign exchange market, Bank Indonesia pursued an exchange rate stabilisaion policy to miigate the impact of the global liquidity crisis on domesic foreign exchange liquidity. This policy was undertaken in a measured acion, while maintaining an adequate foreign exchange reserves (Chart 1.10). The policy was adopted amid coninued heavy pressure on the rupiah, paricularly during the irst quarter of 2009, due to the mouning capital ouflows from the inancial market. Bank Indonesia also adopted another policy on 30 January 2009 to ensure adequate liquidity on the forex market by launching foreign currency repurchase agreements (repo) using the Government Global Bonds
as its underlying instruments in these transacions.3 This
policy enables domesic banks to repo their Global Bonds to Bank Indonesia in order to obtain foreign currency liquidity.
To provide greater asuransse of adequate foreign exchange liquidity, Bank Indonesia also strengthened bilateral and mulilateral cooperaion with regional central in the form of currency swap agreements. In March 2009,
3 Bank Indonesia Regulaion No. 11/4/2009 concerning Bank USD Repurchase Agreements with Bank Indonesia dated 30 January 2009.
Chart 1.10 BI Rate and Internaional Reserves
billions of USD percent
Bank Indonesia and the People’s Bank of China concluded a Bilateral Currency Swap Arrangement (BSCA). This arrangement provides for a rupiah/renmimbi swap line valued at Rp 175 trillion/RM 100 billion and get to be efecive for 3 years. This arrangement can be extended by
mutual agreement.4 This agreement is not only expected
to ensure short-term liquidity, but also support trade and investment between the two countries. Bilateral agreement was also established between Bank Indonesia and Bank of Japan, acing on behalf of the Minister of Finance, by the signing of amendment to increase the value of the BSA concluded under the Chiang Mai Iniiaive as part of the inancial cooperaion among ASEAN+3 member countries in April 2009. The amendment permits
4 This cooperaion exists outside the Bilateral Swap Arrangements under the Chiang Mai Iniiaive framework.
Indonesia to swap rupiah against USD to a maximum of 12 billion US dollars, higher than the previously agreed 6 billion US dollars. In a further cooperaion under a mulilateral arrangement, Indonesia also signed the CMIM agreement with other ASEAN+3 members in December 2009. Under the CMIM cooperaion framework, Indonesia has a borrowing quota of 11.925 billion US dollars.
On the rupiah money market, Bank Indonesia also implemented various measures to safeguard money market stability. Within this context, Bank Indonesia opened repo windows for 1 and 3 month tenors to provide a guarantee and temporary cushion for banking liquidity, from mid-April 2009 to September 2009. This strategy complements exising measures such as standing faciliies, comprising standing deposit faciliies and standing lending faciliies. In addiion to these policies, Bank Indonesia
Source : Ministry of Finance
Table 1.2 Addiional of Fiscal Simulus
Simulus Allocaion (trillion rupiah)
I. Increasing Purchasing Power 25.85
A. Tax 2.50
B. Subsidy on Expenditure 1.35
1. Tax Subsidy (DTP) 1.00
2. Non Tax Subsidy 0.35
II. Improving Business and Exports Compeiiveness and Resiliancy 35.47
A. Tax 18.50
B. Subsidy on Expenditure 16.47 1. Tax Subsidy (DTP) 12.30
2. Non Tax Subsidy 4.17
C. Financing 0.50
III.Improving Labor Intensive Infrastructure 11.94 A. Insituional Expenditure 11.22
1. Public work 6.60
2. Transportaion 2.20
3. Energy 0.50
4. Public housing 0.40
5. Market 0.32
6. Farming 0.65
7. Training for Labor 0.30
8. Special Housing 0.10
9. Health 0.15
B. Non Insituional Expenditure 0.72
was maintaining economic liquidity while simultaneously reinforcing the banking liquidity structure of the banking system with a 2.5% addiional secondary statutory reserve requirement efecive from October 2009.
g
Fiscal Policy Response
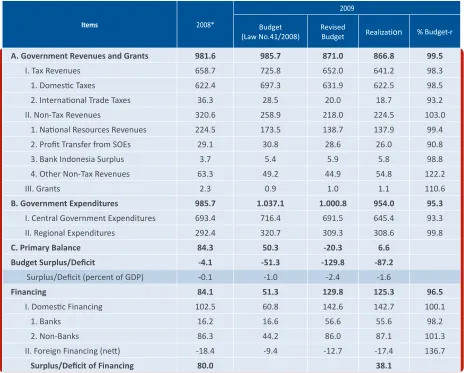
Fiscal policy in 2009 focused on delivering a simulus to the economy during the period of the global economic downturn, while simultaneously maintaining the iscal sustainability. The iscal simulus package approved by the Indonesian Parliament was launched with three key objecives: (i) maintain and/or boost public purchasing power, (ii) bolster corporate/business sector resilience in coping with the global crisis and (iii) create jobs and miigate the impact of worker lay-ofs through labour-intensive infrastructure development policies. This addiional simulus totalled Rp 73.3 trillion was packaged into tax savings and tax subsidies for business and the infrastructure package (Table 1.2). This simulus raised the deicit in the Revised 2009 Budget to 2.4% of GDP from the originally targeted 2009 Budget deicit at 1% of GDP (Table 1.3).
The addiional iscal simulus in the Revised 2009 Budget increased the previously planned simulus. In the 2009 Budget, the scope of simulus acions also extended to personnel expenditures and subsidies. Related to personnel expenditures, basic salaries were raised by an average of 15% and a 13th month salary was paid for civil servants and members of the armed forces and police. Subsidies were also allocated for fuel, electricity, ferilisers and foodstufs. Under the food subsidy policy, the Government provided subsidised rice for the poor, covering 18.5 million target households. Each target household received an average of 15 kg rice each month sold at Rp 1,600/kg for 12 months.
The realizaion of the 2009 budget (APBN-P2009) turned to be lower than the target deicit. The 2009 Budget deicit came to Rp 87.2 trillion or 1.6% of GDP, below the earlier target set at 2.4% (Table 1.3). Even so, the adjusted budget adequately supported the original programmes and objecives. This was possible because the lower deicit was resulted from diferences in the assumpions used. For example, savings were achieved on the fuel subsidy, which came 14% below target due to the lower than predicted of Mid Oil Plats Singapore (MOPS) price. Added to this was 14.4% saving on debt interest payments as a result of appreciaion in the rupiah beyond the assumed
level and draw down on foreign borrowings below the budgeted target.
The inancing strategy for the 2009 budget deicit also sought to avoid pressure on the iscal sustainability. This inancing strategy involved the prioriising of domesic market issuances of government securiies, implementaion of a front loading strategy, uilizing foreign currency government securiies as a
supplementary instrument and acivaing of the buyback
and debt switching.Under the buyback strategy, the
Government bought government securiies twice for total Rp 8.52 trillion. Debt switching was carried out by holding six debt switching aucion of government securiies accounted Rp 2.93 trillion. The debt switching strategy was implemented to extend debt maturity and reduce reinancing risk. This strategy has kept the oicial debt burden in comparison to the capacity of the economy on a downward trend, relected in the decrease the oicial debt to GDP raio from 33% in 2008 to 29% at the end of 2009 (Chart 1.11). The inancing strategy was also supported by the approximately Rp 38.1 trillion inancing surplus in the 2009 budget outcome, which can be used as source of future inancing (Table 1.3).
In addiion to the expansionary iscal policy implemented in the simulus, the Government also lowered prices for subsidised gasoline and automoive diesel fuels on 15 January 2009. Premium gasoline was reduced 18.2% from Rp 5,500/litre in December 2008 to Rp 4,500/litre and automoive diesel by 6.25% from Rp 4,800/litre in December 2008 to Rp 4,500. The decision to reduce prices for subsidised fuels was done ater earlier price cuts announced in December 2008 in response to the
Chart 1.11 Public Debt to GDP Raio Source: Ministry of Finance
percent
Foreign Debt Government Security Total
downward trend in world oil prices that commenced during the second half of 2008.
g Banking Policy Response
Bank Indonesia policy for the banking system focused on building the resilience of the banking industry through further acions to strengthen the banking intermediaion funcion. In early 2009, a policy framework to resolve the liquidity crunch in the banking system was established under the second amendment to Act No. 23 of 1999 concerning Bank Indonesia in Act No. 6 of 2009. This law sets forth the legal basis for Bank Indonesia to extend credit or inancing to banks with short-term funding diiculies and to extend the emergency liquidity assistance (ELA) to systemically efected banks. To promote banking intermediaion, Bank Indonesia also
lowered the risk weighted assets for credit to micro, small and medium enterprises (MSMEs).
Other policies also pursued by Bank Indonesia to bolster resilience in the banking system include implementaion of risk management and prudenial principles in
aciviies related to structured products. In regard to risk management, Bank Indonesia introduced a policy to include of operaional risk as one factor in the capital
adequacy calculaion.5 Another regulaion on bank
risk management, was also issued, especially the one that prioriising customer protecion through product
and banking aciviies informaion transparency.6 To
5 Circular Leter No. 11/3/DPNP dated 27 January 2009 concerning Calculaion of Risk-Weighted Assets for Operaional Risk, using the Basic Indicator Approach
6 Bank Indonesia Regulaion No. 11/25/PBI/2009 concerning
Table 1.3 State Budget2008-2009
* Based on Central Government Financial Report Source : Ministry of Finance
trillions rupiah
Items 2008*
2009
Budget
(Law No.41/2008) Revised Budget Realization % Budget-r
A. Government Revenues and Grants 981.6 985.7 871.0 866.8 99.5
I. Tax Revenues 658.7 725.8 652.0 641.2 98.3 1. Domesic Taxes 622.4 697.3 631.9 622.5 98.5 2. Internaional Trade Taxes 36.3 28.5 20.0 18.7 93.2 II. Non-Tax Revenues 320.6 258.9 218.0 224.5 103.0
1. Naional Resources Revenues 224.5 173.5 138.7 137.9 99.4 2. Proit Transfer from SOEs 29.1 30.8 28.6 26.0 90.8 3. Bank Indonesia Surplus 3.7 5.4 5.9 5.8 98.8 4. Other Non-Tax Revenues 63.3 49.2 44.9 54.8 122.2 III. Grants 2.3 0.9 1.0 1.1 110.6
B. Government Expenditures 985.7 1.037.1 1.000.8 954.0 95.3
I. Central Government Expenditures 693.4 716.4 691.5 645.4 93.3 II. Regional Expenditures 292.4 320.7 309.3 308.6 99.8
C. Primary Balance 84.3 50.3 -20.3 6.6
Budget Surplus/Deicit -4.1 -51.3 -129.8 -87.2
Surplus/Deicit (percent of GDP) -0.1 -1.0 -2.4 -1.6
Financing 84.1 51.3 129.8 125.3 96.5
I. Domesic Financing 102.5 60.8 142.6 142.7 100.1
1. Banks 16.2 16.6 56.6 55.6 98.2
2. Non-Banks 86.3 44.2 86.0 87.1 101.3 II. Foreign Financing (net) -18.4 -9.4 -12.7 -17.4 136.7
compliment regulaions related to bank risk management, updated rules have also been introduced for banks
conducing mutual fund-related aciviies.7 Alongside the
issuance of the Bank Indonesia Regulaion concerning implementaion of risk management, prudenial
regulaions have also been launched for banks conducing
business in structured products.8 A key provision in the
Bank Indonesia Regulaion pertaining to structured products is the requirement for banks to obtain approval principle from Bank Indonesia before launching a structured product acivity. In addiion, banks must also implement internal policies and procedures to support the prudenial principles when launching these structured products. Besides these two major policies, changes were also made to the insituional regulaion of the banking system in response to the rapid pace of change and
growing integraion of the banking industry.9
Banking policies were also supported by policy acions in the payment system aimed at strengthening the reliability of the payment system infrastructure. Among these was the coninuaion of development of the BI-RTGS system and Bank Indonesia Scriptless Securiies Setlement System (BI-SSSS) commenced in 2008. The more reliable, secure and eicient infrastructure and increased capacity is expected to miigate risks in the BI-RTGS system and support inancial system resilience.
Implementaion of Risk Management for Commercial Banks 7 Circular Leter No. 11/36/DPNP dated 31 December 2009 concerning
Implementaion of Risk Management at Banks Conducing Mutual Fund-Related Aciviies.
8 Bank Indonesia Regulaion No. 11/26/PBI/2009 concerning Prudenial Principles for Structured Products Aciviies Conducted by Commercial Banks
9 Bank Indonesia Regulaion No. 11/1/PBI/2009 concerning Commercial Banks
g Sectoral Policy Response
The Government also introduced a range of sectoral policies to strengthen the resilience of the real sector in the economy. In the mining sector, the Government announced major changes to the regulaion on mining producion and licensing with greater consideraion to geographical condiions, the carrying capacity of the
environment and regional autonomy.10 In agriculture,
the Government issued regulaions to assure availability of arable land for food crops and opimum use of
isheries resource potenial.11 To provide more adequate
infrastructure, the Government has opened the door for private sector in providing power supply and assigned an expanded role to regional governments in supplying
of electriicaion.12 In regard to infrastructure inancing,
the Government set up a state owned company in 2009 speciically to assist the funding of infrastructure projects.
Other sectoral policies were also targeted at miigaing impact from the global inancial crisis. To protect domesic manufacturing from illegal imports, the Government took acion in January 2009 to ighten controls on imported goods. These measures included restricions on certain imports such as food and beverages, footwear, garments, toys and electronics. Accompanying these policy acions were regulaions for improving management of other general imports. The Government also took acion to accommodate direct imports of used capital goods by industry actors.
10 Act No. 4 of 2009 concerning Mining of Minerals and Coal
11 Act No. 41 of 2009 concerning Sustainable Protecion of Land for
Food Crop Culivaion
1.3
Performance of the Domesic Economy
Pressures on the global economy had inevitably impacted Indonesia’s economic performance in 2009 especially during Q1/2009. As an open economy, Indonesia felt the blow of the global economic downturn through a
twofold transmission, the inancial channel and trade channel. Through the inancial channel, the lingering global inancial market turbulence had kept risks in the domesic inancial market and investment in Indonesia to remain high in Q1/2009. Heightened risk percepions were evident from various inancial market risk indicators
for Indonesia such as CDS, the EMBIG spread and the yield spread for Indonesia Global Bond over US T-Notes. In Q1/2009, the CDS spread reached a high level of 713, well above the normal level of about 200. Similarly, the yield spread for Indonesia Global Bond over US T-Notes remained wide reaching 8.9% compared to the 3% pre-crisis average (Chart 1.12). The heightened percepions
of risk in turn prolonged the wave of short-term capital
ouflows with pressure bearing down on domesic inancial system stability during Q1/2009. Impact from the trade channel was evident in the sizeable contracion in
exports of goods and services, which slowed the overall growth of the economy.
The various policy responses launched by Bank Indonesia
and the Government, including the policies of Q4/2008,
contributed posiively to the restoraion of inancial
system stability from Q2/2009 and paved the way for
in the sharp drop in CDS to 160 and the narrowing of the yield spread for Indonesia Global Bonds over US T-Notes
to the 1.7% level (Chart 1.12). In response, posiive capital inlows resumed into the domesic inancial market and the inancial system began regaining ground. The improvement in inancial system stability then set the stage for renewed conidence among economic actors in
the real sector and provided a fresh boost to economic growth.
The slide in inancial sector performance and economic
growth amid the turmoil in the global economy was also
miigated through the posiive contribuion of a number
of domesic13 factors that operated as an efecive bufer
absorbing the impact of the global economic downturn.
The irst domesic factor was related to the sizeable role of household consumpion, which kept the Indonesian economy from becoming overly suscepible to global economic contracion. Healthy corporate balance sheets relected in low levels of leverage and relaively strong cash low also provided the economy with an extra measure of resilience to inancial market shocks, such as exchange rate volaility. The second domesic factor was related to the characterisics of Indonesian banks and inancial insituions, which sill leaned towards a convenional stance of minimum exposure to problemaic foreign securiies. As a result, the direct impact of the
13 The efect of domesic factors in restraining the global economic
turmoil was in line with the argument from Berkmen et. al (2009). By using cross-country data, the study of Berkmen et. al (2009) showed that domesic factors afected the diferences in economic growth
across countries during the period of global economy turmoil.
Complete analysis of this mater can be seen in Berkmen P., Gelos, Rennhack, and Walsh (2009), ”The global Financial Crisis: Explaining Cross-Country Diferences in the Output Impact ”, IMF Working
Paper 280, December
global inancial market turmoil was similarly constrained. Another factor bolstering the resilience of the banking system was the posiive efect of the many acions for reinforcement and consolidaion of the banking system in the atermath of the 1997-1998 crisis.
g
Balance of Payments
The strong impact of the global economic turmoil on the
domesic economy was iniially relected in the current account and the capital and inancial account. In 2009,
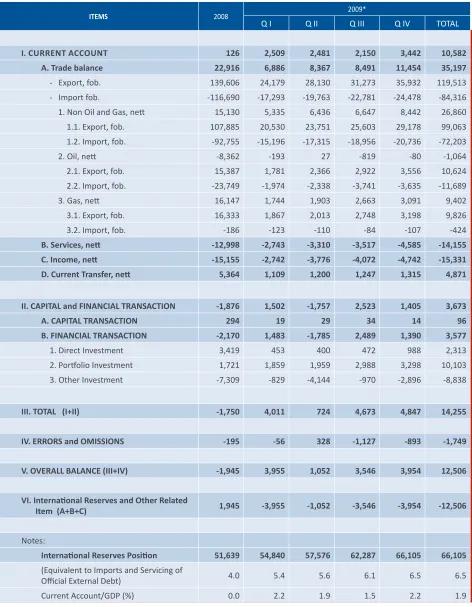
the current account recorded a 10.6 billion US dollar surplus, up considerably from 126 million US dollars in 2008 (Table 1.4). The increased current account surplus
resulted from strong exports, which despite contracion
from reduced global growth did not diminish to the same
extent as imports. A key factor in the export performance was demand for resource-based and paricularly mining products, which maintained posiive growth during the period of global economic contracion. Exports were
also bolstered by demand for manufactured goods near
the end of 2009 in response to the mouning pace of
economic recovery in advanced economies led by the US
and Japan. During this ime, imports slowed signiicantly in response primarily to falling domesic demand as the impact of lagging domesic economic growth took
hold. Imports also contracted from reduced demand for raw materials for export-oriented manufactured goods,
which normally have high imported content. For the year as a whole, the capital and inancial account posted
a 3.7 billion US dollar surplus despite coming under
considerable pressure from heavy private capital ouflows during Q1/2009 (Table 1.4). The posiive outcome in the capital and inancial account was partly explained by Bank Indonesia and Government policies in restoring the market conidence that subsequently encouraged renewed inlows of short-term capital beginning in Q2/2009.
Merchandise exports plunged in 2009 in line with the
powerful efects of global economic contracion. In
2009, these exports totalled 119.5 billion US dollar, or
a negaive growth of 14.4% compared to 2008. Growth turned negaive for both oil and natural gas exports and non-oil and gas exports. Oil and natural gas exports
underwent a 35.5% contracion from the 2008 levels
to 20.5 billion US dollars. The dominant factor driving down oil and natural gas exports was falling world oil prices. Calculated by the index for Indonesia’s oil exports, oil was down by 34%. Meanwhile, total non-oil and gas exports in 2009 slipped to 99.1 billion US dollars, Chart 1.12 Risk Percepion Indicators
Source: Bloomberg
bps percent
Yield Spread Global Bond RI vs US T-Note CDS of Indonesia (rhs)
EMBIG Spread
Table 1.4 Balance of Payment
millions USD
* Provisional Figures
ITEMS 2008 2009*
Q I Q II Q III Q IV TOTAL
I. CURRENT ACCOUNT 126 2,509 2,481 2,150 3,442 10,582
A. Trade balance 22,916 6,886 8,367 8,491 11,454 35,197
- Export, fob. 139,606 24,179 28,130 31,273 35,932 119,513
- Import fob. -116,690 -17,293 -19,763 -22,781 -24,478 -84,316
1. Non Oil and Gas, net 15,130 5,335 6,436 6,647 8,442 26,860
1.1. Export, fob. 107,885 20,530 23,751 25,603 29,178 99,063
1.2. Import, fob. -92,755 -15,196 -17,315 -18,956 -20,736 -72,203
2. Oil, net -8,362 -193 27 -819 -80 -1,064
2.1. Export, fob. 15,387 1,781 2,366 2,922 3,556 10,624
2.2. Import, fob. -23,749 -1,974 -2,338 -3,741 -3,635 -11,689
3. Gas, net 16,147 1,744 1,903 2,663 3,091 9,402
3.1. Export, fob. 16,333 1,867 2,013 2,748 3,198 9,826
3.2. Import, fob. -186 -123 -110 -84 -107 -424
B. Services, net -12,998 -2,743 -3,310 -3,517 -4,585 -14,155
C. Income, net -15,155 -2,742 -3,776 -4,072 -4,742 -15,331
D. Current Transfer, net 5,364 1,109 1,200 1,247 1,315 4,871
II. CAPITAL and FINANCIAL TRANSACTION -1,876 1,502 -1,757 2,523 1,405 3,673
A. CAPITAL TRANSACTION 294 19 29 34 14 96
B. FINANCIAL TRANSACTION -2,170 1,483 -1,785 2,489 1,390 3,577
1. Direct Investment 3,419 453 400 472 988 2,313
2. Porfolio Investment 1,721 1,859 1,959 2,988 3,298 10,103
3. Other Investment -7,309 -829 -4,144 -970 -2,896 -8,838
III. TOTAL (I+II) -1,750 4,011 724 4,673 4,847 14,255
IV. ERRORS and OMISSIONS -195 -56 328 -1,127 -893 -1,749
V. OVERALL BALANCE (III+IV) -1,945 3,955 1,052 3,546 3,954 12,506
VI. Internaional Reserves and Other Related
Item (A+B+C) 1,945 -3,955 -1,052 -3,546 -3,954 -12,506
Notes:
Internaional Reserves Posiion 51,639 54,840 57,576 62,287 66,105 66,105
(Equivalent to Imports and Servicing of
Oicial External Debt) 4.0 5.4 5.6 6.1 6.5 6.5
Table 1.5 Value of Non Oil and Gas Export by Sector FoB, millions USD
represening a negaive 8.2% growth compared to 2008.
The downturn in non-oil and gas exports resulted not
only from the contracion in global economic acivity,
but also falling prices for Indonesia’s non-oil and gas
export commodiies. The developments of 2009 point to
downward price movement for a wide range of Indonesian non-oil exports, with the steepest drop recorded for
agricultural commodiies at 24% (Chart 1.13). Falling prices for agricultural commodiies in turn caused export
revenues in the agriculture sector to contract by 6.6%. The
contracion in exports was ofset somewhat by the sill
robust demand for resource-based exports. During 2009,
the mining sector charted posiive 45.0% growth, partly on the back of coal exports that mounted by 33.6% (Table 1.5).
Based on the quarterly movement , the steepest decline in Indonesian exports took place in Q1 and Q2/2009. Oil and
natural gas exports in the two periods came to only 3.6
billion US dollars and 4.4 billion US dollars, respecively, with an average growth of negaive 54% (yoy) (Table 1.4). The dramaic contracion in oil and natural gas exports
during these periods was explained by world oil prices that plunged to a low of 39.0 US dollars per barrel. Alongside
this, non-oil and gas exports also contracted by 22.2% in Q1/2009 due to the global economic slowdown and low commodity prices. Exports began regaining momentum in
Q2/2009 in response to improving condiions in the global economy although annual growth remained negaive. Driving this improvement was the onset of signiicantly
rising global demand led by China and non-Japan Asia, in
addiion to the coninued downward trend in the US dollar. In addiion, price gains for some of Indonesia’s primary commodiies, beginning in Q2/2009, provided signiicant lit that brought improvement in export performance unil
the end of 2009 (Chart 1.13). Strengthening world demand enabled Indonesia’s non-oil and gas exports to resume
posiive growth in Q4/2009 at 17.6% (yoy).
However, imports contracted sharply due to tumbling
domesic demand. In 2009, merchandise imports reached 84.3 billion US dollars with a negaive growth of 27.7%, a markedly steeper drop compared to the 14.4% contracion
in merchandise exports. Imports contracted in both the oil and natural gas sector and the non-oil and gas products.
Oil and gas imports reached 12.1 billion US dollars,
tumbling 49.4% from levels reached in 2008 (Table 1.4). The drop in oil and gas imports resulted not only from
falling world oil prices and lagging domesic demand, but also the posiive impact of the government-sponsored kerosene to gas conversion programme. Similarly, non-oil
and gas imports (f.o.b.) reached 72.2 billion US dollars, down 22.2% from 2008 (Table 1.4). The sharp drop in non-oil and gas imports during 2009 produced a widening
in the growth diferenial between non-oil and gas exports
and non-oil and gas imports to pre-2008 levels (Chart
1.14). The correcion in merchandise import growth to pre-2008 levels was strongly inluenced by the steep drop
in imports of consumer goods and raw materials. In 2009, consumer goods and raw material imports contracted
32.0% and 27.4%, respecively, while the value of
imported capital goods (c&f) eased only 1% from 2008 to 20.6 billion US dollars (Table 1.6).
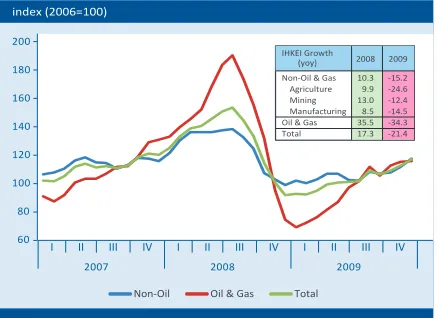
Chart 1.13 Indonesian Exports Price Index
index (2006=100)
Non-Oil Oil & Gas Total
IHKEI Growth
Value Share (%) Growth
% (yoy) Value Share (%)
Growth
% (yoy)
Total Export 107,885 100 15.8 99,063 100 -8.2
I. Agriculture 4,667 4.3 24.6 4,358 4 -6.6
II. Mining 13,695 12.7 10.2 19,859 20 45.0
The services and income account in the balance of
payments recorded an increased annual deicit of 29.5 billion US dollars (Table 1.4). The rise in the deicit was
related mainly to high expenditure components related to
freight services and repatriaion of proits by foreign direct
investment companies in Indonesia. Net payments on
freight again accounted for a sizeable deicit of 5.9 billion
US dollars, although somewhat less than in the preceding
year as a result of declining volume of trade. On the other
hand, tourism revenues slipped to a net 1.2 billion US dollars compared to the 1.8 billion US dollars recorded in
2008. Repatriaion of proits by FDI companies produced a deicit of 8.9 billion US dollars following improvements
in the performance of non-oil and gas mining companies. The current transfers account recorded another year of surplus, reaching 4.9 billion US dollars although down
from the preceding year. A key factor in this decline was lower remitances from Indonesian workers employed overseas, illustrated in the net reducion in worker remitances from 5.2 billion US dollars in 2008 to 4.9
billion US dollars.
The performance of the capital and inancial account in 2009 was signiicantly inluenced by short-term capital
lows movements driven by global inancial market players’ shits in risk percepions towards emerging
markets.14 Despite recording an overall 3.7 billion US dollar
surplus, the inancial account came under heavy pressure from the wave of private capital ouflows during Q1/2009 (Table 1.4). In Q1/2009, the drop in capital inlows was closely ied to heightened percepions of investment risk in Indonesia in line with global inancial market actors’ risk aversion towards the emerging markets. Amid the deleveraging process and strong risk percepions, capital inlows became less sensiive to the atracive interest rate diferenial. These condiions produced a substanial Q1/2009 deicit in net private capital inlows within the inancial account, recorded at 1.1 billion US dollars. The short-term capital ouflows originated from rupiah securiies, such as stocks, government securiies and Bank Indonesia Ceriicates (SBIs) (Chart 1.15). The potenial for a inancial account deicit was forestalled, as capital
14 Kurniai and Permata (2009) showed that the increase of investment
risk in inancial markets contributed approximately 23% of short term private capital lows in Indonesia. Discussion on this mater covered in Kurniai, Yai and Meily I. Permata (2009), ”External Volaility Transmission to the Indonesian Economy, ”Bank Staf Working Paper Indonesia, WP/07/2009, September
c&f, millions USD Table 1.6 Value of Non Oil and Gas Imports by Group of Comodiies
Chart 1.15 Foreign Capital Flows to Domesic Market Chart 1.14 Non-Oil & Gas Exports and Imports
millions of USD
Stock Goverment Bond Bank Indonesia Ceriicates (SBIs)
millions of USD millions of USD
Net Exports-Imports of Non-Oil & Gas Non-Oil & Gas Exports INon-Oil & Gas Imports
* Provisional Figures
Items
2008 2009*
Value Share (%) Growth
(%) Value Share (%)
Growth
(%)
Total Imports 100,933 100.0 40.4 78,554 100.0 -22.2
I.Consumpion Goods 9,061 9.0 25.1 6,162 7.8 -32.0
II.Raw Materials 70,425 69.8 39.5 51,151 65.1 -27.4
inlows from the issuance of government global bonds
was also recorded during the same period. At the end of
Q1/2009, the inancial account sill managed a surplus of
1.5 billion US dollars (Table 1.4).
The potenial for improvement in the inancial account
emerged during Q2/2009 in line with renewed
short-term capital inlows fuelled by more buoyant percepions among global inancial market actors. This was relected
in declining levels in the CDS, the EMBIG spread and swap premia. However, sizeable payments due on government
debt ipped the inancial account into a 1.8 billion US dollar deicit during Q2/2009. Permanent improvement in the inancial account did not occur unil the second
half of 2009. Among the factors bringing this change were
coninued short-term capital inlows from foreign investor buying rupiah instruments such as stocks, government securiies and SBIs. The second half of 2009 was marked by heavy foreign buying of government securiies and SBIs, raising the foreign ownership posiion in these
instruments to 11.3 billion US dollars and 4.7 billion US dollars in December 2009, or a 41.6% and 510.4%
increase over the end-2008 posiions. Furthermore, the inancial account surplus in the second half of 2009 also resulted from increased direct investment, paricularly
residents’ overseas investments, which recorded a Q4
surplus in comparison to the consistent deicits in previous
periods. This surplus was generated by issuance of foreign
currency bonds by private companies operaing through
overseas subsidiaries, with the funds from these issues then channelled into loans to their parent companies in Indonesia. Net direct investment in 2009 thus recorded a 2.3 billion US dollar surplus, less than in 2008.
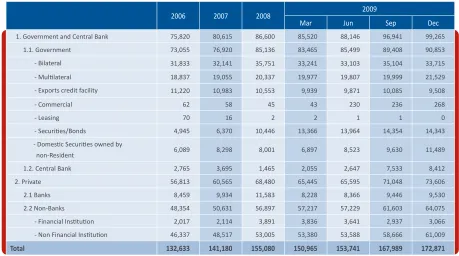
Responding to the various developments in the inancial account, Indonesia’s external debt posiion widened
11.5% in 2009 to 172.9 billion US dollars (Table 1.7).
Increases were recorded in both oicial and private external debt at 6.7% and 7.5%, respecively. Private sector external borrowing was fuelled by non-bank private (corporaion) borrowing that mounted 12.6% compared to
2008 reaching 64.1 billion US dollars by end-2009. Much
of the increase in private external borrowing took place in
the second half of 2009, due to a surge in corporate bond issues. In 2009, global corporate bond issues reached 4.3 billion US dollars, up considerably from 1.6 billion US dollars in 2008.
The balances in the current account and capital and
inancial account produced an overall 12.5 billion US
dollars balance of payments surplus for 2009, well ahead
the 1.9 billion US dollars balance of payments deicit in
2008. The balance of payments outcome for 2009 as a
whole was markedly diferent from the concerns that had
Table 1.7 Indonesia’s Foreign Debts
millions USD
2006 2007 2008 2009
Mar Jun Sep Dec
1. Government and Central Bank 75,820 80,615 86,600 85,520 88,146 96,941 99,265 1.1. Government 73,055 76,920 85,136 83,465 85,499 89,408 90,853
- Bilateral 31,833 32,141 35,751 33,241 33,103 35,104 33,715
- Mulilateral 18,837 19,055 20,337 19,977 19,807 19,999 21,529 - Exports credit facility 11,220 10,983 10,553 9,939 9,871 10,085 9,508
- Commercial 62 58 45 43 230 236 268
- Leasing 70 16 2 2 1 1 0
- Securiies/Bonds 4,945 6,370 10,446 13,366 13,964 14,354 14,343
- Domesic Securiies owned by
non-Resident 6,089 8,298 8,001 6,897 8,523 9,630 11,489
1.2. Central Bank 2,765 3,695 1,465 2,055 2,647 7,533 8,412
2. Private 56,813 60,565 68,480 65,445 65,595 71,048 73,606
2.1 Banks 8,459 9,934 11,583 8,228 8,366 9,446 9,530
2.2 Non-Banks 48,354 50,631 56,897 57,217 57,229 61,603 64,075
- Financial Insituion 2,017 2,114 3,891 3,836 3,641 2,937 3,066
- Non Financial Insituion 46,337 48,517 53,005 53,380 53,588 58,666 61,009
emerged early in the year, with the balance of payments
projected to run a 2.8 billion US dollar deicit.15 Following these developments, the internaional reserves posiion at end-December 2009 reached USD66.1 billion, equivalent to 6.5 months of imports and servicing of oicial
external debt. At this level, reserves were well above
the conservaive IMF calculaion of about 3-4 months of imports or the peer naion average at 5.0 months of imports. Furthermore, the internaional reserves posiion
was double the total short-term foreign debt burden and
5.7 imes the oicial short-term external debt posiion.
g
The Financial Market
Indonesia’s inancial market performance was heavily inluenced by the dynamics of the global inancial system. Heavy pressures bearing down on the domesic inancial market in Q4/2008 carried over into Q1/2009. These pressures impacted across all markets, including the stock market, government securiies market, rupiah money market and forex market. For the most part, the pressures on the domesic inancial market during the two quarters were inluenced by stronger percepions of investment risk on emerging markets, as demonstrated in the rise in various risk indicators. This diminished the low of short-term capital into emerging markets, including Indonesia, which then broadly impacted performance on the markets for stocks, government securiies, rupiah and forex (for an analysis of inancial market pressures during the two quarters, see Box 1.1 Policy Response During the Global Financial Market Turmoil).
15 Preliminary esimates of the Indonesian economy in 2009 covered in
the Bank Indonesia Economic Report 2008
On the stock market, the sill heightened market percepions in Q1/2009 of investment risk in emerging markets, including Indonesia, coninued to weigh on market performance. During this period, the JSX
Composite Index steadily lost ground to reach a low of
1,256 points in early March 2009 as foreigners oloaded stocks on the Indonesian Stock Exchange (Chart 1.16). Trading volume also fell signiicantly to Rp 1.57 trillion
per day from the 2008 average of Rp 3.99 trillion per day.
Stock market performance began to pick up in Q2/2009 upon renewed growth in investor conidence, with
the trend carrying through to the end of 2009. These
condiions paved the way for capital inlows that in turn strengthened the JSX Composite Index to about 2,349 on
trading similar to pre-Q3/2009 levels. The growing foreign
acivity in the inancial market followed by domesic actors spurred JSX index growth since Q2/2009, with
the index closing the year at 2,534. This represents a steep ascent when compared to 1,355 at end-2008, as
well as the highest gain posted by stock markets in Asia. The resurgence of the stock market was also bolstered by increased trading acivity with average share trading
volume climbing to Rp 3.99 trillion per day for the overall 2009. The dominant sectors driving share price gains were primary commodity-based sectors such as mining and
plantaion. The performance of these primary sectors was closely linked to the trend in internaional market
commodity prices since Q2/2009.
The government securiies market also moved in tandem with the stock market, which plunged sharply during Q1/2009. With sill heightened risk percepions during that period, net capital inlows to government securiies in all tenors during Q1/2009 remained negaive (Chart 1.17).
Chart 1.16 JCI and Net Foreign Buying Chart 1.17 Yield & Net Foreign Buying/Selling
of Government Bond
As a result, the government securiies price index tumbled to 81.32 in March 2009. Falling prices for government securiies also widened yield on all tenors with average government securiies yield in February 2009 touching as high as 12.7%. Turnover in government securiies trading
during that period also dropped to about Rp 79.9 trillion, compared to Rp 105.5 trillion before the global economic
downturn. Performance on the government securiies market showed renewed improvement in Q2/2009 in line with improving risk percepions that subsequently had a posiive inluence on foreign capital inlows. In response, the government securiies price index improved
to 94.37 at end-2009 or up 6.98% from the end of 2008.
This posiive development also led to improved yield on government securiies in all tenors (Chart 1.18). During
2009, the average monthly prices for medium and long
tenor government securiies mounted signiicantly by
1,362 bps (up 13.98%) and 1,632 bps (a rise of 18.83%). By comparison, prices on short tenors climbed only 407 bps (up 4.03%). Average trading volume in government
securiies also fell to Rp 3.39 trillion per day, which
compares to the 2008 average at Rp 4.49 trillion per day.
Corporaions took advantage of the improving performance on the government securiies market to issue bonds. The decline in government securiies yield, frequently used as a benchmark in bond issues, encouraged companies to issue bonds to inance business aciviies. An added factor in the surge in corporate bond issuances was the drive to secure inancing sources, which could potenially become less available due to the large
numbers of bonds reaching maturity and sluggish credit
growth in 2009. Against this background, corporate bond
issues mounted by 18.4% during 2009 to Rp 175 trillion.
Similarly, market capitalisaion also widened by 37.3%
over 2008.
The developments of these foreign capital lows in the stock market and government securiies market and changes in the foreign porfolio holdings of SBIs in turn inluenced the rupiah value in the forex market. In Q1/2009, the sill heavy exodus of foreign capital from stock, government securiies and SBI porfolios placed
sustained heavy pressure on the rupiah. The prolonged
high uncertainies prompted forex market paricipants to hold US dollars, producing a liquidity crunch on the domesic forex market. Forex market liquidity then ightened further due to the rise in counterparty risk among market paricipants and paricularly with foreign banks. These condiions sent forex market trading volume
tumbling from a monthly average of 2,799 billion US dollars to 1,323 billion US dollars during Q1/2009 (Chart
1.19). Tight liquidity and thin forex transacion volume also produced a widening in the rupiah bid-ofer spread to
about Rp 100 from the approximately Rp 10 norm before September 2008.
As a whole, the uncertainty and risk percepions on the forex market put considerable pressure on the rupiah
during Q1/2009. The rupiah touched a low of Rp 12,020 to
the US dollar in early March 2009, a ime also marked by increased volaility (Chart 1.20). The correlaion between risk and exchange rate movement was seen in the parallel movement between the rupiah and various risk indicators such as CDS and yield spread (Chart 1.21). The correlaion
between CDS and the exchange rate mounted to about 0.8 during 2008-March 2009 from about 0.6 in the 2006-2007
period. In contrast, the correlaion between the interest
Chart 1.19 Trade Volume in Forex Market Chart 1.18 Yield of Government Securiies
millions of USD millions of USD
Average Monthly Forex Trading Volume
Average Ouflow Volume of Foreigner (rhs)
Source: Bloomberg
100 bps percent
rate diferenial and the exchange rate was negaive at about 0.7 during the crisis period, indicaive of the magnitude of foreign investors risk aversion despite the steep interest rate diferenial at the ime (Graph 1.21).
Bank Indonesia responded to this adverse development
in Q1/2009 with a measured policy for stabilising the
exchange rate by ensuring adequate levels of liquidity in the domesic forex market. This policy response successfully curbed expectaions of excessive depreciaion amid the mouning uncertainty. The current account surplus, a fundamental factor, also kept the rupiah from steeper decline. At the same ime, posiive seniment on the global inancial market that had surfaced from
the middle to end of March 2009 eased downward
pressure on the rupiah throughout Q1/2009. Posiive seniment also emerged in relaion to improved external resilience ater the sale of the Government of Indonesia
Global Medium Term Notes (GMTN) and the impact of increases in the BSA commitment with Japan and the Bilateral Currency Swap Arrangement (BCSA) with China.
These developments converged to weaken the rupiah 5.7% during Q1/2009, a comparaively modest rate of depreciaion compared to the inal quarter of 2008 when
the rupiah plunged 15.5%. These developments were also
accompanied by reduced volaility in the rupiah.
The rupiah exchange rate resumed an appreciaing trend in Q2/2009 on the strength of improving risk percepions of emerging markets and the secure condiion of
domesic fundamentals. Opimism over global economic recovery combined with the secure condiion of domesic
fundamentals provided impetus for steady growth in forex
supply from foreign investors in the domesic inancial
market. Further support for the strengthening of the rupiah came from the coninued surplus in the current
account. In response to these developments, the rupiah closed 2009 at Rp 9,425, having appreciated 18.4% from
the end-March 2009 posiion (Chart 1.20). Accompanying the rupiah gains was renewed growth in forex market
trading volume (Chart 1.19). Added to this, the buy/sell
spread on the rupiah fell back to a normal Rp 10 with the easing of counterparty risk on the forex market. Measured
for the year as a whole, the rupiah closed 2009 at a level
15.7% higher than end-2008. Despite the appreciaing trend, the level of the rupiah coninued to support Indonesia’s export compeiiveness.
The inluence of uncertainies related to global inancial market risks subsequently spilled over on to the rupiah money market. The uncertainies of Q4/2008 carried over into Q1/2009, along with increased counterparty risk on the interbank money market. The supply of interbank funds from banks holding excess liquidity also ightened. Instead, banks preferred to place funds in central bank monetary instruments such as SBIs and the Bank Indonesia Facility (FASBI) even in spite of the aggressive lowering of the BI Rate during Q1/2009. The overall efect of these condiions was to carry forward the Q4/2008 decline in overnight interbank transacion volume into early Q1/2009. Reinforcing this were the wide variaions in distribuion of liquidity among interbank market paricipants.
The issues of Q4/2008 that spilled over into Q1/2009
caused some banks to face increased counterparty risk, mainly from foreign bank branch oices (FBBOs) and small-scale banks. FBBOs, tradiionally a channel for
Chart 1.21 Risk Premium, UCIP, CDS, and Exchange Rate Chart 1.20 Rupiah Exchange Rate: Level and Volaility
Source: Bloomberg
bps Rp/USD
CDS Risk Premium UCIP Exchange Rate (rhs)
percent Rp/USD
Daily Rates
inlows of foreign capital and also net borrowers on the interbank money market, saw their rupiah liquidity needs soar due to the high volume of capital ouflows as foreign
investors withdrew funds.16 However, inancial woes experienced by the parent banks in other countries meant that local banks, tradiionally net lenders on the interbank money market, had to reassess their credit lines and credit limits. As a result, the FBBOs found themselves in diiculty accessing funds on the interbank money market. In similar developments, small banks carrying substanial risk due to the scale of their banking business were impacted by the heightened risk aversion among interbank market paricipants.
Risks on the rupiah money market that carried over into Q1/2009 were relected in various interbank market indicators. Interbank transacion volume at end-January
16 Because some of them act as a standby buyer
2009 was sill low at about Rp 6 trillion compared to the normal average at about Rp 13 trillion, due to the efect of these heightened risks (Chart 1.22). Similarly, end of day liquidity in the interbank money market narrowed further in Q1/2009. The number of interbank market paricipants also fell from an average of 98 banks to 61 banks (Chart 1.23). This coincided with increased segmentaion in the interbank market that widened the diferenial between the highest and lowest overnight interbank rates. In further developments, liquidity risk between tenors also deteriorated as illustrated in the spread for the 1-week to 6-month JIBOR over the overnight rate that climbed to 136
bps, compared to the normal level of 63 bps (Chart 1.24).
The various issues on the interbank money market eased during Q2/2009 as uncertainies on inancial markets began to recede and the posiive impact from monetary relaxaion gathered momentum. The diminished
uncertainies on the rupiah money market were to a large extent the result of posiive impact from the improving global economic outlook that eased counterparty risk in dealing with FBBOs and small-scale banks. With lower risks, transacion volume then recovered to around pre-crisis levels at Rp 13 trillion, also relected in total liquidity and number of paricipants in the interbank money market. Posiive impact was also visible in the narrowing of the spread for the 1-week to 6-month JIBOR over the
overnight rate to the pre-crisis level of 56 bps.
g
The Banking System
Domesic inancial market risk contributed to increased market risk in the banking industry. Although contained within safe limits, market risk surged during Q1/2009 in
Chart 1.24 JIBOR and O/N Interbank Rates percent
1 week - O/N 1 month - O/N 3 months - O/N 6 months - O/N
Chart 1.23 O/N Interbank Transacion Volume and Paricipants Chart 1.22 Interbank Average Transacion Volume
Interbank Transacion Volume Number of Bank Paricipants
bank Paricipants trillions of rupiah
trillions of rupiah