IJG Vol. 45, No.2, December 2013 (101 - 115) © 2013 Faculty of Geography UGM and The Indonesian Geographers Association
SPATIAL - TEMPORAL ANALYSIS OF URBAN HEAT
ISLAND IN TANGERANG CITY
Adi Wibowo [email protected]
Faculty Mathematics and Natural Science, University of Indonesia
Andry Rustanto [email protected]
Faculty Mathematics and Natural Science, University of Indonesia
ABSTRACT
Urban Heat Island (UHI) is a phenomenon which is affected by human activities. Land use change by human activities, expressed by urbanization that means rural or suburban areas changed to urban areas. This study is intended to identify the UHI phenomena in Tangerang city. To answer the aim of this research,temperature data is collected (direct and indirect data). Direct collection for air surface temperature conducted by surveying some location collect in 24 hour period (April 2012) and another location by rapid 10 – 15 minute in day time (April, July, August and September 2012). This technique employed mobile temperature and humidity tools. Secondary air surface temperature data (24 hour period) during 2009-2012 also use in this study. Indirect data employed Landsat TM only two year data 2001 and 2012 for land surface temperature. Satellite data employed to identify land cover change to get information about land use change. The result shown that the temperature condition, both air surface and land surface temperature, were changed. UHI phenomenon in Tangerang City indicated by temperature higher than 300C. Based on land surface temperature, UHI phenomenon in 2001 already occurred at small area. UHI phenomenon in 2012 almost covered the Tangerang City area. UHI Index in 2009 is 3.60C, in 2011 is 1.50C and then 2012 become 1.20C. This study concludes that UHI phenomena found since 2001 and trend of UHI Index AST since 2009 with average UHI Index AST of 20C. UHI Index LST in 2001 is 9.780C and 2012 is 13.960C
Key words: urban heatisland phenomena, land cover changes.
ABSTRAK
Urban Heat Island adlaah sebuah fenomena yang disebabkan oleh aktifias manusia. Perubahan penggunaan tanah akibat dari aktifitas manusia digambarkan dengan urbanisasi, yang berarti pedesaan atau daerah peralihan desa kota menjadi perkotaan. Penelitian ini bertujuan untuk identifikasi fenomena UHI di Kota Tangerang. Untuk menjawab tujuan penelitian ini digunakan pengumpulan data suhu (pengumpulan data secara langsung dan tidak langsung). Pengumpulan data langsung untuk suhu udara permukaan dengan survey, beberapa lokasi diambil selama 24 jam (April 2012) dan beberapa lokasi lainnya dengan pengambilan data cepat selama 10-15 menit pada siang hari (April, Juli, Agustus dan September 2012). Teknik ini mengunakan alat pengukuran suhu dan kelembaban. Data sekunder suhu udara (24 jam) selama 2009-2011 juga digunakan. Pengumpulan data tidak langsung menggunakan data Landsat TM yang terdiri dari dua tahun, yakni 2001 dan 2012 untuk menghasilkan suhu permukaan tanah. Data satelit digunakan untuk identifikasi perubahan data tutupan lahan sebagai indikasi perubahan penggunan tanah. Hasil penelitian menunjukkan keadaan temperatur, baik temperatur suhu udara dan suhu permukaan tanah terjadi perubahan. Fenomena UHI di Kota Tangerang terindikasi dengan temperatur lebih dari 300C. Berdasarkan suhu permukaan tanah, fenomena UHI pada tahun 2001 telah terjadi pada area yang tidak luas. Fenomena UHI tahun 2012 terjadi hampir menutupi seluruh Kota Tangerang. UHI Index di tahun 2009 adalah 3.60C, pada tahun 2011 adalah 1.50C dan kemudian pada tahun 2012 menjadi 1.20C. Kesimpulan dari penelitian iniadalah fenomena UHI sudah terdapat sejak tahunn 2001 dan tren UHI Index Suhu Udara Permukaan sejak tahun 2009 dengan UHI Index rata-rata 20C tiap tahun. Sedagkan UHI Index Suhu Permukaan Tanah pada tahun 2001 adalah 9.780C dan pada tahun 2012 adalah 13.960C.
Indonesian Journal of Geography, Vol 45, No.2, December 2013 : 101 - 115
INTRODUCTION
The Intergovernmental Panel on Climate Change (IPCC) Fourth Assessment Report (AR4) has reported that global tempe-ratures have risen about 0.74 0C since the beginning of the 20th century [Malaysian Meteorological Department, 2009]. This report also gives an indication of the impact of increasing global temperature to urban area conditions, especially urban heat island. Even though studies related to urban heat Island already conducted by so many researchers in the past-since Howard in 1818 [Parham and Haghighat, 2010], cases of urban heat island (UHI) are increasing as a consequence of urbaniza-tion and raising global temperature [Oke, 1981 in Parham and Haghighat, 2010]. UHI is a phenomenon where air tempe-ratures in densely built-up areas inside a city are higher than the suburban rural areas [Wong and Yu, 2005]. It also known as a phenomenon of rising temperature in urban settings and urban area [Ichinose et al., 2008; Kim and Baik, 2005]. UHI is a mutual response of many environmental and manmade factors and has not been fully explored [Memon et. al., 2009].
Cases of UHI in Indonesia, as representa-tion of tropical cities, has been studied by Tursilawati in 2008 as researcher from Indonesian National Aerospace (LAPAN). The study conducted especially in major Indonesian cities, namely Bandung, Sura-baya, Semarang and Jakarta by employing Landsat (Land Satellite) data. Result shown that there is growing urban area in Bandung-which annually-of about 1,029 ha (0.36%), Semarang 1,200 ha (0.83%) and Surabaya 531.28 ha (1.69%). Urban Heat Island (high temperature 30-350C) spreading is located in the downtown area, about 12,606 ha or 4.47%, Semarang 12,174 ha or 8.4%, Surabaya 1,512 ha or 4.8% in annual basis. UHI in Jakarta also conducted using Landsat estimation, in which UHI spatially found to be centra-lized in downtown areas and spreading to
the surrounding area. In both 1989 and 2002, distribution of UHI that indicated by high surface temperature (upper than 30 °C) is identified at the central area of the city where buildings, roads, parking areas, and other non-vegetation surface types are dominant. The UHI area at the time of satellite passed in 1989 is around 8,453 ha, but in 2002 expanded to about 56,834. On the other hand, lower temperatures are found over vegetated areas (suburban) and water body areas. Comparison of Ts (temperature estimation) distribution between 1989 and 2002 shows that the urban development during those 13 years has caused significant increase in the surface temperature. The increase is not limited to the central part of the city, which has flat topography, but spreading to the southern-hilly part as well [Tursilawati et. al., 2012].
THE METHODS
To answer the aim of this research, temperature data obtained from direct and indirect data collections are used. The research data is including direct air surface temperature and indirect data for land use and temperature change. Data which are collected in this research mainly consist of field survey data, maps, tabular data, and satellite imageries from the study area.
SPATIAL - TEMPORAL ANALYSIS Adi Wibowo, Andry Rustanto
Secondary data air surface temperature during 2009-2012 from Environmental Bureau of Tangerang City used for collecting 24 hour data (data collected for one week within a month, covering 50 air quality samples location). Sampling of temperature conducted based on several categories, including residential areas, central business or administration areas, bus stations, and industrial areas. Sample locations are selected based on Suzuki [2008], who measured UHI in Japan. The sampling sites were located in 2.5 km grids in the central part of Tokyo and 5 km grids in the surrounding area. The grid sizes were determined by the spatial representative of land cover/land use. Air surface temperature data measured using Hioki 3641 device, with specification consists of two channels. Range of temperature measurement is about -20.00C to 70.00 C. The range of internal tempe-rature sensor and humidity measurement is about 0.0% - 100% for relative humidity (rh) sensor. The device temperature accuracy is + 0.50C (at 0.0 to 35.00C) and humidity accuracy is = + 5% (at 250C).
Indirect data obtained from Landsat ETM+ P122R064 (imageries captured at 15/07/2001 and 26/06/2012). Both two year data in 2001 and 2012 used for land cover/land use change and land surface temperature identification [Hernina et al., 2008; Tursilawati, 2008; Mallick et. al., 2008; Mallick et. al., 2012; Tursilawati et al., 2012]. Supervised method for land cover identification conducted based on land use data in 2005. Land Use data in 2005 is used according to Shidiq [2009]. equation from Tursilawati et. al., [2012] used for land surface temperature estimation:
Lλ=((LMAXλ-LMINλ
)/(QCALMAXMIN)))*-(QCAL–QCALMIN)+LMINλ………(1.1)
Where Lλ = spectral radiance (wm-2sr-1ȝm
-1
), QCAL = digital number value at band i, LMINȜ= minimum value of spectral
radiance at band i (wm-2sr-1m-1), LMAXȜ = maximum value of spectral radiance at band I (wm-2sr-1m-1), QCALMIN = the minimum quantized pixel value (typically DN equal to 1) corresponding to LMINȜ, QCALMAX = the maximum quantized calibrated pixel value (typically DN = 255) corresponding to LMAX.Spectral radiance conversion to temperature [Hernina et al., 2008; Tursilawati et. al., 2012] with equation:
T=K2/ln ((K1/Lλ) +1)………..(1.2)
Where T is the temperature obtained from satellite sensor (Kelvin), K1 is the calibration constant 1 for Landsat TM (607.76 wm-2sr-1m-1) and Landsat ETM+ (666.09 wm-2sr-1m-1), K2 is the calibration constant 2 for Landsat TM (1260.57 K) and Landsat ETM+ (1282.71 K), and Lλ is the spectral radiance from the 6th band [Tursilawati et. al., 2012]. The last process is conversion from Kelvin to Celsius, using equation:
Temp-CELCIUS = Temp-KELVIN - 272.15 = T – 272.15……….(1.3)
The derivation of UHI value is done by using a simple formula [Wataru and Noorazuan, 2010] equation 1.4. UHI= Urban Heat Island Intensity, max=maxi-mum value of LSTu, min=minimax=maxi-mum value of LSTr, u=urban point and r=rural point.
UHI = max (LSTu) – min (LSTr)………(1.4)
UHI phenomenon uses temperature upper than 300C to identify UHI phenomena of Air Surface Temperature and Land Surface Temperature. UHI is compare temperature in urban and surrounding area (rural) called UHI Index. UHI Index basically used Temperature Urban Max – Tempe-rature Rural Min. This study uses rature average from total sample air tempe-rature. UHI index uses equation:
Indonesian Journal of Geography, Vol 45, No.2, December 2013 : 101 - 115
UHI Index=UHI Index AST, Tmax-p= Temperature maximum in sample location, T-avg=Temperature average from total temperature sample location. If in one location UHI Index is higher than 50C, it means that the location represent rural than UHI Index near 10C (urban area). If UHI negative, it means that location maximum temperature lower than average tempe-rature. UHI variation depends on spatial (location) and temporal data coverage. Final analysis conducted by generateing map of GIS modelling for UHI phenome-non (spatial and temporal) and UHI Index for identifying UHI phenomena in Ta-ngerang.
RESULT AND DISCUSSION
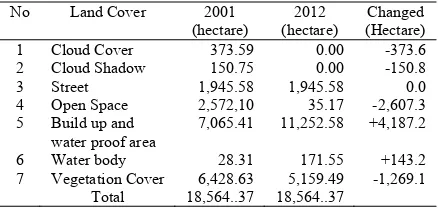
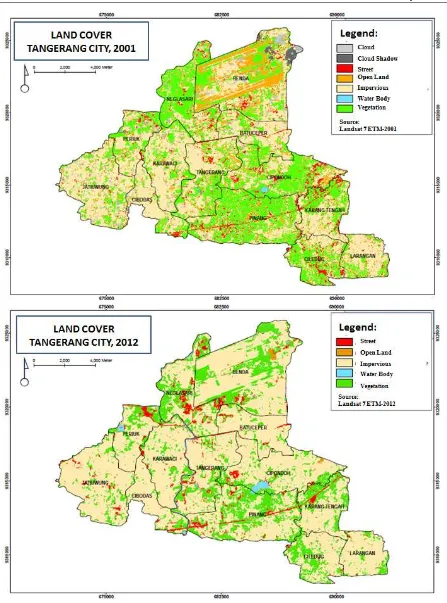
Land Cover and Land Use Change Based on land cover change data in Figure 1, the area has been classified to street, open space, build up and impermeable area, water body, vegetation cover, cloud cover and cloud shadow. Build-up and permeable areas changed from 7,065.41 ha in 2011 to 11,252.58 ha in 2012 (increa-sing to +4,187.17 ha). Detailed land cover change is shown in Table 1.
Table 1. Land Cover Change 2001-2012
No Land Cover 2001
Source: Image Analysis, 2001 and 2012
Generally, land cover change generates negative impacts, but in special condition has positive value. For example, the artificial lake in the study area, known as Situ Pondoh, became larger than earlier in 2001. Vegetation cover also changed, but not as larger as open space, build-up and impermeable area. Green area almost observed at wide area in south area of
Tangerang, bigger than green area in the west, south and north area of Tangerang. Land cover changed in accordance with land land use, which represent equal con-dition. For example, there are many locations that changed from natural land area (open space, vegetation cover) to build-up area (building, street, and imper-meable area). Interestingly, a water body in the study area, called Lake Cipondoh, was getting larger in 2012 compared to 2001. (Figure 2).
Spatial-Temporal Air Surface Tempe-rature (AST) in 2012
SPATIAL - TEMPORAL ANALYSIS Adi Wibowo, Andry Rustanto
Indonesian Journal of Geography, Vol 45, No.2, December 2013 : 101 - 115
Figure 2. Sample Land Cover Change 2001-2012 and Land Use Change 2002-2012
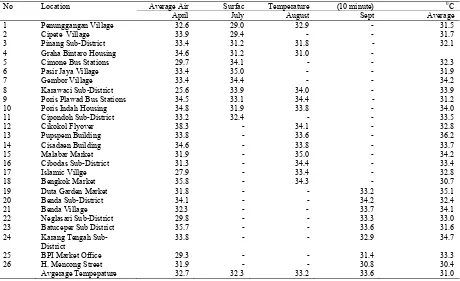
Table 2. Air Surface Temperature at Tangerang City in 2012
No Location Average Air Surfac Temperature (10 minute) 0C
April July August Sept Average
1 Penunggangan Village 32.6 29.0 32.9 - 31.5
2 Cipete Village 33.9 29.4 - - 31.7
3 Pinang Sub-District 33.4 31.2 31.8 - 32.1
4 Graha Bintaro Housing 34.6 31.2 31.0 -
5 Cimone Bus Stations 29.7 34.1 - - 32.3
6 Pasir Jaya Village 33.4 35.0 - - 31.9
7 Gembor Village 33.4 34.4 - - 34.2
8 Karawaci Sub-District 25.6 33.9 34.0 - 33.9
9 Poris Plawad Bus Stations 34.5 33.1 34.4 - 31.2
10 Poris Indah Housing 34.8 31.9 33.8 - 34.0
11 Cipondoh Sub-District 33.2 32.4 - - 33.5
12 Cikokol Flyover 38.3 - 34.1 - 32.8
13 Pupspem Building 33.8 - 33.6 - 36.2
14 Cisadaen Building 34.6 - 33.8 - 33.7
15 Malabar Market 31.9 - 35.0 - 34.2
16 Cibodas Sub-District 31.3 - 34.4 - 33.4
17 Islamic Villge 27.9 - 33.4 - 32.8
18 Bengkok Market 35.8 - 34.3 - 30.7
19 Duta Garden Market 31.8 - - 33.2 35.1
20 Benda Sub-District 34.1 - - 34.2 32.4
21 Benda Village 32.3 - - 33.7 34.1
22 Neglasari Sub-District 29.8 - - 33.3 33.0
23 Batuceper Sub District 35.7 - - 33.6 31.6
24 Karang Tengah Sub-District
33.8 - - 32.9 34.7
25 BPI Market Office 29.3 - - 31.4 33.3
26 H. Mencong Street 31.9 - - 30.8 30.4
Avgerage Tempepature 32.7 32.3 33.2 33.6 31.0
SPATIAL-TEMPORAL ANALYSIS Adi Wibowo, Andy Rustanto
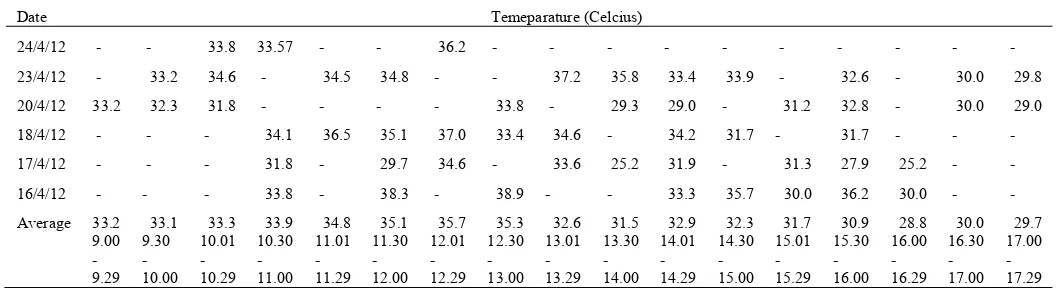
Detailed time series of air surface temperature for day time in Tangerang city, for example in April 2012, is shown in Table 3 and Figure 3. Table 3 explained dynamic of air surface temperature start in 9.00-9.29 a.m. The temperature is already reached 33.20C, and became maximum 35.70C for day time in 12.00-12.29 Then, temperature going down 29.00C in 05.00-05.29 pm. This result gave another perspective about UHI phenomenon in day time. In day time of April 2012 (since 9.00 am until 04.00 pm), air surface temperature were higher than 300C, meant that UHI phenomena has occurred in Tangerang city (temporaly during day time).
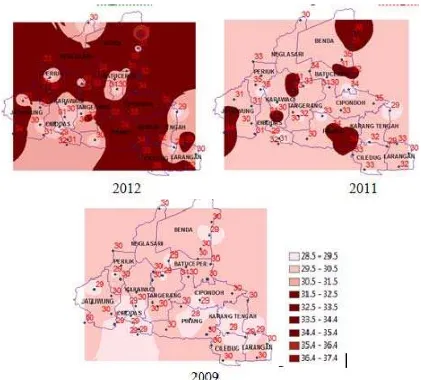
Spatial-Temporal Maximum, Minimum and Average of AST (2009, 2010, 2011, 2012)
Distribution of urban temperature for detecting the UHI phenomenon shown in Figure 4.
The maximum temperature of urban temperature >300C started from 2009 until 2012, almost of Tangerang area was higher than 300C. Even though the temperature each year was not increasing compared to the previous year since there were many variation in the temperature during that period, the trend is still positive. For example in Benda sub-district, first location indicated that maximum air surface temperature in 2009 is 330C, in 2011 is 320C and in 2012 is 340C. The maximum temperature at second location in 2009 is 330C, in 2011 is 340C and in 2012 is 380C. Other example in Tangerang sub-district also indicated that the maximum AST trend is positive. Maximum temperature at first location in 2009 is 320C, in 2011 is 320C and in 2012 is 330C. The temperature at second location in 2009 is 330C, in 2011 is 330C and in 2012 is 340C.
Date Temeparature (Celcius)
24/4/12 - - 33.8 33.57 - - 36.2 - - - - -
Table 3. Air Surface Temperature at Tangerang City in April 2012 Figure 3. Air Surface Temperature of Tangerang City at Daytime in April 2012
Indonesian Journal of Geography, Vol 45, No.2, December 2013 : 101 – 115
Figure 4. Maximum Air Surface Temperature in Tangerang City (in 2009, 2011 and 2012)
SPATIAL-TEMPORAL ANALYSIS Adi Wibowo, Andy Rustanto
Distribution of minimum AST in Tange-rang is shown in Figure 6. The minimum temperature in Tangerang is 220C (2011) to 250C (2012). For example, first loca-tion in Benda sub-district indicated mini-mum air surface temperature of 240C in 2009, and 280C in 2012. The second lo-cation minimum temperature in 2009 is 260C, and in 2012 is 280C. Other example is Tangerang sub-district, which also indi-cated the minimum AST trend is positive. The first location temperature in 2009 is 260C, and in 2012 is 300C, while the se-cond location temperature in 2009 is 270C, and in 2012 is 280C.
Distribution of average temperature is shown in Figure 6. The minimum average temperature in Tangerang city is 260C (2010) and maximum average temperature is 380C (2012). In Benda sub-district, Observation at first location indicated that average air surface temperature in 2009 is 29.50C, in 2011 is 32.50C and in 2012 is 37.50C The second location maximum temperature in 2009 is 29.50C, in 2011 is 29.50C and in 2012 is 380C. Tangerang sub-district also indicated positive trend of average AST. The temperature at first location in 2009 is 290C, in 2011 is 310C and in 2012 is 32.50C. The second location temperature in 2009 is 29.50C, in 2011 is 290C and in 2012 is 320C.
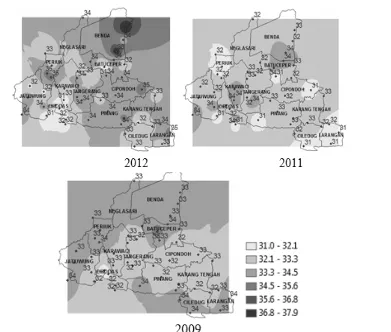
Land Surface Temperature (LST) Another way to understand UHI phe-nomenon in the sudy area conducted by using satellite image data from Landsat ETM+ through Land Surface Temperature (LST). LST is temperature estimation from land cover, in this case, obtained in 2001 and 2012. Result of LST is then validated with temperature data from sample loca-tions and weather staloca-tions (near or include the area of study). Spatial distribution of LST at Tangerang city in 2001 is shown Figure 7, The LST is about 17.70C until 31.80C. The LST with temperature cate-gory 24-280C is most dominant than temperature of 21.2 – 24.70C, and
temperature 28.3 – 31.80C. The LST covering small area is temperature cate-gory of 17.7-21.20C. For those area, va-lidation taken by sample locations for air surface temperature. LST with temperature upper than 28.010C were distributed in Tajur housing area and Ciledug sub-district. Minimum LST with temperature less than 24.120C were distributed in Kelapa Indah sub-sub district and Tangerang sub-district. Average LST in 2001 is 26.230C.
The LST in July 26, 2012 (Figure.7) shown that condition of temperature in Tangerang city with dominated by temperature higher than 28.30C and maximum temperature of 31.00C. The LST with minimum tempe-rature less than 220C still shown, with dominant minimum temperature is 26.60C. This condition indicated that during 10 years period (2001-2012), the trend of urban temperature increasing very fast (average + 30C/10 years, or 0,30C/year).
Urban Heat Island Phenomenon UHI phenomenon for AST
The UHI phenomenon in Tangerang City is indicated by temperature higher than 300C that occurred since 2009. It means the UHI phenomenon occurred in Tange-rang city by day time and night time. therefore it is almost 24 hour occurred Tangerang city. Validation of this condi-tion conducted by comparing with weather stations in Tangerang City. Ciledug and Pondok Betung shown that UHI phenome started in 1979 at Pondok Betung and Ciledug started in 1983, based on maxi-mum temperature. Two weather stations shown UHI phenomena still happen in 2006 (Pondok Betung) and 2008 (Cile-dug). (Figure 8).
Indonesian Journal of Geography, Vol 45, No.2, December 2013 : 101 - 115
condition validated by maximum average of Air Surface Temperature (AST) in Tangerang City, which is 320C. This temperature is based on a survey conduct-ed by Environmental Bureau of Tangerang City from 2009 until 2012 (Table 4). The
trend of maximum temperature is 0.50C/year, or 20C/four years. This condi-tion is in line with thr positive trend of UHI phenomenon for maximum AST since 2009 to 2012.
Figure 6. Average Air Surface Temperature in Tangerang City (2009, 2011 and 2012)
2001 2012
SPATIAL-TEMPORAL ANALYSIS Adi Wibowo, Andy Rustanto
Figure 8. Air Surface Temperature in Weather Station Laid on Tangerang City.
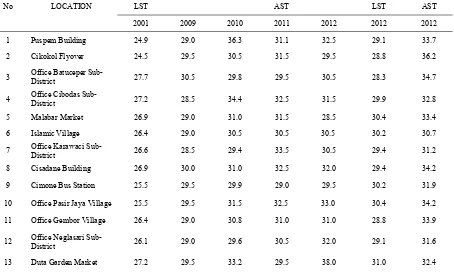
Table 4. Urban Temperature Change in Tangerang City (2001-2012)
No LOCATION LST AST LST AST
2001 2009 2010 2011 2012 2012 2012
1 Puspem Building 24.9 29.0 36.3 31.1 32.5 29.1 33.7 2 Cikokol Flyover 24.5 29.5 30.5 31.5 29.5 28.8 36.2 3 Office Batuceper
Sub-District 27.7 30.5 29.8 29.5 30.5 28.3 34.7
4 Office Cibodas
Sub-District 27.2 28.5 34.4 32.5 31.5 29.9 32.8
5 Malabar Market 26.9 29.0 31.0 31.5 28.5 30.4 33.4
6 Islamic Village 26.4 29.0 30.5 30.5 30.5 30.2 30.7 7 Office Karawaci
Sub-District 26.6 28.5 29.4 33.5 30.5 29.4 31.2
8 Cisadane Building 26.9 30.0 31.0 32.5 32.0 29.4 34.2 9 Cimone Bus Station 25.5 29.5 29.9 29.0 29.5 30.2 31.9 10 Office Pasir Jaya Village 25.5 29.5 31.5 32.5 33.0 30.4 34.2 11 Office Gembor Village 26.4 29.0 30.8 31.0 31.0 28.8 33.9 12 Office Neglasari
Sub-District 26.1 29.0 29.6 30.5 32.0 29.1 31.6
Indonesian Journal of Geography, Vol 45, No.2, December 2013 : 101 - 115
Table 4 (cont.). Urban Temperature Change in Tangerang City (2001-2012)
No LOCATION LST AST LST AST
2001 2009 2010 2011 2012 2012 2012
14 Benda Sub-District 25.8 28.5 31.0 32.0 31.0 28.6 34.1
15 Benda Village 26.1 29.5 29.8 32.5 37.5 29.9 33.0
16 Karang Tengah
Sub-District 25.0 28.5 30.9 32.5 32.0 28.8 33.3
17 BPI Building 25.8 29.5 34.2 29.0 29.0 29.1 30.4
18 Cipondih Sub-District 26.9 29 31.2 31.5 33.0 29.9 33.5 19 Poris Plawad Bus
Station 25.5 29.5 33.4 30.5 29.5 28,0 34.0
20 Poris Indah Housing 26.6 29.5 35.7 28 33.5 29.9 32.8 21 Bengkok Market 27.7 29.5 30.8 32.5 34.5 30.7 35.1 22 Graha Bintaro Housing 26.6 29.5 31.7 32.5 33.5 29.6 32.3 23 Cipete Village 26.0 29.5 30.9 29.0 32.5 29.1 31.7 24 Pinang Sub-District 25.2 28.0 29.1 32.5 33.5 28.0 32.1 25 Panu nggangan Village 25.8 30.0 26.6 30.5 30.0 28.6 31.5 26 H. Mencong Street 26.4 28.5 34.9 31.5 29.0 30.7 30.4
Source: Survey, and Data Process in 2012
SPATIAL-TEMPORAL ANALYSIS Adi Wibowo, Andy Rustanto
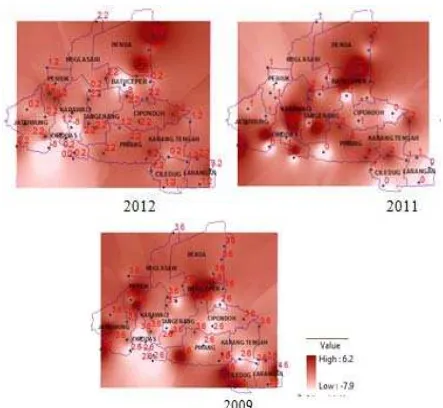
Figure 10. Spatial-Temporal UHI Index in Tangerang City (2009, 2011 and 2012)
UHI phenomenon LST
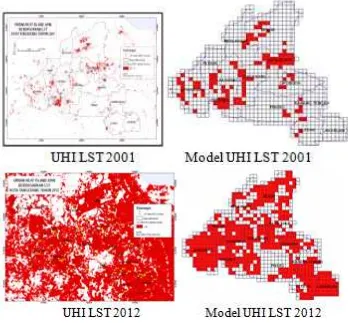
GIS Modeling from LST in Tangerang City is shown in Figure 9. UHI LST. The figure indicates that areal composition of UHI LST with temperature higher than 300C in 2012 is larger than in 2001. Percentage area in 2001 for UHI LST with temperature higher than 300C was less than 20% (mainly in Benda, Batuceper, and Jatiu-wung sub-district). In 2012, UHI LST increased to higher than 80% for the area with temperature higher than 300C, expressed by red color covering almost entire area of the city. UHI phenomena in Tangerang City indicated by temperature higher than 300C. Based on land surface temperature, UHI phenomenon in 2001
already covered small area. UHI phe-nomenon in 2012 almost covered the entire area of Tangerang.
UHI Index AST and LST
Indonesian Journal of Geography, Vol 45, No.2, December 2013 : 101 – 115
CONCLUSION
This reseach reveals that there were changing temperature conditions, both air surface and land surface temperature in Tangerang City. UHI phenomenon in Tangerang City indicated by temperature higher than 300C. Based on land surface temperature, UHI phenomenon in 2001 already covered small area. However, UHI phenomenon in 2012 almost covered the entire Tangerang area. UHI Index in 2009 is 3.60C, in 2011 is 1.50C and in 2012 reached up to 1.20C. UHI phenomenon occurred since 2001 and the trend of UHI
Index AST increasing since 2009, with average UHI Index AST of 20C. UHI Index LST in 2001 is 9.780C, while in 2012 is 13.960C.
ACKNOWLEDGEMENT
The authors are deeply grateful to Re-search and Public Service Directorate, University of Indonesia for support of the research grant with contract number 1902/HR.R12.1/HKP.05.00/2011. Many thanks are also goes to Environmental Bu-reau of Tangerang City for the temperature data provided.
REFERENCES
Environmental Bureau of Tangerang City (2009), Study of Air Quality in 2009. Environmental Bureau of Tangerang City, Banten Province.
_____. (2010), Study of Air Quality in 2010, Environmental Bureau of Ta-ngerang City, Banten Province.
_____. (2011), Study of Air Quality in 2011, Environmental Bureau of Tangerang City, Banten Province.
_____. (2012), Study of Air Quality in 2012, Environmental Bureau of Tangerang City, Banten Province.
Indonesian Meteorological, Climatological and Geophysical Agency (2012), Climate Change Information and Air Quality in Indonesia, Indone-sian Meteorological, Climatolo-gical and Geophysical Agency.
Hernina, R., Hanafiah, I., and Wikantika, K. (2008), Urban heat island ana-lysis used satellite data (case study in Bekasi Areas, West Java), Journal of Geography, 1(2), 73-80.
Kim, Y.H., and Baik, J.J. (2005), Spatial and temporal structure of the urban
heat island in Seoul, Journal American Meteorological Society, 44, 591-605.
Tursilowati, L. (2008), Urban Heat Island and their contribution on climate change and relationship with land use change, Proceeding National Seminar on Global Warming and Global Change: Fact, Mitigation and Adaptation. ISBN:978-979-17490-0-8.
Tursilowati, L., Sumantyo, J. T. S., Kuze, H., and Adiningsih, E.S. (2012), Relationship between urban heat island phenomenon and land use/land cover changes in Jakarta, Indonesia. Journal of Emerging Trends in Engineering and Applied Sciences, 3(4), 645-653.
SPATIAL- TEMPORAL ANALISIS Adi Wibowo, Andi Rustanto
Malaysian Meteorological Department. (2009), Climate Change Scenarios For Malaysia 2001-2009, Numeri-cal Weather Prediction ment Section, Technical Develop-ment Division Malaysian Meteoro-logical Department, Ministry of Science, Technology and Inno-vation.
Mallick, J., Yogesh K., and Bharath, B.D. (2008), Estimation of land surface temperature over Delhi using Landsat 7 ETM+, Journal of Indian Geophysics Union, 12 (3), 131-140.
Mallic, J., Singh, C. K., Shastri, S., Rahman, A., Mukherjee, S. (2012), Land surface emissivity retrieval based on moisture index from LANDSAT TM satellite data over heterogeneous surfaces of Delhi city, International Journal of Applied Earth Observation and Geoinformation, 19, 348-358.
Wong, N.H., and Yu, C. (2005), Study of green areas and urban heat island in
a tropical city, Journal of Habitat International, 29, 547-558.
Parham, A. M., and Haghighat, F. (2010), Approach to study urban heat island-ablities and limitation, Jou-rnal of Building and Environment, 45 (2010), 2192-2201.
Memon, R.A., Dennis, Leung, Y.C., and Liu, C.H. (2009), An investigation of urban heat island intensity (UHII) as an indicator of urban heating, Journal of Atmospheric Research, 94(3), 491-500.
Suzuki, C. (2008), Improvements of heats island monitoring network in Tokyo, Geographical Reports of Tokyo Metropolitan University, 43, 33-40.