Acta Interna - The Journal of Internal Medicine
22
transfusion due to the formation of HLA antibodies from previous exposure through transfusion or
5 pregnancy, called alloimunization .
Patients number 18 was a manget aplatelet transfusion which have been in storage over 3 days. This patient was diagnosed with suspected ITP and bleeding gums. These patients did not experience the event may be due to the effects of medication FNHTR pre-transfusion and because there is only risk factor platelet stored over 3 days.
Patient number 13 was a man with a diagnosis suspect of anemia aplastica and urinary tract infections. Patients never been get platelet transfusion and get sold less than 3 days. The FNHTR did not happen may be due to the effects of medication pre-transfusion.
Another study concluded that the duration of platelet storage less than 3 days associated with
11,12
the lower incidence of FNHTR . Incidence of FNHTR higher after infusion of platelets stored of
13
about 4 to 5 days . This study has several limitations. First, the number of samples of this study is less than the minimum sample size calculation that will affect the statistical analysis. Second, factors suspected to affect FNHTR not measured quantitatively.
CONCLUSION
P r e - t r a n s f u s i o n m e d i c a t i o n s w i t h acetaminophen 650 mg and diphenhydramine 25 mg reduced the incidence of FNHTR compared to placebo in the first platelet recipients in malignancy.
REFERENCES
1. Kurnianda, J. 2001. Hematology modules.
2. Secord, A., Osby, M., Goldfinger, D. 2008. Clinical and laboratory aspects of platelet transfusion therapy. UpToDate 16.1. www.uptodate.com.
3. Bordin, J.O., Heddle, N.M., Blajchman, M.A. 1994. Biologic effects of leukocytes present in transfused cellular blood products. Blood, Vol 84, no 6:1703-21. 4. Heddle, N.M., Klama, L., Singer, J., Richard, C.,
Fedak, P., Wlaker, I., Kelton,J.G. 1994. The role of the plasma from platelet concentrates in transfusion reaction. New England J of Medicine; 331:625-28. 5. Baldwin, P.D. 2002. Febrile non haemolytic
transfusion reaction. Clinical J ofOncology Nursing, volume 6, number 3.
6. Wang, S.E., Lara, P.N., Lee-Ow, A., J. Reed, Wang, L.R., P. Palmer, TuscanoJ.M., Richman, C.M., Beckett, L., Wun, T. 2002. Acetaminophen and diphenhydramine as premedication for platelet transfusion: a prospective randomized double-blind placebo-controlled trial. Am J Hematol; 70 (3):191-4. 7. Kardon, E. 2008. Transfusion reaction. Emedicine. 8. Geiger, T.L., Howard, S.C. 2007. Acetaminophen and
diphenhydramineepremedication for allergic and febrile non-haemolytic transfusion reactions: good prophylaxis or bad practice? Transfus med rev, 21 (1):1-12.
9. Alter, H.J. and Klein, H.G. 2008. The hazard of blood transfusion in historical prospective. Blood;112:vol 7:2617-28
10. Eder, A.F. 2001. Febrile non-haemolytic transfusion reactions. Handbook of Transfusion Medicine; Philadelphia; Chapter 29: 253-8.
11. Muylle, L. 1995. The role of cytokines in blood transfusion reactions. Bloodreview;9:77-83.
12. Kelley, D.L., Mangini, J., Lopez-Plaza, I.,Triulzi, D.J. 2000. The utility of less than 3 day-old whole blood platelets in reducing the incidence of febrile non-haemolytic transfusion reaction. Transfusion; 40:439-42.
13. Sharma, A.S. and Grocott, H.P. 2000. Platelet transfusion reaction: febrile non haemolytic reaction or bacterial contamination? Diagnosis, detection and current preventive modalities.J of Cardiothoracic and VascularAnesthesia;14:440-66.
Pudya Lestari Arshanti, et al
23
O R I G I N A L A R T I C L E
LEPTIN LEVEL IN NON DIABETIC POPULATION WITH AND WITHOUT
NON ALCOHOLIC FATTY LIVER (NAFL)
1 2 2
Noor Asyiqah Sofia , Siti Nurdjanah , Neneng Ratnasari
1. Sub Division of Psychosomatic, Division of Internal Medicine DrSardjito General Hospital / Faculty of Medicine UniversitasGadjahMada Yogyakarta
2. Sub Division of Gastro EnteroHepatology, Division of Internal Medicine DrSardjito General Hospital/ Faculty of Medicine UniversitasGadjahMada Yogyakarta
3. Sub Division of Gastro EnteroHepatology, Division of Internal Medicine DrSardjito General Hospital / Faculty of Medicine UniversitasGadjahMada
ABSTRACT
Background.Non alcoholic fatty liver disease (NAFLD) is a prevalent condition associated with obesity and insulin resistance. Leptin is an adipokine which plays role in decreasing food intake and controlling energy utilization. The role of leptin pathogenesis of NAFLD remains unclear. Former studies associated with the role of leptin in NAFL were never conducted in diabetic patients.
Aim of study. The aim of the study is to analyze the difference of leptin level in non-diabetic population between subjects with and without non-alcoholic fatty liver disease.
Method.This was a non-matching case control study in general check-up polyclinic Dr. Sardjito Hospital Yogyakarta. The inclusion criteria were aged 30-60 years old, no history of alcohol consumption > 20 gr/day, no diabetes mellitus. The exclusion criteria were viral hepatitis (B and C), rapid weight loss, steroid therapy, and pregnancy. Diagnosis of NAFL was based on bright liver imaging from ultrasonography.
Result. There were 48 subjects, consisted of 23 subjects with NAFL and 25 subjects without NAFL. Mean of leptin level in NAFL group was higher than non NAFL group and this difference was statistically significant (20.29 + 15.73ng/ml and 12.27 + 10.1ng/ml; p=0.040).
Conclusion.The conclusion of this study was leptin level significantly higher in non diabetic population with NAFL compared with non NAFL.
Keywords: leptin, non diabetic, non alcoholic fatty liver
INTRODUCTION
Today, Non-Alcoholic Fatty Liver Disease (NAFLD) is one of clinical condition often found at
1
hepatology area . There is an increasing incidence of NAFLD in metabolic syndrome that consists of obesity, hyperinsulinaemia, perifer insulin resistance, diabetes mellitus, hypertrigliseridaemia
2
and hypertension . NAFLD has a very wide clinical spectrum from the lightest to the heaviest, namely simple steatosis or non alcoholic fatty liver (NAFL), fatty liver with espoused inflammation and damage hepatocyte often called as nonalcoholic steato hepatitis (NASH), and hepatic cirrhosis, or
3
hepatocellular carcinoma . At this time, NAFLD is important in clinical implication as the major cause of transaminase enzyme increment in America. Besides, NAFLD has a potential capability to be
4 liver cirrhosis and hepatocellular carcinoma .
In western population, the NAFLD prevalence ranged from 15%-20%. NAFLD prevalence in adult population at United States, Japanese and Italian revolve 15-20%; and 20-30% presented in severe phase like NASH. Studies in obese population at developed countries found 60% simple steatosis, 20-25% NASH and 2-3% cirrhosis. NAFLD incident in diabetes mellitus type 2 populations was as big as 70% and in patient with hyperlipidaemia 60%. Based on existing studies, the
4 prevalence of NAFLD in Indonesia is 30.6% .
Leptin is a product of gene ob molecule weighing 16kDA that expressed a lot at white adipose tissue. Leptin also detectable at center nerve system, various organ and perifer such as pancreas,
5,6
Acta Interna - The Journal of Internal Medicine
24
hypothalamus level to decrease food intake and increase energy use. Leptin level increased along with the increasing of fat mass 6.
Nowadays, the pathogenesis of NAFLD is still unclear, but it is estimated to be the combination of genetics and environment. The tight existence between leptin, adipose network and fat storage in human body showed the involvement of leptin in etiology and pathogenesis of NAFL. However, the role of leptin in NAFLD pathogenesis is still
7,8 unclear .
Recently, there is no consensus about NAFLD management. Experts have agreed on that the management of NAFLD were focused on the risk factor managements, like obesity and diabetes. Several medicines, like thiazolidinedione and metformin are well known to demote leptin production. It is also known that weight loss can
9
restore body sensitivity towards leptin . If the involvement of leptin in NAFLD pathogenesis is clear, along with several therapies related to leptin depreciation, supposed that there will be more benefit in managing NAFLD.
The Aim of the Study
The aim of the study was to detect the differences of leptin level in non diabetic population with NAFL and without NAFL.
Method of the Study
The design of this study was a non matching case control study, which compared the mean of leptin level in subjects with and without NAFL. This study was conducted in General Check up Polyclinic at Dr. Sardjito General Hospital Yogyakarta. The accessible population of the study was patients who visited General Check up (GCU) polyclinic with range of age 30-60 years old and willing to join the study. The inclusion criteria were age 30-60 year, no history of alcohol consumption >20 gram/day, no history of diabetes mellitus, and ready to signing informed consent. The exclusion criteria were viral hepatitis (B and C), rapid weight loss, steroid therapy, and pregnancy.
Dependent variable is non alcoholic fatty liver (NAFL). Independent variable is leptin level. Other variables that evaluated were age, sex, height, body weight, body mass index, waist circumference, total cholesterol, LDL cholesterol, HDL cholesterol, triglyceride, ALT, AST, and GGT.
Subject visited GCU in a state of fasting for 12 hours. Subjects identity were registered using research form and physical examination which covered blood pressure measurement, body weight, waist circumference, and complete physical examination, with anamnesis about medicines such lipid lowering, corticosteroid, tamioxifen and special diet to lose weight. Then, blood taking were done in vena as much as ± 20 ml, for examiningleptin, triglyseride, total cholesterol, LDL, HDL, AST, ALT, and GGT. Blood sample examinations were done at Prodia laboratory Yogyakarta. All subjects endured USG abdomen at Dr. Sardjito General Yogyakarta, to determine whether they had bright liver or not. The evaluation result of USG was done by 2 gastroenterohepatology experts with value kappa 0.95.
Result and Discussion
This study was done from 1 October 2006 to 31 January 2007 toward 48 subjects; consist of 20 malesubjects (41.7%) and 28 female subjects (58.3%). All subjects were divided into 2 groups based on USG examination, namely group with NAFL when there was bright liver (description hyperechoic homogenous in liver that compared with right kidney in USG) and group without NAFL when there was no bright liver in USG.
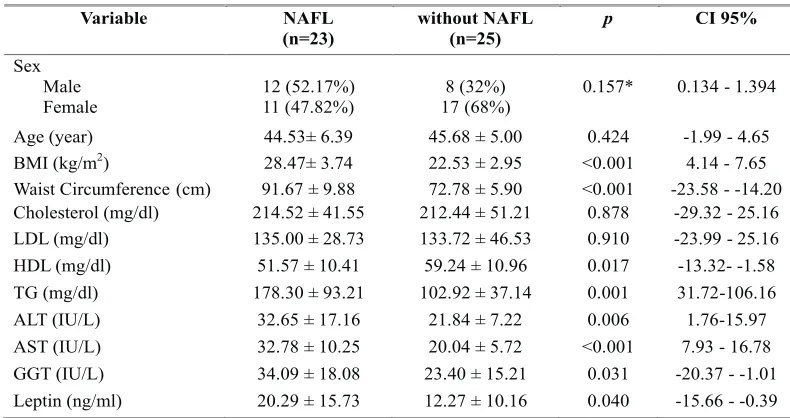
There were 23 subjects with NAFL, consist of 12 male subjects (52.17%) and 11 female subjects (47.82%); and 25 subjects without NAFL, that consist of 8 male subjects (32%) and 17 female subjects (68%). Table 1 showed that there were significant differences in mean of body mass index, waist circumference, TG, HDL, AST, ALT, GGT, and leptin level in group with NAFL and group without NAFL. Meanwhile, there were no significant differences in mean of age, cholesterol, and LDL in both groups.
Noor Asyiqah Sofia, et al
25 In table 1, there were differences on the mean of liver enzymes, such as AST, ALT, and GGT between group with NAFL and group without NAFL, which was higher in NAFL group. The mean of AST in group with NAFL was 32.78 ± 10.25 IU/l, while in group without NAFL 20.04 ± 5.72 IU/l.Although the mean of AST in group with NAFL showed a normal range (<37 IU/l), but statistically the mean of AST in group with NAFL was higher than group without NAFL (p=<0.001; CI 7.93-16.78). In group with NAFL the mean of ALT and GGT were higher compared to group without NAFL. The mean of leptin level in group with NAFL was 20.29 ± 15.73 ng/ml while in group without NAFL 12.27 ±10.1 ng/ml. The result showed that statistically there were significant differences on the mean of leptin level (p = 0.040; CI -15.66 - -0.39).
Tabel 1. Variables comparison in group with NAFL and group without NAFL
Variable NAFL
(n=23)
without NAFL (n=25)
p CI 95%
Sex Male Female
12 (52.17%) 11 (47.82%)
8 (32%) 17 (68%)
0.157* 0.134 -1.394
Age(year) 44.53± 6.39 45.68 ± 5.00 0.424 -1.99 -4.65
BMI(kg/m2) 28.47± 3.74 22.53 ± 2.95 <0.001 4.14 -7.65
Waist Circumference(cm) 91.67 ± 9.88 72.78 ± 5.90 <0.001 -23.58 --14.20 Cholesterol(mg/dl) 214.52 ± 41.55 212.44 ± 51.21 0.878 -29.32 -25.16 LDL (mg/dl) 135.00 ± 28.73 133.72 ± 46.53 0.910 -23.99 -25.16 HDL (mg/dl) 51.57 ± 10.41 59.24 ± 10.96 0.017 -13.32--1.58
TG (mg/dl) 178.30 ± 93.21 102.92 ± 37.14 0.001 31.72-106.16
ALT (IU/L) 32.65 ± 17.16 21.84 ± 7.22 0.006 1.76-15.97
AST (IU/L) 32.78 ± 10.25 20.04 ± 5.72 <0.001 7.93 -16.78
GGT (IU/L) 34.09 ± 18.08 23.40 ± 15.21 0.031 -20.37 --1.01 Leptin (ng/ml) 20.29 ± 15.73 12.27 ± 10.16 0.040 -15.66 - -0.39
Data displayed in mean± Standard Deviation, all datas were analyzed using Independent Student t test, * analysis 2
X , CI: Confidence Interval, NAFL: non alcoholic fatty liver, BMI: Body Mass Index, LDL: low density lipoprotein, HDL: high density lipoprotein, TG: trigliseride, ALT: alanin aminotransferase, AST: aspartat aminotransferase, GGT: gamma glutamyltransferase
Table 2. Variable comparison between group with NAFL and without NAFL in male subjects
Variable NAFL
(n=12)
WithoutNAFL
(n=8)
p CI95%
Age (year) 43.17 ± 6.19 46.38 +6.209 0.384 -3.16 - 9.58
BMI (kg/m2) 28.82+2.87 21.60 +2.14 <0.001 -9.73 - -4.72
Waist Circumference(cm) 94.58 ± 10.40 73.63 ± 5.34 <0.001 -29.38 - -12.54
Cholesterol (mg/dl) 220.75 +49.00 221.38 ± 67.55 0.910 -53.98 - 55.23
LDL (mg/dl) 136.67 +31.93 150.38 +65.48 0.970 -32.19 - 59.60
HDL (mg/dl) 47.5 +7.34 54.88 +8.97 0.069 -0.31 - 15.06
TG (mg/dl) 219.5 +110.78 91.88 +38.06 <0.001 -213.74- -41.51
ALT (IU/L) 40.58 +19.91 26.13 +6.98 0.031 -27.82 -1.09
AST (IU/L) 34.0 +6.42 22.63 +6.84 0.003 -17.69 - -5.05
GGT (IU/L) 43.83 + 19.81 22.0 + 8.0 0.003 -37.44 - -6.23
Leptin (ng/ml) 17.64 ± 18.16 6.27 ± 9.93 0.007 -26.53 - 3.79
Data displayed in mean ± Standard Deviation, all datas were analyzed using Mann Whitney U test, CI: Confidence Interval, NAFL: non alcoholic fatty liver, BMI: Body Mass Index, LDL: low density lipoprotein, HDL: high density lipoprotein, TG: trigliseride, ALT: alanin aminotransferase, AST: aspartat aminotransferase, GGT: gamma glutamyltransferase.
Acta Interna - The Journal of Internal Medicine
26
Table 2 showed that on male subjects, there were significant differences on the mean of TG, ALT, AST, GGT, leptin, BMI, and waist circumference between group with NAFL and without NAFL. The mean of leptin level of male subjects in group with NAFL was 17.64 ± 18.16 ng/ml, while in the group without NAFL was 6.27 ± 9.93 ng/ml.
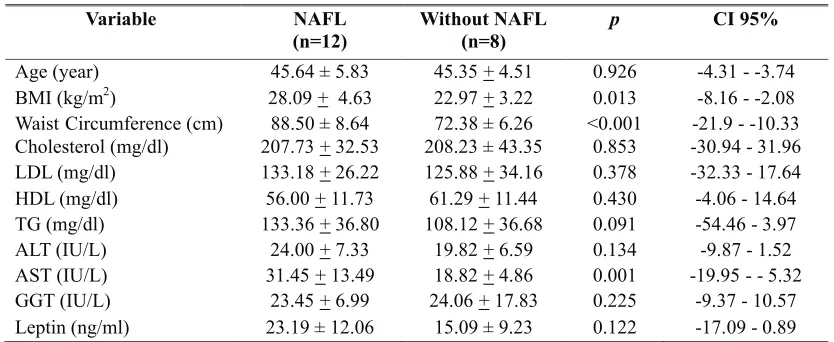
Table 3. Variable comparison between group with NAFL and without NAFL on female subjects
Variable NAFL
(n=12)
Without NAFL (n=8)
p CI 95%
Age (year) 45.64 ± 5.83 45.35 +4.51 0.926 -4.31 --3.74
BMI (kg/m2) 28.09 + 4.63 22.97 +3.22 0.013 -8.16 --2.08
Waist Circumference (cm) 88.50 ± 8.64 72.38 ± 6.26 <0.001 -21.9 --10.33
Cholesterol (mg/dl) 207.73 +32.53 208.23 ± 43.35 0.853 -30.94 -31.96
LDL (mg/dl) 133.18 +26.22 125.88 +34.16 0.378 -32.33 -17.64
HDL (mg/dl) 56.00 +11.73 61.29 +11.44 0.430 -4.06 -14.64
TG (mg/dl) 133.36 +36.80 108.12 +36.68 0.091 -54.46 -3.97
ALT (IU/L) 24.00 +7.33 19.82 +6.59 0.134 -9.87 -1.52
AST (IU/L) 31.45 +13.49 18.82 +4.86 0.001 -19.95 --5.32
GGT (IU/L) 23.45 +6.99 24.06 +17.83 0.225 -9.37 -10.57
Leptin (ng/ml) 23.19 ± 12.06 15.09 ± 9.23 0.122 -17.09 - 0.89
Data displayed in mean ± Standard Deviation, all datas were analyzed using Mann Whitney U test, CI: Confidence Interval, NAFL: non alcoholic fatty liver, BMI: Body Mass Index, LDL: low density lipoprotein, HDL: high density lipoprotein, TG: trigliseride, ALT: alanin aminotransferase, AST: aspartat aminotransferase, GGT: gamma glutamyltransferase.
Table 3 showed that on female subjects there were significant differences on the mean level of AST, BMI, and waist circumference between group with and without NAFL. The mean of leptin level in female subjects with NAFL was 23.19 ± 12.06 ng/ml, while in the group without NAFL was 15.09 ± 9023 ng/ml.However, this difference was not statistically significant (p = 0.122).
Results from this study showed that the average concentrations of leptin level were higher in the group with NAFL compared to group without NAFL, and the result was consistent only on male subjects. While the difference in leptin levels between group with NAFL and group without NAFL was not statistically significant in female subjects. Results from this study is differ from previous research conducted by Huang et al. (2008) and Chitturi et al. (2002), which states that both groups of male and female leptin levels were higher in NAFLD and NASH groups compared with control 7,10
. Several previous studies have also shown an increase of leptin level in group with NAFLD compared to group without NAFLD, but there is no
further study analyzed in the differences of leptin 11, 12, 13
levelon each gender . Different result showed in the study by Chalasani et al. (2003) and Musso et al. (2005), ie. both studies showed that leptin level did not significantly different in the NASH group and
14,15 control .
The increase of leptin levels in NAFLD probably caused by the condition of the hyperleptinemia which is related to pro inflammation. Leptin is estimated to contribute at each stage of the occurence of NAFLD. Leptin can also strengthen the process of inflammation and fibrosis in the liver. There is an evidence that injections of leptin will lead the increasing of level of procollagen-1, TGF â1, and TNFá, which leading
16 to inflammation and more severe liver fibrosis .
This study showed that BMI, waist circumference, triglycerides, AST, and ALT in group with NAFL were higher than group without NAFL, conversely lower HDL level showed in group with NAFL. These results are consistent with a study by Mendez et al. (2005), which showed that in NAFLD group there were a higher BMI, higher total Noor Asyiqah Sofia, et al
27 cholesterol, higher triglycerides, higher LDL
cholesterol, lower HDL cholesterol, while AST and 11 ALT levels are higher than the control group .
In NAFLD, usually there was an increase in ALT and AST levels, but the increment did not exceed 4 times the normal value. In this study, AST and ALT levels in the NAFL group still within the range of normal values. The increasing of ALT and
AST in NAFLD was due to the inflammatory processes in the liver as the result of tissue damage on the liver or steatohepatitis. The study showed that ALT and AST values were normal in group with NAFL possibly due to the proccesses involved was still in the stage of liver steatosis (first hit of the pathogenesis of NAFLD).
Table 4. Correlation between leptin and other variables on male
BMI Waist
circumference
Total Cholesterol
TG LDL HDL ALT AST
Leptin r 0.517 0.536 -0.117 0.536 -0.256 -0.198 0.339 0.494
p 0.020 0.015 0.624 0.015 0.276 0.404 0.144 0.027
Analysis were using Spearman correlation, BMI: Body Mass Index, LDL: low density lipoprotein, HDL: high density lipoprotein, TG: trigliseride, ALT: alanin aminotransferase, AST: aspartat aminotransferase.
Table 5. Correlation between leptin and other variables on female
BMI Waist
circumference
Total Cholesterol
TG LDL HDL ALT AST
Leptin r 0.441 0.514 0.089 0.193 0.156 -0.211 0.260 0.433
p 0.019 0.005 0.652 0.324 0.429 0.282 0.181 0.021
Table 4 showed that leptin level on male subjects correlated with BMI, waist circumference, triglycerides, and AST. Table 5 showed that leptin level on female subjects correlated with BMI, waist circumference and AST.
The results of this study showed that leptin had correlation with BMI, waist circumference and AST levels on both male and female subjects. The correlation between BMI and leptin are consistent with the theory that leptin level is increasing along
9
with body mass . Research conducted by Chitturiet al. (2002), showed the opposite result, whereas, the study showed that leptin level has no correlation with BMI on both subjects, male and female. In the study by Chitturiet al. (2002) found precisely such a significant correlation between leptin level with
10 ALT and C-peptida .
Analysis were using Spearman correlation, BMI: Body Mass Index, LDL: low density lipoprotein, HDL: high density lipoprotein, TG: trigliseride, ALT: alanin aminotransferase, AST: aspartat aminotransferase.
Mendez et al. (2005) in his research found that in NAFLD subjects; body weight, body mass index, central obesity and insulin resistance were
11
higher than control group . The research on 174 NAFLD subjects with 42 controls showed that bigger waist circumference on NAFLD was indicating
17 central obese .
Waist circumference portrayed more body fat because it was not consisted of lots of bone structures (spine only), whereas hip circumference was correlated with subcutaneous fat tissue than intra-abdominal fat because it is influenced by the hip circumference of the gluteal muscle mass and the size
18
of pelvis which varies among subject . The existence of a strong relation between leptin level and waist circumference was estimated to underlie the relation
10 between visceral fat with resistance insulin .