Employment
Analysis and
Research Unit
Economic and
Employment Sector
Employment Working Paper No.
146
2013
Ximena Peña
The formal and informal
sectors in Colombia
Employment Sector
Employment Working Paper No. 146
2013
The formal and informal sectors in
Colombia
Country case study on labour market
segmentation
Ximena Peña
Employment Analysis and Research Unit
Copyright © International Labour Organization 2013 First published 2013
Publications of the International Labour Office enjoy copyright under Protocol 2 of the Universal Copyright Convention. Nevertheless, short excerpts from them may be reproduced without authorization, on condition that the source is indicated. For rights of reproduction or translation, application should be made to ILO Publications (Rights and Permissions), International Labour Office, CH-1211 Geneva 22, Switzerland, or by email: [email protected]. The International Labour Office welcomes such applications.
Libraries, institutions and other users registered with reproduction rights organizations may make copies in accordance with the licences issued to them for this purpose. Visit http://www.ifrro.org to find the reproduction rights organization in your country.
ILO Cataloguing in Publication Data
Peña, Ximena
The formal and informal sectors in Colombia : country case study on labour market segmentation/ Ximena Peña ; International Labour Office, Employment Sector, Employment Analysis and Research Unit, Economic and Labour Market Analysis Department. - Geneva: ILO, 2013
Employment working paper; No.146 ; ISSN 1999-2939 ; 1999-2947 (web pdf)
International Labour Office; Employment Sector
labour market segmentation / unemployment / wages / informal economy / labour legislation / comment / case study / Colombia
13.01.2
The designations employed in ILO publications, which are in conformity with United Nations practice, and the presentation of material therein do not imply the expression of any opinion whatsoever on the part of the International Labour Office concerning the legal status of any country, area or territory or of its authorities, or concerning the delimitation of its frontiers. The responsibility for opinions expressed in signed articles, studies and other contributions rests solely with their authors, and publication does not constitute an endorsement by the International Labour Office of the opinions expressed in them. Reference to names of firms and commercial products and processes does not imply their endorsement by the International Labour Office, and any failure to mention a particular firm, commercial product or process is not a sign of disapproval. ILO publications and electronic products can be obtained through major booksellers or ILO local offices in many countries, or direct from ILO Publications, International Labour Office, CH-1211 Geneva 22, Switzerland. Catalogues or lists of new publications are available free of charge from the above address, or by email: [email protected]
Visit our website: http://www.ilo.org/publns
Preface
The primary goal of the ILO is to contribute, with member States, to achieve full and productive employment and decent work for all, including women and young people, a goal embedded in the ILO Declaration on Social Justice for a Fair Globalization (2008),1 and
which has now been widely adopted by the international community. The integrated approach to do this was further reaffirmed by the 2010 Resolution concerning employment policies for social justice and a fair globalization.2
In order to support member States and the social partners to reach this goal, the ILO pursues a Decent Work Agenda which comprises four interrelated areas: Respect for
fundamental worker’s rights and international labour standards, employment promotion,
social protection and social dialogue. Explanations and elaborations of this integrated approach and related challenges are contained in a number of key documents: in those explaining the concept of decent work,3 in the Employment Policy Convention, 1964 (No.
122), in the Global Employment Agenda and, as applied to crisis response, in the Global Jobs Pact adopted by the 2009 International Labour Conference in the aftermath of the 2008 global economic crisis.
The Employment Sector is fully engaged in supporting countries placing employment at the centre of their economic and social policies, using these complementary frameworks, and is doing so through a large range of technical support and capacity building activities, policy advisory services and policy research. As part of its research and publications programme, the Employment Sector promotes knowledge-generation around key policy issues and topics conforming to the core elements of the Global Employment Agenda and
the Decent Work Agenda. The Sector’s publications consist of books, monographs,
working papers, employment reports and policy briefs.
The Employment Working Papers series is designed to disseminate the main findings of research initiatives undertaken by the various departments and programmes of the Sector. The working papers are intended to encourage exchange of ideas and to stimulate debate. The views expressed are the responsibility of the author(s) and do not necessarily represent those of the ILO.
José Manuel Salazar-Xirinachs Executive Director
Employment Sector
1 See http://www.ilo.org/public/english/bureau/dgo/download/dg_announce_en.pdf.
2 See http://www.ilo.org/public/libdoc/ilo/2010/110B09_108_engl.pdf.
3 See the successive Reports of the Director-General to the International Labour Conference:
Foreword
One of the key features of the labour market developments observed during the past decades throughout the world relates to a phenomenon of labour market segmentation, i.e. the division of the labour market into separate submarkets or segments, distinguished by different characteristics and behavioural rules. To a large extent, these attributes depend on the specific environment in which workers operate. Segmentation may arise from particularities of labour market institutions, such as contractual arrangements (permanent versus temporary employment), their enforcement (and the resulting informality), as well as types of workers concerned (such as migrant, domestic, or dispatch workers).
While the phenomenon is not new, the job crisis has brought an increasing attention to the segmentation/duality issue, especially in Europe. The implications and costs of segmentation are multiple, in both economic and social terms: they include wage gaps between segments, differences in access to training and social security, as well as in working conditions or tenure. Moreover, segmentation implies limited transitions to better jobs. The consequences of segmentation also have macroeconomic implications, such as lower productivity and higher employment volatility.
In this context, and as part of its objective of promoting decent work, the ILO launched, in 2012, a research programme to better understand how labour market institutions affect employment outcomes in both quantitative and qualitative terms. One of the main motivations of the research project is to put job quality at the forefront of the policy debates, informing the main stakeholders in the world of work of the extent of labour market segmentation and its implications for job quality in selected countries. Fourteen country studies on labour market segmentation and job quality were provided by external country experts, as well as thematic papers on job quality in segmented labour markets and the role of labour law, collective bargaining, and improved enforcement. These studies were discussed in a scientific Workshop held at the ILO in December 2012 and used as thematic inputs in a policy-oriented Workshop held at the ILO in April 2013.
The current paper is one in the series of such country studies. It makes an important contribution to the discussion on segmentation of labour markets, providing an overview of the institutional setup as well as empirical evidence on the extent of segmentation and its implications for various aspects of job quality. The paper also offers a policy perspective on the ways to alleviate the negative consequences of segmentation.
Sandrine Cazes, Corinne Vargha,
Chief of Industrial and Employment
Employment Analysis and Research Unit Relations Department Economic and Labour Market Analysis
Contents
Page
Preface ... iii
Foreword ... v
1. Introduction ... 1
2. The Colombian labour market ... 3
2.1. Data ... 3
2.2. Economic growth and labour market indicators ... 3
2.3. Informality definitions ... 5
2.4. Informality by subgroups of the population ... 8
2.5. Informality and contract type ... 9
2.6. Labour market segmentation ... 10
3. Institutional background ... 13
3.1. The evolution of NWC ... 13
3.2. The evolution of the Minimum Wage ... 15
3.3. Legislation ... 17
3.3.1. Law 50 of 1990 ... 17
3.3.2. Law 789 of 2002 ... 17
3.3.3. Law 1429 of 2010 ... 18
3.3.4. Tax Reform ... 18
3.3.5. Enhancement of the Business Climate ... 18
3.3.6. Legislation impact ... 19
4. Labour market rigidities, wedges and segmentation ... 20
5. Segmentation and Job Quality ... 22
6. Policy Recommendations ... 25
References ... 26
List of figures and tables
Figure 1 GDP growth and unemployment rate ... 4
Figure 2 The evolution of labour market statistics ... 4
Figure 3 Informality rate by all definitions ... 7
Figure 4 (a,b,c) Informality rate by health and pension contribution ... 8
Figure 5 Informality rate by health and pension contribution ... 9
Figure 6 Relative size and earnings between wage earners and the self-employed ... 11
Figure 7 Transitions between the formal and informal sector ... 11
Figure 8 Non-wage labour costs as per cent of labour costs ... 14
Figure 9 Unemployment vs. Median labour income as proportion of minimum wage ... 16
Figure 10 Ratio of minimum wage to average wage ... 16
Figure 11 Average duration at current job... 23
1. Introduction
4There is a debate on whether particular labour markets are segmented, that is, whether they are divided into separate segments, with different characteristics and limited transitions between the segments. There is some evidence in the literature that suggests that the Colombian labour market is segmented into two different submarkets: the formal and informal sectors. As is the case with other countries in the region, the government is unable to fully enforce labour market institutions, such as social security and pension contribution or the minimum wage.
Perry et al. (2009) summarize the debate in the region by characterizing the discussion of the role played by the informal sector: exit or exclusion? The informal sector in Latin American countries is usually composed of the two. Some workers are informal because they are excluded from the formal sector due to labour market segmentation. Some workers voluntarily exit the formal sector since they find better conditions in informality. Whereas in many Latin American countries the informal sector is mostly composed from workers who choose to be informal, the Colombian informal sector appears as an exception since most informal workers seem to be excluded from the formal sector.
Workers in the two sectors have different characteristics such as educational attainment or economic sector. In addition, there is no full mobility between the two sectors. The existence of dual labour markets is strongly associated with differences in job quality and security. The formal sector, composed by those who abide by the labour market regulations, has higher wages and arguably higher worker productivity. In addition, workers are more educated, have access to social protection and higher job stability. The informal sector does not comply with labour market regulations. Workers in the informal sector have lower education levels, as well as inferior working conditions: many lack formal insurance against illness, unemployment and/or old age. Women, for example, are over-represented in the informal sector. Having a sizeable informal sector is problematic, not only because informal workers are more vulnerable, but also because this affects the productivity level of the economy. In addition, low productivity workers in the informal sector appear trapped in it: unable to find a job in the formal sector, they are forced to stay in the low-returns informal sector.
In the past twenty years, Colombia has implemented important reforms to the labour and social security regimes. The literature suggests that the Colombian labour market is over-regulated, and that the induced labour market wedges and rigidities are key drivers behind the observed level of segmentation in the labour market. In this paper we summarize the arguments and provide additional evidence. In particular, there are high levels of non-wage costs (NWC), namely, costs faced by the employer, other than the non-wage. These include labour taxes (employer contributions to finance public social services such as job training and childcare), health and pension contributions and commuting subsidies, among
others. In addition, the level of the minimum wage in the country is high relative to the
country’s productivity, measured as the median wage.
Because the labour market is segmented, economic policy such as increases in NWC or in real terms of the minimum wage, aimed at protecting workers, further deepen the
4 Ximena Peña is Assistant Professor at the Economics Department, Universidad de Los Andes,
labour market’s segmentation and may in fact be increasing informality. The existence of high NWC and a binding minimum wage affect the ability of the formal sector to adjust to the business cycle. As a result, when the country enters a recession, the formal sector is unable to adapt by lowering the wages and has to make the bulk of the adjustment through quantities, destroying jobs. Workers have to either enter the pool of the unemployed, or join the informal sector. Some aspects of the reforms have also generated changes in employee behaviour, generating incentives to join the informal sector. The coexistence of a high and
binding minimum wage, and high levels of NWC reinforce each other’s negative effects.
As a result of increases in the labour market wedges and rigidities, informality has increased substantially and today the informal sector in the country is substantial (Mondragón-Vélez et al., 2010).
The unemployment rate is a summary statistic of labour markets performance, and its evolution sheds light on the effectiveness of the stabilization mechanisms. The unemployment rate was also affected by the series of reforms to the labour market and the social security regime in Colombia. Sánchez et al. (2009) suggest that the increase in NWC and the minimum wage have increased the unemployment rate in the country affecting primarily vulnerable workers: the young, women and low-skilled workers.
2. The Colombian labour market
In this section, we describe the evolution of the variables of interest in the Colombian labour market. We first present data on unemployment, occupation and global participation rates, and then analyze the formal and informal sectors.
2.1. Data
The data used comes from the Colombian Household Survey, a repeated cross-section carried out by the National Statistics Department (DANE), for the period 1990-2012. The survey includes information on socioeconomics and demographics, such as gender, age, marital status and educational attainment. It also has an extensive module of labour market characteristics (for the population aged 12 or more in the urban areas, and 10 or more in rural areas) including occupation, job type, and income and industry sector.
The period of analysis covered in this paper spans three different phases of the Household Survey. First, the National Household Survey (Encuesta Nacional de Hogares, ENH, 1992-2000), were the information was collected for the 11 main cities in the final weeks of each quarter. Second, the Continuous Household Survey (Encuesta Continua de Hogares, ECH, 2001-2006), which collected information for the whole country. During this period, the information started to be collected continuously throughout the quarter and there were some changes in the unemployment definition, dictated by suggestions from the International Labour Organization (ILO). Finally, the Integrated Household Survey (Gran Encuesta Integrada de Hogares, GEIH, 2007-2012) which is also collected in a continuous fashion for whole country. The Integrated and the Continuous Household Surveys are very similar because the sample design is very close (Lora, 2008).
The relevant type of segmentation in the Colombian labour market has to do with the formal and informal sectors; the necessary variables to characterize these sectors are included in the Survey’s Informality Module. This module is available every two years between 19925 and 2000, and the information is collected during the second quarter of the
year. Starting in 2000, the informality module is available for the main 13 cities: for the second quarter of each year between 2000 and 2006, and for every quarter between 2007 and 2012. For comparability purposes we use the second quarter of every year with available information, except for 2012 (the only available information to date is the first quarter, and this is the information we use in this report).
2.2. Economic growth and labour market indicators
Figure 1 displays the evolution of the unemployment rate and GDP growth (measured in the second y axis). There is a negative relationship between GDP growth and unemployment: when GDP growth is high, unemployment decreases and vice-versa. Between 1998 and 2000, the country faced the worst economic crisis in recent history, when the GDP contracted by 4 per cent in 1999. The economic crisis was caused by an international recession in emerging markets that lead to a mortgage, fiscal and exchange crisis in Colombia. After the crisis, the country has had a decade of moderate but continuous economic growth. We experienced sluggish growth of about 1.5 per cent in 2009, due to the international crisis.
5
Figure 1 GDP growth and unemployment rate
Source: National Statistics Department and Colombian Central Bank
In the last twenty years, the unemployment rate in Colombia has remained above 10 per cent (see Figure 2). In the early 90’s, unemployment was between 10 and 12 per cent. The economic crisis of 1998-2000 triggered an increase in the unemployment rate, reaching 20 per cent in 2000. After the crisis, there has been a slow decrease in the unemployment rate. The unemployment rate has been fluctuating between 10 and 12 per cent since 2007. The more recent international crisis, starting in 2008, did not have a big impact in the Colombian economy. However, there was a slowdown in 2009, triggered by the deceleration in the US (the main trade partner) and other countries.
However, the natural rate of unemployment is very high. According to Ball et al., (2012), Colombia has the second highest estimated long run unemployment in the region, at 10.72, only surpassed by Argentina at 12.85. This is evidenced by the fact that since 2002 we have had several years of economic growth and the unemployment rate is only now reaching one-digit levels.
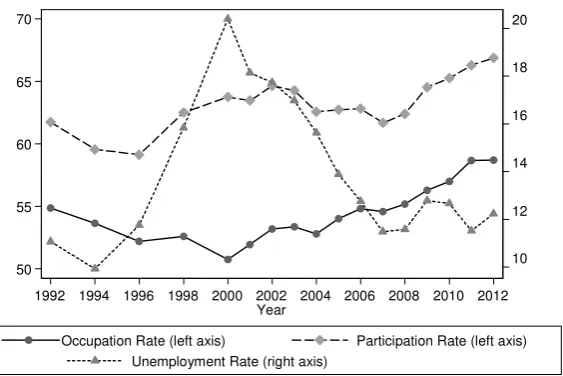
Figure 2 The evolution of labour market statistics
Source: Household Surveys. Author’s calculations
-4 -2 0 2 4 6
5 10 15 20
1992 1994 1996 1998 2000 2002 2004 2006 2008 2010 2012 year
Unemployment Rate (left axis) GDP Growth (right axis) GDP growth and Unemployment Rate
10 12 14 16 18 20
50 55 60 65 70
1992 1994 1996 1998 2000 2002 2004 2006 2008 2010 2012 Year
There are important differences in the unemployment rates of different subgroups of the population. For example, the unemployment rate of women is on average 6 percentage points higher than that of males. Namely, if the male unemployment is 7 per cent, the female unemployment rate is almost 13 per cent. The gap in the unemployment rate between men and women appears to be expanding in the last few years.
Young workers, between the ages of 18 and 25, face unemployment rates that are twice as high as that of other age groups. For example, during the worst years of the 1999 crisis, the average unemployment rate for the population as a whole was 20 per cent and the unemployment rate of the young was almost 50 per cent. This is not an uncommon phenomenon, however, since youth unemployment is a prevalent problem in many developed and developing countries.
The global participation rate measures the labour supply in the country, namely, the proportion of the economically active (those employed or actively looking for a job) among the people of working age. The participation rate displays a countercyclical behaviour: during crises, households tend to increase their labour supply. As in other countries, there are sharp differences in the participation rates between men and women. Whereas today the participation rate of men is around 75 per cent, the participation rate of women is less than 60 per cent.
Figure 1 also portrays the evolution of the occupation rate: the proportion of people of working age who are working. More than half of the people of working age are working for each of the years under study. There is also some evidence of procyclicality in this indicator, since it reached its lowest level in 1999 and 2000, the hardest years of the Colombian crisis.
2.3. Informality definitions
One of the most prominent features of the Colombian labour market is the size and its informal sector. As mentioned earlier, one of the characteristics of the informal sector is that it is not covered by labour market regulations. However, it is not straightforward to measure the size of the informal sector. There are several ways of measuring informality, and the adoption of a particular definition in a country is often dictated by data availability. The most widely used definitions of informality are, on the one hand, associated with firm size and occupation. On the other, they are associated with the degree in which labour market regulations are enforced, particularly social security and pension contribution.
The first definition is based on a combination of the firm size and the workers’
occupation. The official definition of informality in the country follows the one proposed by the ILO.6 According to the Statistics Department, informal workers: (i) work in firms
with 5 or fewer employees; (ii) are business owners of firms with 5 or less employees;7 (iii)
6 The ILO´s definition of informality is drawn from the Fifteen and Seventeenth International
Conferences of Labor Statisticians in January 1993 and December 2003. According to Hausmanns (2004), this definition characterizes as informal: a) own-account workers employed in their own informal sector enterprises, most commonly measured through firm size; b) employers employed in their own informal sector enterprises; c) contributing family workers, irrespective of whether they
work in formal or informal sector enterprises; d) members of informal producers’ cooperatives; e)
employees holding informal jobs in formal sector enterprises, informal sector enterprises or as paid domestic workers employed by households. The definition of informal job is related with the fulfillment of labor regulations and the nature of the enterprise; f) Own-account workers engaged in the production of goods exclusively for own final use by their household.
7
are unpaid family aids and housekeepers; or (iv) are self-employed, with an educational level less than University or Technical education. In what follows, this definition will be referred to as the firm size and occupation criterion. Note that this definition does not measure directly the negative aspects associated with the informal sector, namely, lack of social security coverage.
We will also present measurements of the size of the informal sector that aim at measuring directly the failure to abide by the labour market regulations, particularly the non-contribution to social security. There are three main definitions of informality that can be calculated with the available data in the country, according to this criterion. First, we can measure informality as the failure to contribute to health insurance. According to Colombian Law, workers should individually contribute to social security (contributive regime). However, health insurance coverage is provided at the family level; if a worker is covered by health insurance, the spouse, children and parents are also covered. Therefore, covered spouses have low incentives to contribute since law-abiding families are taxed twice for health insurance. In addition, when individuals are considered poor, they are granted access to a subsidized health regime, where they have access to the services without having to contribute. The contributive and subsidized regimes are mutually-exclusive. Even though there used to be some differences in coverage and quality between the two regimes, a recent ruling of the Constitutional Court8 mandates that both regimes should have the same coverage. There are thus strategic incentives to belong to the subsidized regime since there is access to health coverage at no cost (Camacho et al, 2009 and (Calderón and Marinescu, 2011). In this paper we classify as informal all workers who are covered by spousal/family insurance or who work but are covered by the subsidized regime both because they are free-riders and because we cannot separately identify those who are informal by choice or by exclusion from the formal sector. This criterion of informality will be referred to as health contribution.
We also measure informality by the non-contribution to old-age protection or the pension system. In Colombia there is a public pay-as-you-go system, and a private account system. In this paper we consider all workers who do not contribute to either one of them as informal; the criterion is referred to as Pension. Finally, we combine the Health Contribution and Pension Contribution criterions: workers are formal if they contribute to both health and pensions. This criterion, Health and Pension Contribution, is the most comprehensive of the social security-related definitions.
Figure 3 shows that the informality rate has been fluctuating around 56 per cent according to the firm size and occupation criterion. To the naked eye, there is some evidence that informality measured in this manner has an anti-cyclical behaviour. Informality decreases during high-growth periods and increases during downturns: it rose to nearly 60 per cent during the 1998-2000 crisis, and it increased again in 2009 due to the international crisis. This counter-cyclical behaviour of the informality rate is interpreted as evidence of labour market segmentation. During recessions, Colombian firms reduce the number of workers, increasing the unemployment and informality rates. This implies that in Colombia the informal sector may have partially served as means to absorb economic shocks.
8
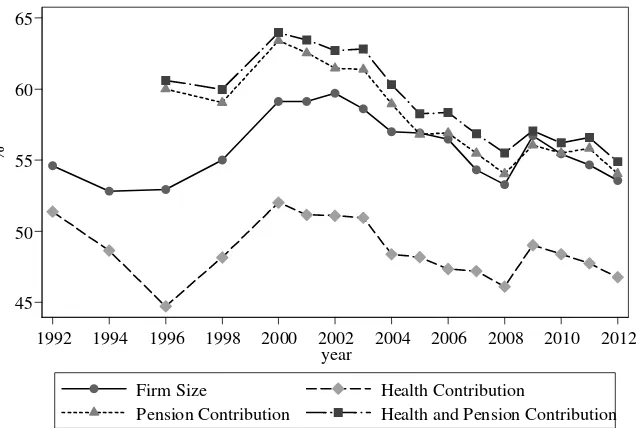
Figure 3 Informality rate by all definitions
Source: Household Surveys. Author’s calculations
Informality measured through the social security-related criterions has a very similar trend, peaking during downturns and decreasing during times of sustained growth. However, the informality levels vary greatly, according to the different definitions. Informality according to health contribution fluctuated around 47 per cent during the period under study: roughly 9 percentage points lower than the levels suggested by firm size and occupation.
The two final criteria, pension contribution, and the combined health and pension contribution, have a very similar level and trend. This is because most workers, who contribute to old-age protection, also contribute to health (Mondragón-Vélez et al., 2010). The informality rate measured by the pension and health contribution criterion was around 60 per cent at the beginning of the period under study. It reached 64 per cent in 2000 and has been mostly declining since, reaching 55 per cent at the end of the period. This captures the increase in coverage of the pension system, and the government’s efforts to enforce
pension contributions.
If the informal sector is the disadvantaged sector in a dual or segmented labour market, it should be countercyclical: decreasing during times of high growth and expanding during downturns to absorb displaced workers from the formal sector. Informality in Colombia has a negative correlation with GDP growth (and a positive one with unemployment): the size of the informal sector moves in opposite direction to the business cycle, suggesting segmentation in the labour market. Using the informality definitions of firm size and health contribution, we found that the correlation coefficient between informality and GDP growth is -0.22 and -0.11, respectively.
A final word on how the recent crises affected the Colombian labour market. Colombia has not very affected by the world crises that started in 2008. The GDP growth was 2.5 per cent for 2008 and only 1.5 per cent for the year 2009, which was a considerable reduction from the observed GDP growth rate in 2007, which was around 8 per cent. However the decrease in GDP growth did not directly translate into big changes in the labour market: the unemployment rate remained constant, and the informality rate decreased marginally.
45 50 55 60 65
%
1992 1994 1996 1998 2000 2002 2004 2006 2008 2010 2012 year
Firm Size Health Contribution
2.4.
Informality by subgroups of the population
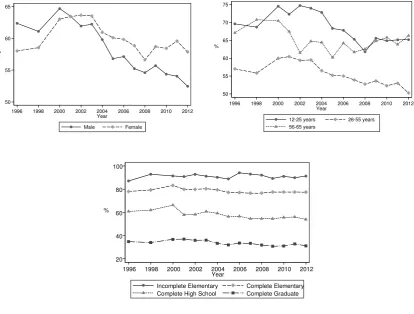
When analyzing the informality rates by subgroups of the population, we adopt the health and pension contributions criterion. Informality is higher for vulnerable groups. In particular, women are more likely to be a part of the informal sector than men, regardless of the informality definition. Figure 4 shows that starting in 2000 the informality rate of women who work is higher than that of men who work. The gap in the informality rates is different for each year, but in 2012 while 58 per cent of women were informal, only 52 per cent of men were informal. This implies that women are over-represented in the informal sector.
Figure 4 (a,b,c) Informality rate by health and pension contribution
Source: Household Surveys. Author’s calculations
The informality rate disaggregated by age groups shows that the oldest people have the highest informality rate, followed by the youngest workers (Figure 4). Prime-aged workers, that is, those between 26 and 55 years of age have the lowest informality levels. Informality is strongly correlated with the educational level. Unsurprisingly, the more educated workers have a higher probability of working in the formal sector while the less educated workers face a higher informality rate. The percentage of informal workers by education rate has remained stable throughout the study period, and therefore the differences between the different levels have remained stable. Around 90 per cent of workers with incomplete primary are informal; roughly 80 per cent of workers with completed primary education are informal; about 57 per cent of workers with completed secondary are informal and nearly 35 per cent of workers with completed tertiary education are informal. The fact that the informality levels for each education group remains fairly stable, while the informality rates are falling, suggests that it may be a change in the population composition that is driving the transformation: the percentage of people with completed secondary and even completed tertiary is rising, while the proportion of workers
50 55 60 65
%
1996 1998 2000 2002 2004 2006 2008 2010 2012
Year Male Female 50 55 60 65 70 75 %
1996 1998 2000 2002 2004 2006 2008 2010 2012
Year
12-25 years 26-55 years
56-65 years 20 40 60 80 100 %
1996 1998 2000 2002 2004 2006 2008 2010 2012 Year
Informality levels vary greatly across occupations and firm sizes. At the two extremes, domestic workers, unpaid family workers and the self-employed are mostly informal, and public sector workers are mostly formal. A high percentage of private sector workers (wage-earners) are formal, and contribute to health and pensions. Regarding firm size, the smaller the firm size, the higher the informality rate. Informality levels are highest for the self-employed (who work alone), and decrease a firm size increases. The informality level in big firms is negligible. This implies that the compliance of labour market regulations is easier in big firms, as expected, given that it is easier for small firms to stay below the
government’s radar.
2.5. Informality and contract type
The economic debate on segmentation, particularly in Europe, has been focusing on contractual segmentation, that is, on a situation with the co-existence of two types of labour contracts. First, we have full-time, open-ended contracts, dubbed regular contracts. These usually have a higher job quality and wages. Second, we have fixed-term contracts, sometimes referred to in the European literature as atypical employment. Under the latter, it is cheaper to dismiss workers. It is fair to say that in Colombia, and many developing countries, the bulk of workers with a written work contract (either open-ended or fixed-term) are in the formal sector, whereas workers with a verbal contract, or no contracts at all, are mostly in the informal sector.
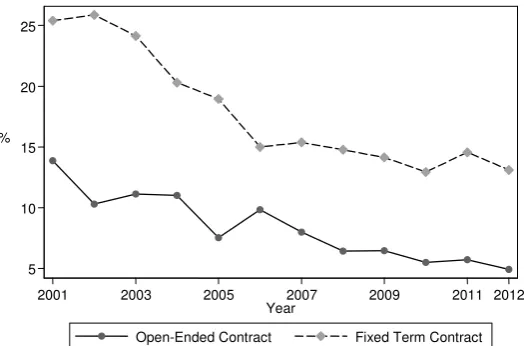
To analyze to what degree the discussion prevalent in European countries is also relevant in a country like Colombia, we use the information that the Household Survey started collecting in 2001, about the type of labour contract workers had: open-ended or fixed-term. Between 2001 and 2012, roughly 70 per cent of workers report having an open-ended contract, and the remainder have a fixed-term one. It is interesting to analyze the relationship between the type of contract and informality levels. Figure 5 displays the informality levels, measured by health and pension contribution, for workers under the two types of contracts. Workers under open-ended contracts have lower informality levels; about 10 percentage points lower than workers under fixed-term ones. In 2012, for example, the informality rate of workers with open-ended contracts was 5 per cent, while that of workers with fixed-term contracts was 15 per cent. In the same year, the average informality rate under the same criterion for the whole population was 55 per cent. Therefore, the informality levels among workers with a contract (both open-ended and fixed-term) are substantially lower than those of the rest of workers. Therefore, workers with a contract almost seem like two strata inside the formal sector.
Figure 5 Informality rate by health and pension contribution
Source: Household Surveys. Author’s calculations
5 10 15 20 25
%
2001 2003 2005 2007 2009 2011 2012 Year
Within the workers that have a written contract, the proportion of those with an open-ended contract has been declining during the past decade. There is anecdotal evidence that when workers with an open-ended contract retire, or they are fired, they are substituted by workers with a fixed-term contract.
2.6. Labour market segmentation
One way of determining whether a labour market is segmented is to study the relative sizes and returns to the formal and informal sector. Fiess et al (2005) develop a theoretical model to analyze labour market segmentation between two sectors. Their results suggest that in the absence of segmentation, the time series of the size and earnings of two sectors9 should move in the same direction. In this case, informal-sector employment would be associated with a voluntary choice. However, if the time series move in opposite directions it is seen as a sign that the labour market is segmented because this suggests restrictions to the mobility between sectors and involuntary transitions into the informal sector.
Figure 6 portrays the evolution of the relative sizes and earnings of the formal and informal sectors in Colombia between 1984 and 2012. The evolution of relative earnings is very telling. Formal-sector earnings were around 1.5 of informal-sector earnings until the
mid 90’s when they started to increase. They fluctuated around 2.3 of informal-sector earnings between 2003 and 2012. There is evidence of segmentation starting in 1993, probably because of the negative effects of Law 100 of 1993, which increased NWCs dramatically. The fact that the relative sizes and earnings in both sectors move in the opposite direction implies that both segments act as substitutes rather than as complements. Therefore, belonging to the informal worker is the result of market exclusion rather than an employee´s choice.
During the crises period, between 1997 and 2000, we find the starkest decrease in relative wages paired with the biggest increase in relative employment. However, this trend has been smoothed in the last years, due to the recovery of the Colombian economy and the overcoming of the institutional breakdown of the 90´s.
An alternative way of analyzing whether a labour market is segmented is to study the transition between the formal and informal sectors. If transitioning between the formal and informal sectors was easy, working in the informal sector could be interpreted as a desirable alternative. However, if transitions are not easy, informal workers may be trapped in the disadvantaged sector in a dual labour market.
We now describe the analysis performed in Mondragón-Vélez et al (2010) of the worker flows between the formal and informal sectors. To date, there are no panel surveys in Colombia that can be used to follow workers and their decisions to switch job and/or sectors. The Household Survey is a repeated cross-section. Using retrospective questions, such as job tenure and the duration of the unemployment spell between the previous and the current job, and the firm size and occupation in the previous job, we build the transitions within 12-month periods. The only definition of informality that can be built for the previous job is the official definition, based on firm size and occupation; there is no information on contributions to health insurance or pensions for the previous job. The analysis is restricted to workers who switched jobs during the previous year.
9 The authors develop their model with a tradable and non-tradable sector, but the idea can also be
Figure 6 Relative size and earnings between wage earners and the self-employed .7 .9 1.1 1.3 1.5 1.7 1.1 1.3 1.5 1.7 1.9 2.1 2.3 2.5 19 84 19 85 19 86 19 87 19 88 19 89 19 90 19 91 19 92 19 93 19 94 19 95 19 96 19 97 19 98 19 99 20 00 20 01 20 02 20 03 20 04 20 05 20 06 20 07 20 08 20 09 20 10 20 11 Year Relative Employment
(Left Axis) Relative Earnings(Right Axis)
Relative Size and Earnings between Wage Earners and the Self-Employed
Source: Departamento Nacional de Planeación, 2013
Figure 7 Transitions between the formal and informal sectors
Percentage of total job change (right axis)
Source: Mondragón-Vélez etal (2010)
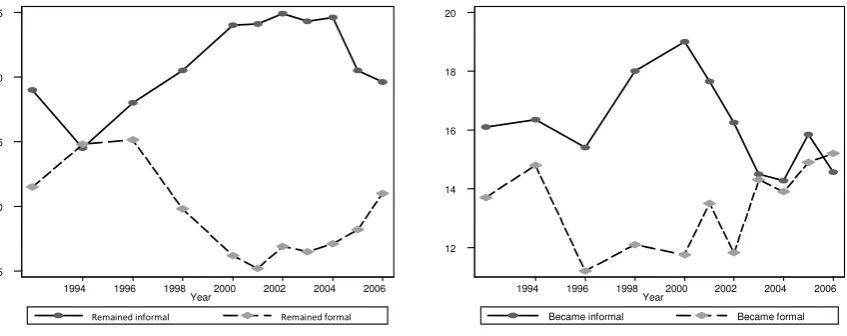
We present information on the transitions between sectors for the period 1986 to 2006. The total number of workers that switch jobs in a given year are divided into 4 categories: those who were formal, and remained formal, those who were informal and remained informal, those who were formal and became informal and those who transitioned from informality to formality. The percentages of each of these 4 flows add up to 1. The left panel of Figure 7, shows the percentage of workers who changed jobs in the previous year, but remained in the same sector they started in: the persistence of the sectors. The solid line captures the percentage of informal workers who remained informal. In 1986 this percentage was above 40 per cent, it decreased to 35 per cent in 1995, and then increased again, remaining in the 40 – 45 per cent range between 1998 and 2006. The dashed line captures the persistence of the formal sector. The persistence in the formal sector has the opposite behaviour. It was about 27 per cent in 1986, and it increased to 35 per cent 1995, to then decrease again and fluctuate roughly between 25 per cent and 30 per cent.
25 30 35 40 45
1994 1996 1998 2000 2002 2004 2006
Year
Remained informal Remained formal
12 14 16 18 20
1994 1996 1998 2000 2002 2004 2006
Year
The right panel of Figure 7 presents the flow between the two sectors. If the flow of formal workers into informality exceeds that of informal workers into formality, the informal sector expands. This was the case for all the years under study, except for 2006. The differences in the flows between sectors were particularly big between 1996 and 2002, which coincides not only with the period where informality grew, but also with the period where there were significant increases in NWC and in the minimum wage.
To complement the previous analysis, in Appendix 1 we present the transition matrices between the formal and informal sectors for the 2001-6 period,10 following the
same specifications as in Mondragón-Vélez et al. (2010). We first present the transition matrices as percentage of the initial situation. For example, the first row of the 2001 matrix states that 59 per cent of the workers who were formal remain in the formal sector, and the remainder switch to the informal sector. The results are further evidence of the segmentation of the Colombian labour market: informal-sector workers find it very hard to get a formal-sector job. Also, the probability of remaining in the formal sector has increased during this period. We then present the transition matrices portraying the flows in terms of number of workers. In line with these results, Prada (2012) analyzes the determinants of the transitions between sectors and finds that the basis of the switch from the formal to the informal sectors was the effect of involuntary release of past employment. This is further evidence of the segmentation of the Colombian labour market.
10
3. Institutional background
This section is composed of three main parts. First, we describe the evolution on NWC, and then turn to the evolution of the Minimum Wage. Finally, we describe the main features of the Colombian labour market legislation in the last decades.
3.1. The evolution of NWC
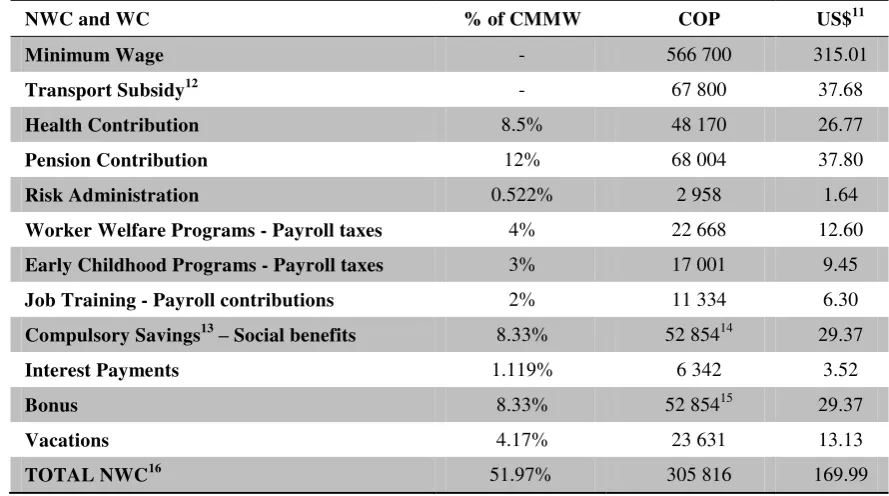
Today, NWC amount to approximately 51 per cent of the wage, and are composed by health and pension contributions, payroll taxes, severance payments and transportation subsidies, among others. For illustration purposes, Table 1 presents the components of NWC for 2012 measured in Colombian pesos, US dollars and as a percentage of the minimum wage.
Table 1 Non-wage costs
NWC and WC % of CMMW COP US$11
Minimum Wage - 566 700 315.01
Transport Subsidy12 - 67 800 37.68
Health Contribution 8.5% 48 170 26.77
Pension Contribution 12% 68 004 37.80
Risk Administration 0.522% 2 958 1.64
Worker Welfare Programs - Payroll taxes 4% 22 668 12.60
Early Childhood Programs - Payroll taxes 3% 17 001 9.45
Job Training - Payroll contributions 2% 11 334 6.30
Compulsory Savings13– Social benefits 8.33% 52 85414 29.37
Interest Payments 1.119% 6 342 3.52
Bonus 8.33% 52 85415 29.37
Vacations 4.17% 23 631 13.13
TOTAL NWC16 51.97% 305 816 169.99
Source: Suarez, 2012
As shown in Table 1 the NWC are 51.97 per cent of the minimum wage (not including transport subsidy), and the 53.97 per cent of the minimum wage including the extra money
11 The Exchange Rate used is 1 US$ = COP1798.98 (September 21, 2012).
12 Workers earning between 1 and 2 minimum wages are entitled to receive the transportation
subsidy.
13
Compulsory savings can be only used by the employee for educational or housing matters.
14 This value is obtained from the 8.33% of the minimum wage + transport subsidy.
15 This value is obtained from the 8.33% of the minimum wage + transport subsidy.
16 Includes all costs mentioned in the table except for the minimum wage and the transportation
paid in compulsory savings and service bonus due to the inclusion of the transport subsidy in the calculation of the interest in COP.17 The existence of these NWC implies that a little
over half the salary has to be provisioned for in addition to the actual wages, when hiring a worker. The wage is approximately two-thirds of the total monetary cost of creating a formal work post. This generates negative incentives for formal job creation.
Colombia structurally reformed the social security system in the early 1990s. Two regimes were created in health insurance: contributive (an employment-based mandatory insurance system) and subsidized. Before 1993, health insurance contributions amounted to 8 per cent of the wage, while after the reform contributions increased to 12 per cent. For wage-earners, the worker and employer share the burden, 4 per cent and 8 per cent, respectively, and the self-employed have to contribute the full amount. Pension contributions rose from 8 per cent to 13.5 per cent of the wage in a three year period for workers earning under 4 minimum wages, and those earning above 4 minimum wages have to contribute one additional percentage point (Santamaría et al. 2009). Therefore, Law 100 increased NWC by at least 9.5 percentage points.
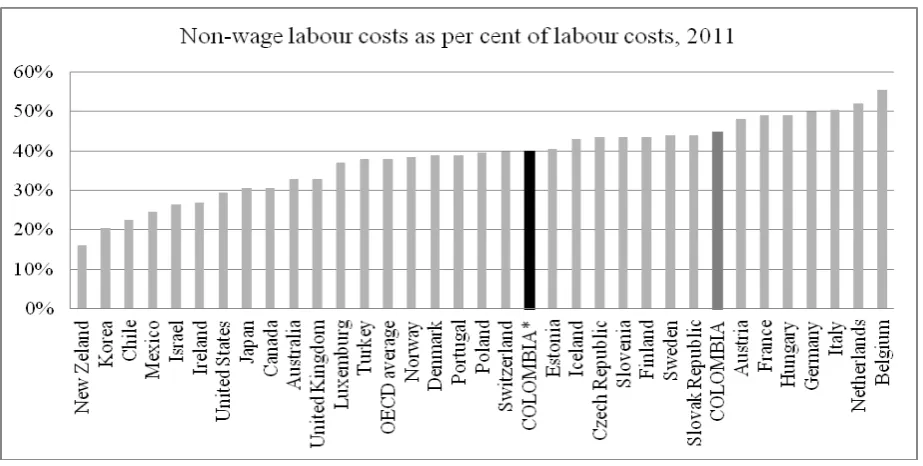
From an international perspective the Colombian NWC are high, even after the 2012 Tax Reform which decreased them substantially (Figure 8). In the United States and United Kingdom the NWC are between 30 to 35 per cent of the wage, in other countries of the OECD they are around 38 per cent (Joumard and Londoño Vélez, 2013). If we discount the holidays and compulsory savings from the data portrayed in Table 1, Colombia has comparable levels with Argentina and Uruguay, which determines the allocation of labour between formal and informal sectors (Gill et al, 2005).
Figure 8 Non-wage labour costs as per cent of labour costs
Colombia*: Colombia after tax reform. Source: Joumard and Londoño Vélez (2013)
17
There is some degree of pass-through of non-wage costs to wages in the Colombian manufacturing sector. However, because the additional costs are not completely shifted to workers via lower wages, this decreases formal employment: a 10 per cent increase in payroll taxes decrease formal employment between 4 and 5 per cent (Kugler and Kugler, 2008)
Law 100 of 1993 also establishes some design features of the social protection system which generates informality. As described in Bernal (2009), mandatory social security benefits are bundled together; some workers may opt out of the package and become informal, if they prefer partial over full coverage. In addition, it is optimal for some workers to remain informal because the quality of the services offered in the contributive and subsidized regimes is comparable, and the subsidized regime is free of charge (Camacho, Conover and Hoyos 2009). The transition between the formal and informal sectors is not easy, either: circumstantial evidence suggests that workers in the subsidized regime are reluctant to accept a formal job and enter the contributive regime, since re-entering the subsidized regime is time-consuming. Finally, workers classified as poor, and hence eligible for the subsidized regime, are also eligible for other of social programs. Because of the way in which the probability of being poor is calculated, by accepting a formal job, the worker and his family gain access to the contributive health insurance regime but decrease the probability to be classified as poor by the government, and thus, lose other benefits.
3.2. The evolution of the Minimum Wage
The minimum wage is the lowest wage that can be paid to a full-time employee per month. The 2012 minimum wage amounts to COP 566,700, which is approximately US$ 315.18 Yearly increases in the minimum wage in Colombia are negotiated between trade unions and employer’s guilds, under government supervision. The increases in the minimum wage are agreed upon consideration of several variables such as inflation,
productivity increases, workers and employers’ needs and general characteristics of the
economy among others. Since 1990 the minimum wage always increased in nominal terms,
but there was some fluctuation of the minimum wage in real terms until the late 90’s.
If we measure the real minimum wage in US Dollars, we see that it was about US$225 at the beginning of the period, and it has been steadily increasing, surpassing US$300 in 2012.
The minimum wage in Colombia aims at fulfilling many policy objectives: redistribution, ensuring that workers are able to purchase a minimum bundle of goods and services, protecting the employees from employer malpractices, to reduce income inequality and poverty and even as an anti-inflation tool. This had led to an increase in the minimum wage, reaching very high levels as compared to the average productivity in the economy, as is clear from Figures presented in this section.
The existence of high and binding minimum wages is also associated with higher unemployment levels. Figure 9 displays the municipal unemployment rates in the country
against how high the minimum wage is in the municipality ―as measured by the minimum to median wage ratio―. The two are negatively related which suggests that the higher
median earnings as a proportion of the minimum wage, the lower the unemployment rate.
18 The Exchange Rate used in the calculations in this section is $1 USD = $1800 COP, the
In other words, unemployment is higher in municipalities where the minimum wage is higher as compared to the median earnings in the municipality.
Figure 9 Unemployment vs. Median labour income as proportion of minimum wage
Source: Hofstetter (2012)
In Colombia increases in the minimum wage affect the free movement between the formal and informal sectors (Mondragón-Vélez et al., 2010). Also, according to Maloney & Nuñez (2004), increases in the minimum wage expulse people from the formal sector and workers are forced to either become an informal-sector worker or become unemployed. The
Colombian minimum wage ―as measured by the minimum to mean wage ratio― is the
highest as compared to OECD countries, as portrayed in Figure 10. Colombia’s minimum wage is around 70 per cent of the average wage, while it is less than 25 per cent in México, around 40 per cent in Brazil (the only other Latin American countries portrayed).
Figure 10 Ratio of minimum wage to average wage
Source: Joumard and Londoño Vélez (2013)
5 10 15 20 25
%
.4 .6 .8 1 1.2 1.4
Median Labour Income as Proportion of Minimum Wage
1985 1990 1995 2000 2002 2005
3.3. Legislation
The ruling institution over the labour market changed their status throughout the period of study. In 1990, Colombia had a Ministry of Labour, in charge of labour market regulations. In 2002, under President Uribe, the Health and Labour Ministries were joined together, in an effort to cut public spending. These two Ministries are separated again under President Santos, in 2011.
Since 1990 several reforms have been implemented in order to promote employment and decrease the size of the informal sector. Laws have changed the NWC along this period and have implemented subsidies as well as incentives to achieve their goals. These changes in the regulations of the labour market in Colombia have been of high magnitude in the developing of employment relationships and as a consequence have caused a serious impact
over the country’s segmentation.
As for the legislation the main reforms and laws that have appeared have address two main objectives. First, enhancing social protection for workers and fostering job creation. There are 3 main Laws issued between 1990 and 2012 that have affected the functioning of the labour market. They will be described in what follows.
3.3.1. Law 50 of 1990
19This Law introduced some changes to the Labour Code. It established the necessary
information to sign a contract (worker’s activities, wage and subordination relationship);
renewed the maximum duration of a fixed term contract; listed the main reasons for a contract cancellation; fixed the maximum duration of a trial period to 2 months; regulated the payments different than the wage, and regulated the working and non-working days, among others. These changes and extra regulations affected the labour market rules and generated several restrictions for the formalization of contracts. No subsidies or employment incentives were placed in this Law.
3.3.2. Law 789 of 2002
20Unemployment has been at the centre of the economic debate. Law 789 of 2002, approved at the end of the Pastrana government, enhanced the social protection system and allowed for the implementation of more flexible labour mechanisms (Núñez, 2005). Politicians and reformers aimed at addressing the underlying causes of unemployment by reducing the firms’ hiring costs. To compensate, they also provided the employees with better subsidies. The Law had 4 main components. First, generate resources to cover the immediate needs of unemployed, which includes the implementation of monetary subsidies, benefits and job training. Second, generate the right incentives for formal job creation (which implied a special contribution and a wage subsidy). Third, foster contract flexibilization, including the extension of working hours, the reduction of job security and a declining marginal surcharge for holidays. Finally, the creation and regulation of the Apprenticeship Contracts for the youth: apprentices can be paid wages below the minimum wage and if firms perform direct training, they can lower their taxes.
19 Law 50 of 1990 by which reforms are introduced to the Labour Code and other provisions are
dictated.
20 Law 789 of 2002 by which norms are dictated in order to support employment and expand social
3.3.3. Law 1429 of 2010
21This Law, known as the “Law of First Employment” or the “Formalization Law”,
appeared as a solution to the unemployment problem and the formalization issue. The main objective of Law 1429 was to formalize firms and workers, and generate new formal employment, thus enhancing the transitions between the formal and informal sectors. The idea was to foster formalization in the early stages of business creation by reducing its costs and simplifying the required paperwork. According to Colombia’s president, Juan Manuel
Santos, the law is a “progressive measure that will generate employment, increment formality, reduce paperwork and make us more competitive” (Dinero, 2011).
The reform helps firm formalization, by simplifying the firm formalization process, especially for Small and Medium Enterprises (SMEs). First, no income taxes for the first
two years of the firm’s existence and an applied progressiveness in the ensuing payments of
the tax; only until the sixth year of operation does the tax level paid reach 100 per cent. It also attempts to generate employment and reduce informality through fiscal incentives through the reduction of NWC for firms to hire women over 40 years of age and young, reinserted, displaced and disabled workers. Progressiveness is also applied in the payment of payroll taxes and the company registration fee. The benefit was provided exclusively to companies that increased the number of jobs and therefore promoted formal employment. Joumard & Londoño Vélez’s (2013) interpretation of the First Employment Law is that it encourages a process of firm destruction/creation to take advantage of the lower labour costs, which they suggest may be inefficient.
3.3.4. Tax Reform
Law 1607 of 2012, known as the Tax Reform, was approved on December 26th of
2012 to restructure the financing of the NWC in the formal sector. It shifts the financing of some of the government programs that amount to 13,5 percentage points of the NWC (Early Childhood, Job Training and the proportion that the employer contributes towards
health insurance) through additional taxes on the firm’s profits, dubbed ‘equality tax’. This
is a step forward in the same direction as Law 789 of 2002 and Law 1429 of 2010, and reinforces the positive effects of these reforms.
However, the Tax Reform drowns some of the efforts of the First Employment Law. While the First Employment Law reduces the NWC just for small firms who hire people younger than 28 and vulnerable people, the Tax Reform applies to all employers. The First Employment law establishes a tax relief on the revenue taxes for the firms who hire young or vulnerable people, while the Tax Reform increases the revenue taxes in order to compensate the fall in labour taxes. At the time being, it is not yet clear how the two laws will operate for the firms targeted in the First Law Employment. Given the similarities of the two reforms, it will be difficult to measure the impact of each one separately.
3.3.5. Enhancement of the Business Climate
Aside from labour market regulations, regulations in other areas may be relevant because of their potential effects on labour market segmentation or job creation, in particular those aiming at reducing compliance costs such as simplifying firm registration. One way of measuring this is through the Doing Business Indicator, which generates a ranking based on an aggregate measure of business regulations for local firms in 185
21
countries. The highest the ranking, the more conducive the regulatory environment to the starting and operation of a firm.22
Colombia, through a series of reforms, managed to improve its performance in the Doing Business Ranking in the last few years. In the 2008 report, Colombia ranked 66 out of 181 countries, in 2009 53 out of 183 countries, in 2010 it ranked 37 among 183 countries, in 2011 44 out of 185 countries and in 2012 45 out of 185 countries. In the Latin American region, Colombia is one of the leaders regarding reforms to enhance the business climate and in 2010 it was included (for the fourth consecutive time) as one of the 10 countries with the most reforms.
3.3.6. Legislation impact
The impact of the described legislation over the functioning of the labour market and the degree of segmentation is hard to measure. There are very few attempts to determine the impacts of the Law. The implementation of Law 789 of 2002 wasn’t as successful as expected. It had problems with resource availability, institutional integration, strength of requirements to access subsidies and weakness of formal incentives: the subsidy decreased 9 percentage points from the total 56,3 p.p. of NWC prevalent 2001, for only 4 months. As a result the incentives seemed small considering the size of the NWC (Peña, 2012).
The difficulty to access the apparently small benefits of the Law suggests that the Law had minor impacts on the labour market. The Observatorio del Mercado de Trabajo y la Seguridad Social (2003) highlighted a limited effectiveness in the short term and Gaviria (2004) suggests that the increased of regular working hours only augmented working hours of the same workers, reducing sub-employment but generating an almost null effect job creation. As a consequence, there is little evidence that Law 789 had a substantial impact on promoting formalization.
It is still early to tell what the effects of the Law 1429 of 2010 (Formalization Law) are, especially because of the slow reglementation process. The reforms captured in the Doing Business ranking are likely to generate new formal jobs, rather than formalizing existing jobs. There are to date no systematic evaluations of these reforms. These measures are expected to generate a positive effect over formalization. Even though no causal arguments can be made, the number of firms receiving the benefits (290,703), the number of firms reactivated (89,982), recently formalized firms that belonged to the informal sector (63,802) and creation of new formal firms (136,919) are good omens (Peña, 2012). However, starting in 2010 formal employment started to grow faster than informal employment for the first time in over a decade. The Tax Reform was approved on December 26th of 2012, and is still in the process of reglementation, so its effects will be
apparent in years to come. However, as pointed out by Joumard & Londoño Vélez (2013) despite the reduction in NWC, they are still high at an international level, and therefore the expected effect on the size of the informal sector is limited.
Given the design of the reforms passed in the country, it is hard to establish their causal effect.
22
4. Labour market rigidities, wedges and segmentation
Labour relationships in Colombia are regulated by the government through legislations to ensure fair conditions for employer and employees. High levels of NWC and the minimum wage characterize the Colombian labour market. In Colombia the coexistence
of high levels of NWC and minimum wage reinforce each other’s negative effects.
High NWC introduce wedges in the labour market. If NWC increase, employers find labour relatively more expensive than capital. They can either pass the additional cost to employees via lower wages, or change the labour-to-capital ratio, destroying formal jobs. In the presence of a high and binding minimum wage, there is a nominal downward rigidity of wages that prevents employers from passing on NWC to workers via prices. This generates additional formal job destruction. As the formal sector contracts, more workers, especially low-skilled ones, are forced into informality or unemployment. Formal working posts are also destroyed because of increases of the minimum wage beyond price and productivity growth; formal sector firms destroy working posts whose productivity levels lie between the old and new minimum wage level.
Labour market rigidities and wedges affect the functioning of the labour market and have an effect on the quality and quantity of jobs. Formal workers are protected through several regulations, but those who do not manage to procure a job in the formal sector are forced to join either the informal sector or become unemployed.
According to Alm and López-Castaño (2005) payroll taxes generate a re-shuffling of workers from the formal to the informal sector, reducing their protection quality, their access to social security services and the access to legal support: increases of 2 per cent in payroll taxes generate the loss of 52,000 formal working posts. Bernal and Cárdenas (2004) suggest that a reduction of 9 per cent of these taxes could increase urban employment by 1.3 per cent. Supporting their results, Heckman and Pagés (2004) conclude that increasing social security contributions increases unemployment. Sánchez F. et al., (2009) find that that increasing payroll taxes and other labour market rigidities (such as the minimum wage) generate high turnover for workers in the informal sector, destruction of formal working posts and longer unemployment duration.
The presence of a high and binding minimum wage makes the labour market more rigid. Labour demand and supply cannot move freely in order to achieve a natural equilibrium and in particular, it affects the economy’s alternatives to adjust during economic downturns: if they cannot adjust by decreasing the wages, the adjustment will be made through the destruction of formal posts. In Colombia the minimum wage is a high percentage of the average wage. Roughly 40 per cent of workers in the 13 main cities earn wages equal to or less than the minimum wage. This implies that workers with lower productivity, typically low-education workers, will be left out of the formal sector. This is partly why low productivity workers are over-represented in the informal sector and in unemployment. According to Sánchez et al. (2009), an increase in the minimum wage increases the unemployment rate by 0.248.
Mondragón-Vélez et al. (2010) estimate the effects of the increases in labour market rigidities, namely NWC and the minimum wage, on the size of the informal sector and the transitions between formal and informal sectors, while at the same time controlling for the effects of the business cycle. The authors first use the information between 1984 and 2006
to estimate a worker’s probability of being informal according to individual characteristics,
implies an increase of 2 percentage points in the probability of being informal. They repeat the estimation for low and high skilled workers. While increases in NWC increase the probability of being informal for all workers, the minimum wage has differential effects: an increase in the minimum wage increases the probability for low skilled workers, and decreases the probability of being informal for high skilled ones. Therefore, increases in the
5. Segmentation and Job Quality
There are big differences in the quality of jobs between the formal and informal sectors. Formal workers contribute to pensions and thus will be covered in old age, they contribute to health insurance and frequently receive a better quality of health services.23
Formal workers earning between 1 and 2 minimum wages earn a transportation subsidy and receive uniforms 3 times a year, among other perks. Workers in the informal sector are not contributing to pension, and most likely will not have access to a pension when the time comes. They lack legal protection and they may or may not have access to health insurance; it depends on whether they are classified as poor.
Earnings in the two sectors are very different. People in informal sector earn less than those in the formal sector: the average informal earnings were between 45 per cent and 55 per cent of formal earnings between 1986 and 2006 Mondragón-Vélez et al (2011). During the 1998-2000 recession in Colombia, informal sector wages lost 20 percentage points as compared to formal sector wages. While the informal wages grew less rapidly than the formal sector wages, there was a decline in formal employment while informal employment increased. It resulted in a rise of the relative size of the informal sector which can be interpreted as evidence of a segmented labour market, where labour in the informal sector is not desirable in terms of returns, but workers have access to it due to lack of alternatives in the formal sector. In other words, the increase of informality in Colombia has been reflected in lower relative wages for workers in the informal sector with respect to those working in the formal sector (Mondragón-Vélez et al., 2011).
Working in the informal sector is negatively correlated with job duration and job satisfaction. Job duration is one of the key factors of job quality. In this paper, we study the differences in job duration between formal and informal workers (using the health and pension contribution definitions), between 2001 and 2012.24 Before 2007 job duration was higher for formal workers: roughly 7 years as compared to roughly 6 years for informal workers. However, starting in 2007, job duration has been virtually the same for formal and informal workers (Figure 11). This is surprising and coincides with the latest global downturn. Worker turnover increase in the formal and informal sectors, but it did so more in the formal sector.
Workers in the informal sector also have lower job satisfaction, measured as the percentage of workers who want to change their current job.25 Between 2001 and 2012, the percentage of workers from the informal sector that want to change their job has fluctuated between 35 per cent and 40 per cent. In contrast, only between 17 per cent and 23 per cent of formal workers want to change their jobs. This suggests that workers in the formal sector are more satisfied with their jobs. There is no evidence that the 2008 crisis affected job satisfaction, as measured by the percentage of workers who want to switch jobs.
23 Despite the unification of the contributive and subsidized regimes in terms of coverage in the letter
of the law, there may still be some quality advantages in the contributive regime.
24
The health and pension contribution criterion can only be calculates starting 1998. In 2000, the Statistics Department changed the way they asked the question about duration on the job, and therefore, the data in 2000 is not comparable to 2001 onwards. That is why we only present calculations for the 2001-2012 period.
25
Figure 11 Average duration at current job
Source: Household Surveys. Author’s calculations
One possible measure of job satisfaction could be how much the worker wants to change the current job. We build a dummy variable that takes one when the worker wants to change the current job and zero when he does not, and estimate the determinants of