Structural Change and Economic Dynamics 11 (2000) 371 – 392
Productivity growth in Asian manufacturing:
the structural bonus hypothesis examined
Marcel P. Timmer
a,*, Adam Szirmai
baGroningen Growth and De6elopment Centre,Faculty of Economics,Uni6ersity of Groningen, P.O.Box800,9700AV Groningen, The Netherlands
bEidenho6en Centre for Inno6ation Studies,Eindho6en Uni6ersity of Technology,PO Box513,
5600MB,Eindho6en, The Netherlands
Received 17 December 1999; received in revised form 1 January 2000; accepted 1 March 2000
Abstract
This paper examines the role of structural change in explaining aggregate productivity growth in the manufacturing sector of four Asian countries over the period 1963 – 1993. The conventional shift-share analysis is used to measure the impact of shifts in both labour and capital inputs. The results do not support the structural-bonus hypothesis, which states that during industrial development, factor inputs shift to more productive branches. This finding is robust, even when the conventional shift-share analysis is modified to take into account increasing returns to scale as described in Verdoorn’s law. It is argued that improvements in productivity levels were widespread and depended negatively on the distance from the global technology frontier, confirming the Gerschenkronian notion of catch-up. © 2000 Elsevier Science B.V. All rights reserved.
Keywords:Structural change; Productivity; Shift-share analysis; Asia
www.elsevier.nl/locate/strueco
1. Introduction
Processes of modern economic growth and catch up do not merely involve a significant increase in productivity levels, but also entail changes in the distribution of inputs and outputs across sectors. Kuznets stated that ‘it is impossible to attain high rates of growth of per capita or per worker product without commensurate
* Corresponding author.
E-mail address:[email protected] (M.P. Timmer).
substantial shifts in the shares of various sectors’ (Kuznets, 1979, p. 130). The hypothesis that structural change is an important source of growth and productivity improvement, is a central tenet of the growth-accounting literature (Maddison, 1987) and is derived from classical models of a dual economy (Lewis, 1954). Assuming the existence of surplus labour in some parts of the economy, a shift of labour towards modern industry will be beneficial at the aggregate level, as workers with low productivity will be put to more productive uses. Various studies have shown that this shift has been an extra source of aggregate productivity growth in addition to any sectoral productivity growth in many countries (see Syrquin, 1984, for an overview). The field recently attracted new attention in attempts to explain the East Asian miracle (Lucas, 1993; Young, 1995; Nelson and Pack, 1999).
Most studies focus on the shift from agriculture to manufacturing and have little to say about the importance of shifts within the manufacturing sector. Nevertheless, the industrial development literature suggests that in the course of economic growth, labour and capital shift from less productive manufacturing branches towards more productive branches. As a consequence, aggregate productivity growth in the manufacturing sector will be boosted in addition to any intra-branch growth. We call this the ‘structural-bonus hypothesis’. Using data for 13 manufac-turing branches, the hypothesis is tested in this paper for four rapid growing Asian countries: India, Indonesia, South Korea and Taiwan for the period from 1963 to 1993. Use is made of the conventional shift-share analysis introduced by Fabricant (1942) to analyse productivity effects from shifts of labour. The method was extended by Massell (1961) to incorporate shifts in labour and capital simulta-neously. The shift-share methodology is still a popular tool to decompose aggregate productivity growth (see Paci and Pigliaru (1997) or Fagerberg (1999) for recent applications).
One of the main criticisms of the conventional shift-share analysis is the neglect of increasing returns to scale as described in the Verdoorn Law (Verdoorn, 1949). As stressed by Kaldor (1966), increasing returns include both static returns due to processes of labour division and specialisation in growing sectors and dynamic effects as technical progress is fostered by output growth. Because they feature prominently in many endogenous growth models, the study of increasing returns to scale recently attracted renewed attention (Fingelton and McCombie, 1998; Harris and Lau, 1998). If returns to scale differ across sectors, as argued by Kaldor and inputs shift to the sectors with higher returns, the effects of structural change on productivity growth are bigger than indicated by the conventional shift-share analysis. This paper proposes a modified shift-share analysis which takes into account Verdoorn effects. Using estimates of sector-specific effects, the importance of structural change for aggregate productivity growth can be better assessed. The remainder of the paper is organised as follows.
373 M.P.Timmer,A.Szirmai/Structural Change and Economic Dynamics11 (2000) 371 – 392 account not only shifts of labour, but also shifts of capital. In Section 6, a variety of possible sources for biases in the conventional shift-share analysis are discussed, focusing in particular on the implications of the Verdoorn Law. We propose a modified shift-share analysis in Section 7 that explicitly takes into the account dynamic scale effects of Verdoorn. This decomposition formula uses branch-specific estimates of the Verdoorn effect to measure the importance of structural change for aggregate productivity growth.
2. The structural-bonus hypothesis for manufacturing
Explicitly or implicitly, the structural-bonus hypothesis is present in many models of industrial development. Since the empirical work of Hoffmann (1958) and Chenery et al. (1986), the standard perception of industrial development is a general shift in relative importance from light to heavy industries. Light industries have relatively low ratios of capital to labour, while heavy industries have relatively high ratios. As more capital-intensive activities have normally higher levels of labour productivity, this shift from light to heavy industries will generate extra labour productivity growth at the aggregate level. Another often used characterisation of industrial development is in terms of a sequence of early, middle and late industries, where early industries are associated with low productivity activities and low levels of technological sophistication (Chenery and Taylor, 1968; Syrquin, 1988). Here, the emphasis is on demand factors, with early industries catering to basic domestic needs such as foodstuffs and textiles, middle industries focusing on intermediate inputs, such as non-metallic minerals and chemicals, and late industries producing investment goods and sophisticated consumer durables. The shift from early to middle and late industries is also referred to as a process of technological upgrading and is supposed to generate a bonus for aggregate productivity growth in the manufacturing sector.1
More recently, Harberger (1998) presented a general vision of the growth process in which economic growth is driven by a ‘mushroom-process’. In a ‘mushroom-pro-cess’, economic growth is characterised by continuous shifts of resources into specific dynamic sectors. This is contrasted with a ‘yeast-process’ in which econ-omy-wide growth tendencies predominate. Harberger’s analysis implies that pro-ductivity growth rates vary considerably across industries and factor inputs move to faster growing industries. Structural change is also a fundamental component of the model presented by Nelson and Pack (1999) to describe the evolution of countries such as South Korea and Taiwan. In their two-sector model, aggregate productivity growth is driven by expansion of the modern sector. The modern sector uses more productive technologies and has a higher profitability than the traditional craft sector, but its growth is determined by the effectiveness of entrepreneurial response
1The classical argument primarily refers to labour productivity, arguing that the advanced sectors of
to these opportunities. According to Nelson and Pack (1999), the response in East Asia was much higher than in most other developing countries due to, among others, a more stimulating policy environment and a greater availability of educated labour. More formal models of (industrial) development, either from the supply side as in Lucas (1993) or from the demand side as in Verspagen (1993), also tend to stress the importance of structural change for productivity growth. Specialisation in a limited number of expanding, technologically dynamic branches boosts aggregate productivity additional to any intra-industry growth. Another line of reasoning in favour of the structural-bonus hypothesis refers to the beneficial effects of structural changes induced by liberalisation of the economy. When a country liberalises its domestic markets and opens up to international trade and foreign direct investment, neo-classical theory predicts that factor inputs move towards more productive and efficient activities. South Korea and Taiwan gradually liberalised domestic and international trade markets in the 1960s and 1970s and India and Indonesia in the 1980s. Hence, we expect to find evidence in favour of the structural-bonus hypothesis, if not for labour productivity then at least for total factor productivity growth.
3. Data description
In our analysis of the structural-bonus hypothesis, we use data on value added, labour input, capital input and the share of labour compensation in value added for 13 manufacturing branches which are taken from various national sources. The 13 branches correspond to ISIC two-digit divisions or groups of three-digit major industries.2
For India, Indonesia and South Korea, data on value added is derived from annual industrial censuses deflated by branch-specific wholesale price indices from the national accounts. Numbers of persons employed are taken from the industrial census. For Taiwan, value added at constant prices is derived from the national accounts and employment from the annual labour survey. Capital stocks have been estimated according to the perpetual inventory method using annual investment data from the census in the case of India and Indonesia and from the national accounts in the case of South Korea and Taiwan. Data on India refers to the so-called registered sector that includes establishments with 20 employees or more and establishments with ten to nineteen employees that use electrical power. Data on Indonesia refers to establishments with 20 employees or more and data on South Korea to firms employing at least five workers. Data on Taiwan refers to all establishments. The complete data set is given and described extensively in Timmer (2000).
The hypothesis that structural change in manufacturing is an important source of aggregate productivity growth involves two important basic assumptions. First,
2The 13 branches are the following: food, beverages and tobacco (isic 31), textile mill products (321),
375 M.P.Timmer,A.Szirmai/Structural Change and Economic Dynamics11 (2000) 371 – 392 there have to be major shifts in the distribution of factor inputs over time. Second, productivity levels and growth rates must differ considerably across manufacturing branches. It is well known that in the East-Asian countries profound changes have taken place in the industrial structure since 1963, with an increasing share of heavy industries and especially of the electrical machinery branch and a declining share of food manufacturing and textiles. In India and Indonesia, industrial growth did not typically involve a change from light to heavy industries. Due to the emphasis on self-reliance after independence, India had already developed a sizeable heavy industry in the 1960s, alongside a large textile sector the importance of which dwindled in the 1980s. In Indonesia the industrial sector only started to develop in the 1970s. In the 1990s, the larger part of manufacturing output is still being produced in the light industries. Within light industry, the importance of food and rubber manufacturing declined rapidly in favour of growth in branches such as textiles and wearing apparel.3
Huge factor shifts combined with a large variance of productivity levels and growth rates across branches suggest a potentially important role of structural change as a source of productivity growth.
4. Impact of structural change on labour productivity growth
To assess the contribution of structural change (resource reallocation among sectors) to the growth of aggregate productivity, a method known as the shift-share method is often used (see Syrquin (1984) for an overview and Paci and Pigliaru (1997) or Fagerberg (1999) for recent applications). In the shift-share analysis, aggregate productivity growth is decomposed into effects due to productivity growth within sectors and effects due to structural change. The decomposition was pioneered by Fabricant (1942) who was interested in measuring labour require-ments per unit of output, but later users of his method focused more on its reciprocal: labour productivity.
Let LP denote the labour productivity level, subscript i denote manufacturing branches (i=1, . . .n, with n the number of branches), Si the share of branchi in total manufacturing employment and superscripts 0 andTthe begining and end of the period (0,T). Then aggregate labour productivity at time Tcan be written as:
LPT=Y
Using Eq. (1), the difference in aggregate labour productivity levels at time 0 and Tcan be written as:
3See Timmer (2000) (Chapter 7), for a detailed description of industrial development patterns in these
Dividing both sides of Eq. (2) by LP0, it follows that aggregate productivity
growth can be decomposed into intra-branch productivity growth (the first term on the right-hand side) and the effects of structural change which consist of a static shift effect (the second term) and a dynamic shift effect (the third term). Whereas the static shift effect measures productivity growth caused by a shift of labour towards branches with a higher labour productivity level at the beginning of the period, the dynamic shift effect captures shifts towards more dynamic branches, i.e. branches with higher labour productivity growth rates. The last term is an interaction effect that arises because of the use of a discrete fixed weight decompo-sition. One could use mean weights to eliminate this term, as in Syrquin (1984), but we retain it because this term can be given an interesting economic interpretation. As branches differ not only in terms of productivity levels, but also in terms of productivity growth rates, resource reallocation has both static and dynamic effects and a distinction between the two is useful.4
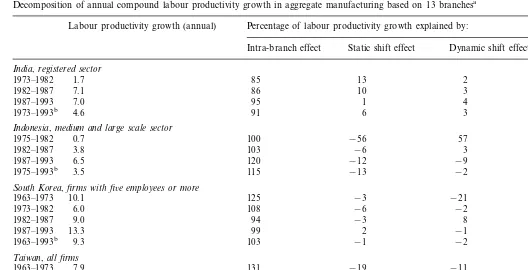
The results of the decomposition of aggregate manufacturing labour productivity growth are reported in Table 1. For each country and each of the four subperiods, the annual growth rate of labour productivity in total manufacturing is given in the first column. The other columns show the percentages of this growth, which are explained by growth in labour productivity within branches and by shifts in labour shares across branches. Note that a change in labour shares does not necessarily involve a physical transfer of employees from one sector to another. This depends on the overall growth of the manufacturing labour force. In an expanding manufac-turing sector, shares may change while employment is increasing in all branches. The overriding conclusion derived from Table 1 is that the structural-bonus hypothesis for labour productivity should be rejected for the manufacturing sector. Labour reallocation has been unimportant in explaining labour productivity growth in aggregate manufacturing. On the contrary, structural change often involved a shift of labour to branches that had both lower productivity growth rates and levels. As such, in most periods it was a drag on aggregate labour productivity growth, rather than a bonus.5 This is most clear in the case of Indonesia. During
1975 – 1993, labour shares in branches with above-average labour productivity levels rapidly declined, as comparative advantage was realised in more labour-intensive manufacturing activities. Structural change decreased labour productivity growth by :15% in the whole period. For India, the effects of structural change were
positive but small. A major shift of labour to the chemical branch took place and this contributed positively to aggregate labour productivity growth in the 1970s (15%), but over the period 1973 – 1993 structural change contributed only 9%.
In South Korea and Taiwan, profound changes in the structure of the manufac-turing sector have taken place and labour productivity grew at a rapid pace.
4The size of the interaction effect will of course depend on the length of the period under
consideration because it vanishes when the length approaches 0 (see next footnote also).
5This result is robust to the various ways in which the structural decomposition formula is applied.
377
Decomposition of annual compound labour productivity growth in aggregate manufacturing based on 13 branchesa
Labour productivity growth (annual) Percentage of labour productivity growth explained by:
Total effect Intra-branch effect Static shift effect Dynamic shift effect
India,registered sector
Indonesia,medium and large scale sector
57 100
South Korea,firms with fi6e employees or more
10.1 100
aDecomposition of labour productivity growth into part due to labour productivity growth in branches (intra-branch effect) and shift of labour between branches (shift effects) using Eq. (2). Percentages may not add to 100 due to rounding.
bThe decomposition for the total period is given by a weighted sum of the sub-periods’ effects.
However, even for these countries shifts of labour were not important in explaining aggregate labour productivity growth. The contribution of labour shifts in the period 1963 – 1993 was even slightly negative in both countries, though the impact varied during the different phases of development. Especially in the early period (1963 – 1973), labour shifts had large negative effects, both static and dynamic. Also in the period after 1973, structural change did not play an important role in determining aggregate labour productivity growth, whether positively or negatively, with the exception of Taiwan in the most recent period (1987 – 1993).6
The finding of negligible or even negative contributions of structural change to aggregate labour productivity growth in manufacturing is not typical only for the developing countries studied here. Dollar and Wolff (1993) in Chapter 8 found similar results for the manufacturing sectors in Brazil, Hong Kong, Singapore and Thailand. Within manufacturing, there is no structural bonus comparable to that involved in the shift from agriculture to industry. However, the analysis so far is incomplete. The labour productivity measure of structural change as presented in this section is a partial measure, as it does not consider other inputs besides labour. In the next section we consider shifts of labour and capital simultaneously.
5. Impact of structural change on total factor productivity growth
In this section we measure the impact of sectoral changes in both labour and capital shares on aggregate total factor productivity growth. Syrquin (1984) provides a good discussion of the various accounting methods, building on the pioneering work of Massell (1961). In our discussion below, we draw heavily on Syrquin’s exposition. Using a Cobb – Douglas production function with constant returns to scale and disembodied Hicks-neutral technical change, growth of output of sector i is given by
Y: i=6iL:i+(1−6i)K:i+A: i (3)
whereLiis labour input,Kiis capital input,6iis the labour share in value added and Aiis the level of total factor productivity (TFP) in sector i. Using Eq. (3), aggregate
output growth can be rewritten as the summation over all sectors (in continuous time)
Y: =%
i
riY:i=% i
ri6iL:i+%
i
ri(1−6i)K:i+%
i
riA:i (4)
whereri=Yi/iYi, the share of sector i in aggregate output.
7
Aggregate growth can also be calculated directly from aggregate variables
6During this period an important restructuring of the manufacturing sector took place due to
low-wage competition from other Asian countries. Labour was reallocated towards more productive and more dynamic branches such as the metal and non-electrical machinery branches. This resulted in positive shift effects, accounting for 20% of aggregate labour productivity growth.
7This is only true if aggregate output in constant prices is equal to the sum of branch output at
379 M.P.Timmer,A.Szirmai/Structural Change and Economic Dynamics11 (2000) 371 – 392
Y: =6L: +(1−6)K: +A: (5)
where Y=iYi, L=iLi, K=iKi, 6=i6i and A denoting TFP growth esti-mated directly at the aggregate level. Aggregate TFP growth relative to sectoral TFP growth includes the extra output generated by a shift of factors to more productive uses. This extra output is not due to technical change within branches and was termed inter-industry technical change by Massell (1961) to distinguish it from intra-industry technical change as measured by sectoral TFP growth rates.8
The difference between aggregate TFP growth and output-weighted sectoral TFP growth is referred to as the total reallocation effect (TRE) and can be calculated as follows using Eq. (4) and Eq. (5)
TRE=A: −%
i
riA: i=%
i
ri6il:i+% i
ri(1−6i)k;i (6)
whereli=Li/Lthe sector share in aggregate labour, andki=Ki/Kthe sector share in aggregate capital. The first part on the right hand side indicates the effects of changes in labour shares on aggregate total factor productivity growth and the second part indicates the effects of changes in capital shares. Eq. (6) can be rewritten to highlight that factor shifts only augment TFP growth in the case of disequilibrium:
TRE=1
Y%i
L:i(fLi−fL)+
1
Y%i
K:i(fKi−fK) (7)
where fL
i and fKi are the marginal productivity of labour, respectively capital in
sector i andfL andfK, the economy-wide averages. If labour and capital increases more in sectors with above average marginal productivity, the total reallocation effect will be positive.
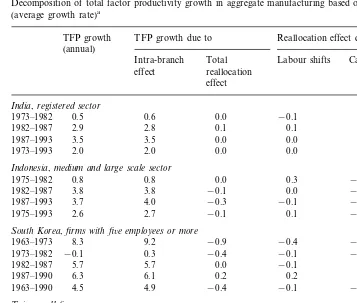
In Table 2 we report the results of the TFP growth decomposition. For each country the first column shows the annual growth rate of TFP in aggregate manufacturing according to Eq. (5). This is decomposed into the output-share weighted TFP growth rates of the thirteen individual branches (the intra-branch effect) and the effect of reallocation of factor inputs across branches. The total reallocation effect is estimated by Eq. (6). The results are given in the second and third column.
We find that for total factor productivity growth the structural-bonus hypothesis also has to be rejected, even more strongly than in the case of labour productivity. This is because labour shifted towards branches with higher labour productivity levels and growth rates, based on higher capital – labour ratios. The TFP decompo-sition corrects for this whereas the labour productivity decompodecompo-sition in the previous section does not. In India, aggregate total factor productivity growth was completely due to TFP increases in individual branches. In all sub-periods, realloca-tion of factor inputs never contributed\0.1% point to aggregate TFP growth. The
same is true for Indonesia, where factor reallocation even contributed negatively in most periods. Even in the latest period of trade liberalisation, reallocation had no
8Massell does not make a distinction between TFP growth and disembodied technological change. We
positive effect on aggregate TFP growth. During 1963 – 1993, annual TFP growth in Taiwan was on average 2.0% of which only 0.3% was due to shift effects. As for labour productivity, the highest reallocation effect was found in the latest period. In South Korea, reallocation of labour and capital even contributed negatively over the period 1963 – 1990.
The total reallocation effect is further decomposed into a labour- and a capital-shift effect according to Eq. (6). This is given in the fourth and fifth column of
Table 2
Decomposition of total factor productivity growth in aggregate manufacturing based on 13 branches (average growth rate)a
TFP growth TFP growth due to Reallocation effect due to (annual)
Intra-branch Total Labour shifts Capital shifts effect reallocation
Indonesia,medium and large scale sector
−0.3
South Korea,firms with fi6e employees or more
−0.4 −0.4
1963–1973 3.3 3.1 0.2 0.2 0.0
0.2 0.4
1963–1993 2.0 1.7 0.3 0.3 0.0
aDecomposition of total factor productivity growth into part due to total factor productivity growth
in branches (intra-branch effect) and shifts of factor inputs between branches (shift effect) using Eqs. (5) and (6). Figures may not add up due to rounding.
381 M.P.Timmer,A.Szirmai/Structural Change and Economic Dynamics11 (2000) 371 – 392 Table 2. The results show that the total reallocation effects are mainly due to shifts in labour rather than in capital, but the effects are small in both cases. Concluding, neither shifts of labour nor of capital provide an additional bonus to aggregate TFP growth in the manufacturing sector of the Asian countries.
6. Critical evaluation of the conventional shift-share analysis
Measuring the contribution of resource reallocation to productivity growth by the conventional shift-share method (using only shifts of labour or also shifts of capital) needs some qualifications. First of all, the shift-share analysis is supply-side oriented and focuses on the effects of changes in the distribution of factor inputs. Changes in demand are taken as exogenously determined and the role of demand effects as such is ignored. Irrespective of the contribution of structural change to aggregate productivity growth, structural change is an important aspect of economic develop-ment. As pointed out by Pasinetti (1981), income elasticities for various goods differ and change over time as per capita income increases. This inevitably implies non-proportional expansion of demand and offers different opportunities for sectors to grow. Industries that are confronted by demand barriers to further growth need to shrink in favour of new industries, although a decline in domestic demand can be partly offset by producing for international markets, especially in the case of agricultural and manufactured goods. These demand-side aspects are not taken into account in the shift-share analysis. It uses an accounting identity in which output changes are taken as given. What the shift-share analysis does show is that the shifts in inputs that have taken place, whether or not driven by developments on the demand side, appear not to be important in quantitative terms for aggregate productivity growth.
However, the conventional shift-share analysis is based on a number of assump-tions of which the invalidity can result in an under- or overestimation of the contribution of structural change to productivity growth. The problematic assump-tions involve the aggregate level of analysis, the assumption of marginal productivity equal to average productivity, the assumption of input homogeneity, the incidence of spillovers and the causal links between growth of output and productivity.
First of all, due to the aggregate level of analysis, the real importance of resource reallocation might be underestimated. Although this is a fairly disaggregated study, factor reallocation within our 13 manufacturing branches is not accounted for. However, our findings are corroborated by a recent more detailed study of productivity growth in Indonesian manufacturing. Using data on 28 branches, Aswicahyono (1998) (Table 5.6) found that reallocation of labour and capital had only minor positive or even negative effects on aggregate TFP growth. Using firm-level data, Aw et al. (1997) found that growth of aggregate TFP in Taiwan was mainly due to productivity growth of incumbent firms. These findings support our conclusions on the absence of the structural bonus in manufacturing, based on more aggregate data.
underestimation of the effect of structural change. In the shift-share analysis it is assumed that all labour inputs and all capital inputs in a branch have the same productivity. Hence, average productivity in an industry will not be affected by factor inputs moving in, or out of the industry. However, the marginal productivity of factor inputs within an industry may be lower than the average productivity. For example, if surplus labour is shed and finds employment in other branches, average productivity will rise in the shedding branch. This increase will end up as part of the intra-branch productivity effect in Eq. (2), but was in fact caused by a shift of labour towards other branches. Hence the importance of structural change may be underestimated. This line of reasoning prompted Denison (1967) to make upward adjustments in the effects of structural change calculated with the shift-share decomposition. However, it seems safe to assume that within modern manufacturing, the incidence of surplus labour is much less common than in agriculture or in the informal sector.9
A possible source of over- rather than underestimation of the effects of structural change is found in the assumption of factor input homogeneity. Productivity levels of factor inputs may differ across branches due to differences in input quality. If structural change involves a shift towards industries that have a higher level of productivity due to a higher average level of input quality, the effects of resource allocation will also include the increased quality of factor inputs. Hence the effects of structural change are overestimated. To examine this we need a detailed decomposition of the different types of labour and capital input. In general, labour quality is higher in the technologically more sophisticated industries such as chemicals and machinery, and lowest in branches like textiles. Especially in the East Asian countries, labour shifted from low skill to higher skill branches and the effects of structural change are overestimated in this respect.
Externalities are a possible source of causal links between increases in factor shares in one branch and productivity growth in other branches. Increasing output in a sector with strong forward and backward linkages may promote growth of output and productivity in other sectors in various ways. For example, output growth in a sector may lead to quality improvements of its products that are not fully reflected in proportionate price increases. If so, other sectors which use these products as inputs can profit from so-called rent spillovers. Also, other sectors can benefit from various pure knowledge spillovers from dynamic sectors, for example through the diffusion of organisational and marketing techniques. When structural change involves a shift to dynamic sectors with strong linkages and spillovers, then the shift-share method will underestimate the impact of structural change. There is ample empirical evidence of strong spillover effects among different industries,
9Labour surplus may exist in for example state enterprises in India, which provide a number of
383 M.P.Timmer,A.Szirmai/Structural Change and Economic Dynamics11 (2000) 371 – 392 especially in industries which are active in R and D activities themselves (Nadiri, 1993). However, most studies pertain to advanced OECD countries and it is debatable whether similar strong effects are present in countries which operate far from the world technology frontier and perform little R and D.10 Unfortunately,
the data base for this paper does not allow us to examine these assumptions further here.
Apart from spillovers across sectors, the conventional shift-share method also ignores externalities within a sector. Output growth and productivity growth in a sector is assumed to have no causal link. This is a potentially serious omission as possible virtuous circles between output growth and productivity growth within a branch might exist. This effect is known as the Verdoorn effect (Verdoorn, 1949). If resources shift to branches with a higher Verdoorn elasticity, one part of the productivity improvements will be included in the (dynamic) shift effect, but another part in the intra-branch effect. Hence the contribution of structural change as measured by the shift-share analysis is underestimated. This might provide an explanation of the lack of empirical support for the structural-bonus hypothesis we found so far.
7. The Verdoorn effect and the modified shift-share analysis
In this section we try to incorporate the Verdoorn effect in our measurement of the contribution of structural change to productivity growth. Verdoorn’s Law is an empirical generalisation that states that growth of output is positively related to the growth of productivity. Causation obviously runs from the latter to the former,11
but also the other way around, which is important for the discussion here. Originally, Verdoorn (1949) was concerned with finding regularities between growth rates of output and productivity of similar industries in different countries or time periods, a line of research further developed by Kaldor (1966). The unit of analysis was the total economy or the manufacturing sector. Fabricant (1942) was the first to apply this idea in a cross-industry, rather than a cross-country, perspective, followed by others such as Salter (1960). In this paper, we follow the lead of Fabricant and focus on inter-industry differences in the relationship between growth of output and productivity using a pooled dataset for four Asian countries and three subperiods. Nevertheless, we refer to this relationship as the Verdoorn effect rather than Fabricant’s effect because it is better known under the former name.
A number of arguments have been put forward to explain the positive impact of output growth on productivity growth. Originally it was attributed to static scale effects caused by processes of labour division and specialisation both within firms
10In India and Indonesia, private R&D expenditures are still very low. In South Korea and Taiwan,
they only started to grow in the 1980s (see Timmer (2000), Table 8.1).
11This effect is not only direct by generating higher output for a given set of inputs, but also indirect
and between industries, an idea already put forward by Adam Smith and developed further by Young (1928). Besides static effects, Kaldor (1966) also explicitly referred to dynamic increasing returns caused by learning by doing in the sense of Arrow (1962) and incremental technical progress. Growth of output also means faster addition of new, superior machinery, better possibilities to utilise technologies at the appropriate scale and shortened lags in application of new knowledge. These processes may be particular strong in countries that are far from the global technology frontier and industrialise mainly on the basis of borrowing foreign technologies. Rapid output growth also exerts more effort into improving machinery and materials used in the expanding sector, which is known as Schmookler’s demand-driven technological progress.
To take into account the Verdoorn effect, we propose the following modification of the conventional shift-share analysis. Due to the Verdoorn effect, branches that grow faster than the manufacturing average enjoy an extra source of productivity growth compared to slow-growing branches. This extra productivity growth should be attributed to the effects of structural change. To take this into account we modify the shift-share analysis presented above as follows:
TR0E=A: −%
i
ri{A:i−oi(Y:i−Y: )} (8)
withoi the Verdoorn elasticity of branchi, defined as the elasticity of TFP growth on output growth. Thus defined, the total reallocation effect (TRE) is positive if factor inputs shift to branches with a higher level, or growth rate, of productivity (as in the original decomposition), or with higher Verdoorn elasticities. If one compares the redefined total reallocation effect with the original definition in Eq. (6), it can be seen that if output growth is equal in all branches, the adjusted TRE is similar to the original TRE. This does not mean that the Verdoorn effect is not present in this situation, but stresses only that this effect has the same productivity-enhancing effect in all branches. Hence, there is no reason to attribute part of this productivity growth to structural change. Similarly, it can be easily seen that if the Verdoorn elasticity is the same for all branches, the adjusted TRE is equal to the original TRE because
iriY: =Y: . Productivity gains due to the Verdoorn effect in sectors with above average growth are balanced by productivity losses in the sectors with less than average growth. Hence, only if Verdoorn elasticities differ across branches, does the modified shift-share analysis generate different results compared to the conventional analysis. Therefore we used our data set to estimate the Verdoorn relationship at the manufacturing branch level, looking for significant differences.
385 M.P.Timmer,A.Szirmai/Structural Change and Economic Dynamics11 (2000) 371 – 392 growing developing countries show a clearly increasing trend. Taking the role of capital into account would suggest the substitution of TFP growth for labour productivity growth in the original Verdoorn law.
TF:P=a0+b0Q: (9)
In Eq. (9), total factor productivity growth is modelled as a linear function of output growth andb0 indicates the Verdoorn elasticity. However, the specification
suffers from spurious correlation because TFP growth is defined as output growth minus an index of input growth Eq. (3) and hence, output appears on both sides. To remove this spurious correlation, McCombie and De Ridder (1984) suggested the following regression model
TF:I=a%0+b%0Q: +u (10)
with TF:I=6L: +(1−6)K: ,a0%= −a0, b%0=1−b0 andua normal distributed error
term.12 For the purpose of the modified shift-share analysis we are interested in
obtaining the Verdoorn elasticity for each manufacturing branch seperately, rather than for total manufacturing. To this end branch dummies are introduced to allow for differences in the regression slope across the 13 branches.
TF:I=a%0+b%0Q: +b%1d1Q: +···+b%12d12Q: +u (11)
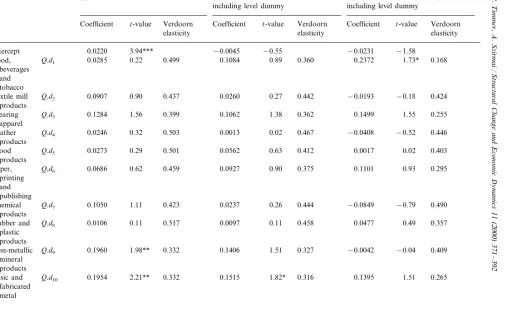
with di is 1 for branch i and 0 otherwise. Data on value added growth and total factor input growth is averaged over 10-year periods and pooled for India, Indonesia, South Korea and Taiwan. In total 126 observations are used to estimate Eq. (11) with ordinary least squares. The results are given in Table 3(a). The overall explanatory power is rather high (R2
=0.74). As may be seen from Table 3, the intercept (i.e. exogenous technical progress) comes up positive and significant. The estimate for the slope coefficient can be found in the row for the machinery and transport equipment branch. This branch is taken as the base as it appears to have the highest coefficient of all branches. The Verdoorn coefficient is highly significant and indicates a Verdoorn elasticity of 0.53 (1−b%0). Importantly, the elasticity in other branches is lower, especially in the metal branch and the non-metallic mineral products branch (0.33) and the electrical machinery branch (0.35).13 Only the
elasticity in these branches is significantly different from the base at 90% in a two-tailed test, as indicated by thet-values in Table 3.
The estimates for the Verdoorn elasticity are close to those found in earlier studies. Using a similar approach, McCombie and De Ridder (1984) found esti-mates between 0.3 and 0.4 for the manufacturing sector in US states. Using cointegration techniques, Harris and Lau (1998) found Verdoorn effects between 0.3 and 0.5 for manufacturing in UK regions. Both studies focused on total factor productivity growth rather than labour productivity.
An objection to the specification above is that it assumes that all countries have access to the same technology (Rowthorn, 1975). However, part of the total factor
12All growth rates are in logarithms.
M
Estimation of the Verdoorn elasticity for 13 manufacturing branches, four Asian countries, 1963–1993 (three pooled sub-periods)a
Variable (a) All countries (b) All countries, (c) South Korea and Taiwan,
including level dummy including level dummy
Coefficient t-value Verdoorn Coefficient t-value Verdoorn Coefficient t-value Verdoorn
elasticity
elasticity elasticity
−0.55 −0.0231
Intercept 0.0220 3.94*** −0.0045 −1.58
0.22 0.499 0.1084 0.89 0.360 0.2372
0.0285 1.73*
Textile mill Q.d2 0.0907 0.90 0.437 −0.18 0.424
products
Q.d4 0.0246 0.503 0.0013 0.02 0.467 −0.0408 −0.52 0.446
Leather 0.32
0.62 0.459 0.0927 0.90 0.375 0.1101
Paper, Q.d6 0.0686 0.93 0.295
printing
Q.d8 0.0106 0.517 0.0097 0.11 0.458 0.0477 0.49 0.357
Rubber and plastic products
0.332 0.1406 1.51 0.327 −0.0042
Q.d9 −0.04
Non-metallic 0.1960 1.98** 0.409
mineral products
Q.d10 2.21** 0.332 0.1515 1.82* 0.316 0.1395 1.51 0.265
Basic and 0.1954
387
Variable (a) All countries (b) All countries,
including level dummy including level dummy
Coefficient
Coefficient t-value Verdoorn t-value Verdoorn Coefficient t-value Verdoorn
elasticity
elasticity elasticity
7.21*** 0.528 0.5321 8.47***
Q.d10 0.4721 0.468 0.5951 7.84*** 0.405
Machinery and transport equipment
0.1233 1.66* 0.345 0.1014 1.27 0.304
Electrical Q.d11 0.1756 2.24** 0.352
machinery
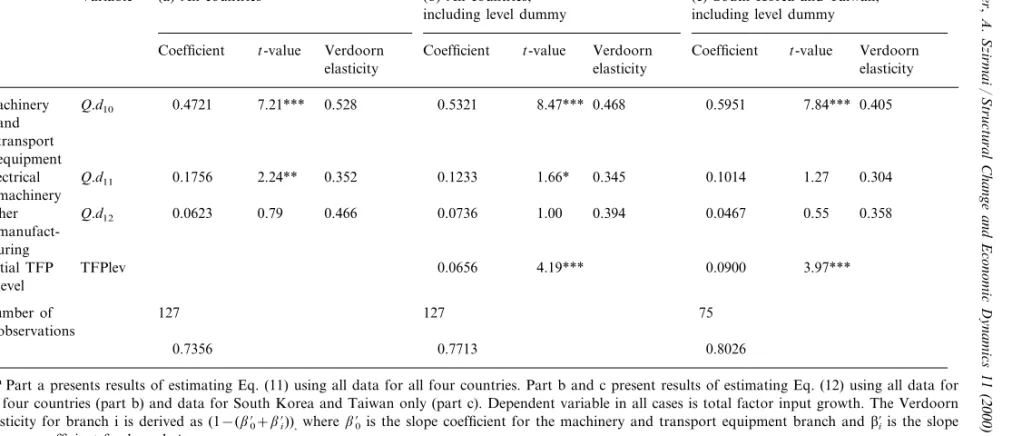
aPart a presents results of estimating Eq. (11) using all data for all four countries. Part b and c present results of estimating Eq. (12) using all data for all four countries (part b) and data for South Korea and Taiwan only (part c). Dependent variable in all cases is total factor input growth. The Verdoorn elasticity for branch i is derived as (1−(b%0+b%i)),whereb%0is the slope coefficient for the machinery and transport equipment branch andb%i is the slope
dummy coefficient for branchi.
productivity growth might be due to a catch-up phenomenon as described by Gerschenkron (1962). Technological backward countries might improve productivity by taking over new technologies from technology leaders. More specificically, the further away from the technology frontier, the stronger this effect will be. Hence the initial level of productivity in a particular branch should be taken into account. Timmer and Szirmai (1999) provide estimates of the manufacturing productivity gap between the Asian countries and the US, the overall world productivity leader. They used industry-specific purchasing power parities to convert national levels into a common denominator. Timmer (2000) extends their analysis and provides compari-sons by manufacturing branch. Using this data, we re-estimated Eq. (11) including for each branch the level of total factor productivity relative to the US at the beginning of each sub-period (TFPlev).
TF:I=a%0+b%0Q: +b%1d1Q: +···+b%12d12Q: +gTFPlev+u (12)
The results are presented in Table 3(b). It shows that the coefficient of the initial level of relative TFP is positive and highly significant. This indicates that the Gerschenkron effect has an important influence separate from the Verdoorn effect. Manufacturing branches with low relative TFP levels have the highest rate of exogeneous technical change. The intercept ceases to be significant. Importantly, estimates of the Verdoorn elasticities are affected as well. For example, the slope coefficient of food manufacturing increases (hence the Verdoorn elasticity declines), which can be explained by the fact that the productivity gap with the US is especially large in this branch in all Asian countries.
A similar regression is run for the East Asian countries separately to see whether these countries are different in terms of branch Verdoorn elasticities. The results are given in Table 3(c). They indicate that branch elasticities are different, especially for the food-manufacturing branch that has a much lower Verdoorn elasticity. However, it remains true that the significance of the differences between branch elasticities is rather low. At 90%, only the elasticity of the food branch is significantly different from the elasticity in the machinery branch. Even the electrical machinery branch does not appear to be special in terms of its Verdoorn elasticity.
As outlined above, if branch elasticities do not differ from each other, the results of the modified shift-share analysis will be the same as those of the conventional analysis. Nevertheless, we would like to have an indication of the probable bias in the empirical results when Verdoorn effects are ignored. Therefore, we use the branch estimates of the Verdoorn elasticities in our decomposition formula Eq. (8). The results are presented in Table 4.
389 M.P.Timmer,A.Szirmai/Structural Change and Economic Dynamics11 (2000) 371 – 392 Table 4
Total reallocation effect on aggregate TFP growth including Verdoorn effect (average annual growth rates)a
TFP growth due to reallocation including Verdoorn effects TFP growth
(annual) (1)
Verdoorn elasticities Verdoorn elasticities Verdoorn elasticities
same for all branches from pooled dataset for East-Asia
(3) (4)
Indonesia,medium and large scale sector
0.8 0.0 0.0
South Korea,firms with fi6e employees or more
1963–1973 8.3 −0.9 −0.7 −0.3
aSource, decomposition of total factor productivity growth into part due to total factor productivity
growth in branches (intra-branch effect) and shifts of factor inputs between branches (shift effect) according to Eq. (8), using estimates of Verdoorn elasticities from Table 3. Figures may not add up due to rounding.
bThis column is the same as column 3 in Table 2.
latter case was the difference with the original reallocation effect \0.2% points. It
appears that the differences in the Verdoorn elasticities across branches are much too small for factor reallocation to have a significant impact on aggregate TFP growth rates. Whether or not Verdoorn effects are taken into account, structural change did not provide a bonus to aggregate productivity growth.
8. Summary and conclusions
productiv-ity growth in the manufacturing sector. Using a conventional shift-share analysis we found that that the structural-bonus hypothesis is not supported by the evidence on Asian industrial development. Reallocation of inputs within the manufacturing sector did not provide an extra bonus to aggregate productivity growth, in addition to growth in individual branches. This holds not only for labour productivity growth but also for total factor productivity growth. We investigated the possibility of a particular bias in the shift-share analysis against finding empirical support for the structural-bonus hypothesis. In particular, we focused on the possible distorting effects of ignoring the Verdoorn effect. The shift-share analysis was modified to take into account this effect. Using estimates of branch-specific Verdoorn elastic-ities, it was shown that the sectoral Verdoorn coefficients do not differ significantly from each other and therefore, the inclusion of the Verdoorn effect has little influence on the decomposition results.
This finding is a striking one and runs counter to the expectations derived from the industrial development literature which suggests that in the course of industrial-isation, factor inputs move into more productive manufacturing industries. This is not to say that structural change is not important for economic growth. We examined one particular, albeit important, aspect of structural change, namely the impact of reallocation of factor inputs on aggregate productivity growth. We did not consider changes at the demand side of the economy, which together with developments at the supply side, determine the actual reallocations of output and inputs across industries. What the results of the shift-share analysis do show is that these reallocations did not provide an additional bonus to aggregate productivity growth in the manufacturing sector of the Asian countries. Instead, aggregate productivity growth is driven by widespread productivity improvements across all manufacturing branches.
A major drawback of the shift-share analysis is the inability to account for inter-industry spillovers. Output growth in a sector with strong backward and forward linkages may promote growth of productivity in other sectors via rent-and/or knowledge spillovers. Although strong inter-industry spillover effects have been found in advanced countries, it is debatable whether similar effects are present in countries which operate far from the world technology frontier and undertake little R&D. The debate on this issue continues and further investigation into this matter, for example by using input-output tables, is desirable.
391 M.P.Timmer,A.Szirmai/Structural Change and Economic Dynamics11 (2000) 371 – 392 same time, rather than a limited number of industries. Hence productivity levels tend to improve in all manufacturing branches.
There is another reason why this is possible. Previous research has shown that the Asian countries had very low levels of both labour and total factor productivity in all manufacturing branches from an international perspective (Timmer and Szirmai, 1999). This indicates that the technology gaps relative to the world productivity leaders are big. Whereas more developed countries are bound by global technological developments which are unevenly spread across industries, developing countries with sufficient technological capabilities have high opportuni-ties for technology catch up and productivity growth in all manufacturing branches. This argument finds support in our finding that the initial productivity level in a branch relative to the level in the US was highly significant and negatively related to subsequent productivity growth. An explanation of productivity growth in Asian manufacturing cannot do without the Gerschenkronian notion of catch up.
Acknowledgements
An earlier version of this paper was presented at the SCED/ECIS/MERIT Conference on ‘Economic Growth, Trade and Technology’ in Eindhoven, October 3 – 4, 1999. We are grateful to the participants of this meeting and an anonymous referee for useful comments and suggestions.
References
Abramovitz, M., 1989. Thinking About Growth. Cambridge University Press, Cambridge, UK. Arrow, K.J., 1962. The economic implications of learning by doing. Rev. Econ. Studies. 44, 155 – 173. Aswicahyono, H.H., 1998. Total Factor Productivity in Indonesian Manufacturing, 1975 – 1993. Unpub-lished Ph.D. thesis, Research School of Pacific and Asian Studies. Australian National University, Canberra.
Aw, B.Y, Chen, X., Roberts, M.J., 1997. Firm-level Evidence on Productivity Differentials, Turnover and Exports in Taiwanese Manufacturing. NBER Working Paper Series No. 6235.
Chenery, H.B., Taylor, L., 1968. Development patterns among countries and over time. Rev. Econ. Stat. 50, 391 – 416.
Chenery, H.B., Robinson, S., Syrquin, M., (Eds.), 1986. Industrialization and Growth: A Comparative Study, Oxford University Press, New York.
Denison, E.F., 1967. Why Growth Rates Differ. Brookings, Washington, DC.
Dollar, D., Wolff, E.N., 1993. Competitiveness, Convergence and International Specialization. MIT Press, Cambridge, MA.
Fabricant, S., 1942. Employment in Manufacturing 1899 – 1939. NBER, New York.
Fagerberg, J., 1999. Structural Change and Productivity Growth in Manufacturing: A Comparative Study. Paper presented at SCED/ECIS/MERIT Conference on Economic Growth, Trade and Technology, Eindhoven, October, 1999.
Fingelton, B., McCombie, J.S.L., 1998. Increasing returns and economic growth: some evidence for manufacturing from the European Union regions. Oxford Econ. Papers 50, 89 – 105.
Harberger, A.C., 1998. A vision of the growth process. Am. Econ. Rev. 88 (1), 1 – 32.
Harris, R.I.D., Lau, E., 1998. Verdoorn’s Law and increasing returns to scale in the UK regions, 1968 – 91: some new estimates based on the cointegration approach. Oxford. Econ. Papers 50, 199 – 217.
Hoffmann, W.G., 1958. The Growth of Industrial Economies. Manchester University Press, Manchester translated from German by W.H. Henderson and W.H. Chaloner.
Jorgenson, D.W., Gollop, F.M., Fraumeni, B.M., 1987. Productivity and US Economic Growth. Harvard University Press, Cambridge, MA.
Kaldor, N., 1966. Causes of the Slow Rate of Economic Growth of the United Kingdom. An Inaugural Lecture. Cambridge University Press, Cambridge, UK.
Kuznets, S., 1979. Growth and structural shifts. In: Galenson, W. (Ed.), Economic Growth and Structural Change in Taiwan. The Postwar Experience of the Republic of China. Cornell University Press, London, UK, pp. 15 – 131.
Lewis, W.A., 1954. Economic development with unlimited supplies of labour. Manchester School Econ. Soc. Studies 22, 139 – 191.
Lucas, R.E., 1993. Making a miracle. Econometrica 61, 251 – 272.
Maddison, A., 1987. Growth and slowdown in advanced capitalist economies: techniques of quantitative assessment. J. Econ. Literat. 25, 649 – 698.
Massell, B.F., 1961. A disaggregated view of technical change. J. Polit. Econ. 69, 547 – 557.
McCombie, J.S.L., De Ridder, J.R., 1984. The Verdoorn law controversy: some new empirical evidence using US state data. Oxford Econ. Papers 36, 268 – 284.
McCombie, J.S.L., Thirwall, A.P., 1994. Economic Growth and the Balance-of-Payments Constraint. St. Martin’s Press, New York.
Nadiri, M.I., 1993. Innovations and Technology Spillovers, NBER Working Paper No. 4423. Nelson, R.R., Pack, H., 1999. The Asian miracle and modern growth theory. Econ. J. 109 (457),
416 – 436.
Paci, R., Pigliaru, F., 1997. Structural change and convergence: an Italian regional perspective. Struct. Change Econ. Dynam. 8, 297 – 318.
Pasinetti, L.L., 1981. Structural Change and Economic Growth. A Theoretical Essay on the Dynamics of the Wealth of Nations. Cambridge University Press, Cambridge.
Rowthorn, R.E., 1975. What remains of Kaldor’s Laws? Econ. J. 85, 10 – 19.
Salter, W.E.G., 1960. Productivity and Technical Change. Cambridge University Press, Cambridge, UK. Syrquin, M., 1984. Resource allocation and productivity growth. In: Syrquin, M., Taylor, L., Westphal, L.E. (Eds.), Economic Structure Performance — Essays in Honor of Hollis B. Chenery. Academic Press, Orlando, FL, pp. 75 – 101.
Syrquin, M., 1988. Patterns of structural change. In: Chenery, H.B., Srinivasan, T.N. (Eds.), Handbook of Development Economics. North-Holland, Amsterdam, pp. 203 – 273.
Timmer, M.P., 2000. The Dynamics of Asian Manufacturing. A Comparative Perspective in the Late Twentieth Century. Edward Elgar, Cheltenham.
Timmer, M.P., Szirmai, A., 1999. International comparison of productivity performance in manufactur-ing in South and East Asia, 1963 – 1993. Oxford Dev. Studies 27 (1), 57 – 80.
Verdoorn, P.J., 1949. Fattori che Regolano lo Sviluppo della Produttivita del Lavoro, L’Industria. In: Ironmonger, D., Perkins, J., Hoa, T. (Eds.), National Income and Economic Progress: Essays in Honour of Colin Clark. Macmillan, London, UK Translated by A.P. Thirlwall.
Verspagen, B., 1993. Uneven Growth between Interdependent Economies: an Evolutionary View on Technology Gaps, Trade and Growth. Avebury.
Young, A., 1928. Increasing returns and economic progress, Econ. J. 38, 527 – 542 December. Young, A., 1995. The tyranny of numbers: confronting the statistical realities of the east Asian growth