Summary Clones of aspen (Populus tremuloides Michx.) were identified that differ in biomass production in response to O3 exposure. 14Carbon tracer studies were used to determine if
the differences in biomass response were linked to shifts in carbon allocation and carbon partitioning patterns. Rooted cuttings from three aspen Clones (216, O3 tolerant; 271,
inter-mediate; and 259, O3 sensitive) were exposed to either
char-coal-filtered air (CF) or an episodic, two-times-ambient O3
profile (2×) in open-top chambers. Either recently mature or mature leaves were exposed to a 30-min 14C pulse and returned to the treatment chambers for a 48-h chase period before harvest. Allocation of 14C to different plant parts, partitioning of 14C into various chemical fractions, and the concentration of various chemical fractions in plant tissue were determined. The percent of 14C retained in recently mature source leaves was
not affected by O3 treatment, but that retained in mature source
leaves was greater in O3-treated plants than in CF-treated
plants. Carbon allocation from source leaves was affected by leaf position, season, clone and O3 exposure. Recently mature
source leaves of CF-treated plants translocated about equal percentages of 14C acropetally to growing shoots and basipet-ally to stem and roots early in the season. When shoot growth ceased (August 16), most 14C from all source leaves was translocated basipetally to stem and roots. At no time did mature source leaves allocate more than 6% of 14C translocated within the plant to the shoot above. Ozone effects were most apparent late in the season. Ozone decreased the percent 14C translocated from mature source leaves to roots and increased the percent 14C translocated to the lower stem. In contrast, allocation from recently mature leaves to roots increased. Partitioning of 14C among chemical fractions was affected by O3 more in source leaves than in sink tissue. In source leaves,
more 14C was incorporated into the sugar, organic acid and lipids + pigments fractions, and less 14C was incorporated into starch and protein fractions in O3-treated plants than in
CF-treated plants. In addition, there were O3 treatment interactions
between leaf position and clones for 14C incorporation into different chemical fractions.
When photosynthetic data were used to convert percent 14C transported to the total amount of carbon transported on a mass basis, it was found that carbon transport was controlled more
by photosynthesis in the source leaves than proportional changes in allocation to the sinks. Ozone decreased the total amount of carbon translocated to all sink tissue in the O3
-sen-sitive Clone 259 because of decreases in photosynthesis in both recently mature and mature source leaves. In contrast, O3
had no effect on carbon transport from recently mature leaves to lower shoots of either Clone 216 or 271, had no significant effect on transport to roots of Clone 216, and increased trans-port to roots of Clone 271. The O3-induced increase in
trans-port to roots of Clone 271 was the result of a compensatory increase in upper leaf photosynthesis and a relatively greater shift in the percent of carbon allocated to roots. In contrast to those of Clone 271, recently mature leaves of Clone 216 maintained similar photosynthetic rates and allocation patterns in both the CF and O3 treatments. We conclude that Clone 271
was more tolerant to O3 exposure than Clone 216 or 259.
Tolerance to chronic O3 exposure was directly related to
main-tenance of high photosynthetic rates in recently mature leaves and retention of lower leaves.
Keywords: air pollution, carbohydrates, photosynthesis, Popu-lus tremuloides.
Introduction
Carbon allocation in indeterminate woody plant species such as trembling aspen (Populus tremuloides Michx.) follows a predictable seasonal pattern. During active shoot growth, carb-on allocaticarb-on, especially from recently mature leaves, is pri-marily upward toward the growing shoot. As shoot growth slows, more carbon is allocated to stem and root growth and storage. Mature leaves lower on the stem export most fixed carbon to the lower stem and roots throughout the season (Dickson 1986, 1991).
Tropospheric O3 affects carbon allocation patterns of woody
plants in several ways. Compared to unstressed plants, greater amounts of carbon are retained in the foliage or shoot tissue (Brouwer 1983). In herbaceous crop plants, O3 decreases root
biomass relative to shoot biomass (Cooley and Manning 1987), and this response is related to changes in whole-plant carbon allocation patterns (Blum et al. 1982, McCool and
Carbon allocation and partitioning in aspen clones varying in
sensitivity to tropospheric ozone
M. D. COLEMAN,
1R. E. DICKSON,
1,3J. G. ISEBRANDS
1and D. F. KARNOSKY
21 USDA Forest Service, North Central Forest Experiment Station, Forestry Sciences Laboratory, P.O. Box 898, Rhinelander, WI 54501, USA
2 School of Forestry and Wood Products, Michigan Technological University, Houghton, MI 49931, USA
3 Author to whom correspondence should be addressed
Received August 13, 1993
Menge 1983, McLaughlin and McConathy 1983). Studies of O3 effects on carbon allocation in trees have primarily involved
conifers (Adams et al. 1990), which are considerably less sensitive to O3 than herbaceous crops (Reich 1987, Gorissen
and van Veen 1988, Spence et al. 1990, Adams and O’Neill 1991, Gorissen et al. 1991a, 1991b). In contrast to crop plants and conifers, little information is available concerning O3
effects on carbon allocation in hardwood tree species. Alterations in carbon partitioning in source leaves that favor either starch or sugar accumulation is another characteristic stress response in plants (Dickson and Isebrands 1991). Stress may also induce a shift from starch reserves to sugars and other compounds associated with tissue repair (Tingey 1974, Meier et al. 1990, Bücker and Ballach 1992).
There have been few studies of genetic variation in plant response to O3 (Butler and Tibbitts 1979, Heck et al. 1988,
Gillespie and Winner 1989), and in particular, of carbon allo-cation responses (McLaughlin and McConathy 1983, Adams and O’Neill 1991). We have, therefore, examined carbon allo-cation and partitioning responses of aspen clones differing in biomass response to O3. Following the terminology outlined
by Dickson and Isebrands (1993), where carbon allocation refers to translocation of carbon from source leaves to sink tissue, and carbon partitioning refers to the movement of carbon among the various chemical fractions within a particu-lar tissue, we postulated that clonal differences in response to O3 reflect differences in carbon allocation between shoot and
root, and in carbon partitioning among chemical fractions that favor carbon retention in source leaves.
Materials and methods
Aspen clones ranging in sensitivity to O3 (216, O3 tolerant;
271, intermediate; and 259, O3 sensitive) were selected based
on susceptibility to foliar injury and decreases in biomass after O3 exposure (Karnosky et al. 1992). However, these O3
-sensi-tivity rankings change depending on the response parameter measured. Experimental plants were vegetatively propagated as softwood cuttings as described by Coleman et al. (1995).
Ozone exposures
Episodic treatments were derived from hourly ambient profiles constructed from O3 data collected in Michigan’s Lower
Pen-insula in cooperation with the U.S. Environmental Protection Agency (Coleman et al. 1995). The simulated ambient profile was doubled to give a twice ambient (2×) exposure. Ozone for the twice ambient treatments, hereafter referred to as O3
treat-ment or 2× exposure, was generated with an OREC V10-0 O3
generator with oxygen as the source and dispensed into char-coal-filtered air (CF) in open-top chambers. There were three chambers for each CF and O3 treatment. Mean hourly O3
concentrations for each chamber were recorded and summed over the growing season to quantify cumulative O3 dose
(Ta-ble 1).
Labeling with 14CO2
Plants were labeled with 14CO2 (25 µCi) three times during the
1990 growing season: on July 2 to 4, July 23 to 25, and August 14 to 16. All plants from one replicate O3 chamber and one
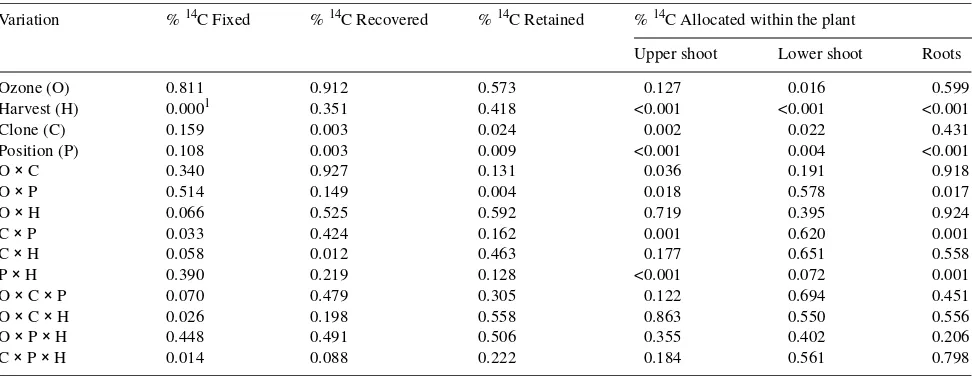
replicate CF chamber were labeled in one day. Because there were three replicate chambers per treatment, it took 3 days to label all plants. Two plants to provide two leaf positions for each of three clones were labeled in each chamber. Recently mature source leaves were first labeled on one plant, then mature source leaves were labeled on the second (Figure 1). Plants were labeled under natural light conditions within 2 h of solar noon as described by Isebrands and Dickson (1991). Three leaves from the specified age class were enclosed in a mylar bag. The bag was sealed to the stem above the source leaves and closed with adhesive tape and cinched around the stem below the source leaves with flexible wire. Labeled carbon dioxide (14CO2) was generated inside the bag by
inject-ing lactic acid into a cup containinject-ing a 14C sodium bicarbonate precipitate. During the 30-min pulse treatment, the bag was periodically flexed to ensure circulation of the 14CO2. After the
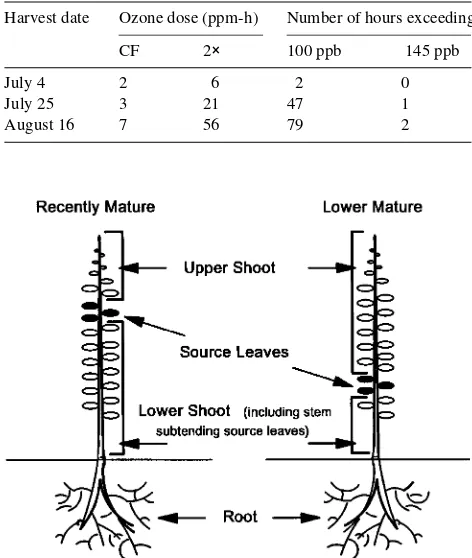
Table 1. Ozone exposure data for the three experimental harvest times, including the 24-h cumulative hourly O3 dose for both CF and 2× O3 treatments, and the number of hours that average hourly O3
concentra-tion exceeded either 100 or 145 ppb in the 2× treatment. The maximum daily exposures recorded were 34 ppb in the CF treatment and 149 ppb in the 2× treatment.
Harvest date Ozone dose (ppm-h) Number of hours exceeding
CF 2× 100 ppb 145 ppb
July 4 2 6 2 0
July 25 3 21 47 1
August 16 7 56 79 2
Figure 1. Diagram of the two source leaf positions (recently mature and mature) that were labeled with 14CO2. Three leaves were labeled
30-min pulse, any remaining 14CO2 was withdrawn through
tubing attached to the bag with a plastic quick-connect valve, and was scrubbed into a sodium hydroxide trap.
To determine the initial amount of 14C fixed, one disc (0.6 cm2) was taken from each of the three source leaves immediately after the mylar bag was removed. After labeling, the plants were returned to their respective open-top treatment chambers for 48 h and then harvested. At harvest, each plant was divided into eight components: source leaves, leaves above the source, leaves below the source, stem segments of source leaves, stem above the source, stem below the source, coarse roots, and fine roots (less than 1 mm diameter). Each tissue was dried at 60 °C, weighed and ground with a Wiley mill to pass a 40-mesh screen. Leaf discs were solubilized with BTS-450 and then mixed with Ready-Organic scintillation cocktail (Beckman Scintillation Supplies, Fullerton, CA, USA; mention of trade names or companies does not indicate endorsement by the USDA Forest Service), and 14C was deter-mined by liquid scintillation spectrometry. Subsamples of ground tissue were suspended in a phase-combining scintilla-tion cocktail (PCS, Amersham Corp., Arlington Heights, IL, USA) to determine 14C (Isebrands and Dickson 1991).
The quantities of 14C fixed, respired, translocated to sinks, or retained in source leaves were determined from the total radioactivity in each tissue component. The amount of 14C
fixed in source leaves was estimated as the product of leaf disc
14C (expressed on an area basis) and the total area of source
leaves. The 14C fixed was then divided into either the percent-age recovered in the various plant tissues or the amount lost, mainly to respiration, during the chase period (calculated as total 14C fixed −14C recovered). The amount of 14C recovered following the 48-h chase period was the product of tissue dry weight and specific activity. Total 14C recovered was the sum of 14C recovered in all tissue components. The amount lost was expressed as a percent of that fixed to estimate the percent respired. The percent 14C retained in source leaves was ex-pressed as a percent of the total recovered. The percent 14C
translocated during the chase period was the percentage of the total recovered that was found in all sink tissues. In addition,
14C translocated was further subdivided into the percentage
found in each sink tissue.
Biochemical analysis
Carbon partitioning was determined to evaluate fluxes of 14C into various chemical fractions (Dickson 1979, Isebrands and Dickson 1991). This method involves the sequential extraction of tissue samples into several biochemical fractions that can be either counted to determine 14C, or quantitatively analyzed to determine the size of each pool (e.g., total soluble sugars, starch, amino acids, etc.). Only tissue samples (source leaves, lower stems and course roots) collected in mid-August were used for 14C chemical partitioning and chemical analysis. Be-cause the percentage of 14C found in the different chemical fractions after labeling either of the two source leaf positions did not differ in lower stem or roots, the 14C data from both of these labeling positions were pooled for statistical analyses of the stem and root tissues.
Estimated carbon fixation and translocation
Photosynthetic carbon fixation was measured on a companion set of plants that were treated like those used for the 14C experiments (Coleman et al. 1995). Briefly, photosynthetic fixation rate of each leaf age class was determined and that rate was multiplied by the total leaf area of that leaf age class. To estimate the amount of carbon fixed and translocated to each sink tissue, the quantity of carbon fixed by each leaf age class was multiplied by the percent translocated to determine total carbon translocated. Total carbon translocated was then subdi-vided into the percent translocated to each sink tissue.
Statistical analysis
The carbon allocation data were subjected to analysis of vari-ance in a four-way factorial design. The four factors in the design were O3 treatment, harvest, clone and leaf position.
Statistical evaluation of biochemical and carbon translocation data included only one harvest and was, therefore, a three-fac-tor design. Because the O3 treatment was within open-top
chambers, a split-plot analysis was employed. The main-plot error (four degrees of freedom) was used to test treatment and harvest effects, and the split-plot error (eight degrees of free-dom) was used to test clone and leaf position effects. All statistical analyses were performed with the SYSTAT software package (Wilkinson 1990).
Results
Ozone exposures
By August 16, the total O3 dose accumulated over the season
was 56 ppm-h (Table 1). Individual daily episodic exposures occasionally exceeded 100 ppb but rarely exceeded 140 ppb. These exposures are within the range occurring over much of central and eastern United States (Lefohn and Pinkerton 1988, Anonymous 1993). However, even these low ozone exposures caused foliar injury symptoms on each of the clones. As the season progressed, the effects of the O3 treatment on the oldest
leaves became more pronounced until the leaves abscised (Karnosky, unpublished data). Because of foliar injury, photo-synthetic rate and total carbon fixation decreased (Coleman et al. 1995). Declines in productivity were evident from biomass measurements of plants at the end of the season, and were most pronounced in the O3-sensitive Clone 259 (Karnosky,
unpub-lished data).
Fixation of 14C
Because of variability associated with the field mylar bag technique, no patterns of total 14C fixation related to leaf position, O3 treatment or clone were found (Table 2). However,
during the season, the amount of 14C fixed decreased from 48% of that applied during the July 4 exposure period to 32% of that applied during the August 16 exposure period. The amount of
14C fixed during the 30-min pulse ranged from 10 to 60% of
on a proportional basis (Isebrands and Dickson 1991). Thus, the patterns of 14C allocation within the plant based on the percentage of 14C found in different plant parts are the same regardless of the total amount initially fixed.
The O3 treatment had no consistent effect on the percent 14C
recovered after the 48-h chase period (Table 2, P = 0.912) except when mature leaves of Clone 216 were treated in August (Figure 2). Clonal and leaf positional effects were significant. In general, more 14C was recovered in Clone 216 than in the other clones, and less 14C was recovered from plants
labeled at the mature leaf position than from plants labeled at the recently mature leaf position (Figure 2).
Carbon allocation
Retention of 14C in source leaves The O3 treatment had no
consistent effect on the 14C retained in source leaves (Table 2); however, percent 14C retained in source leaves differed with leaf position and among clones (Figure 2). For the final two experimental times, recently mature source leaves retained significantly less 14C than mature source leaves (Figure 2, Table 2). When the two leaf positions were analyzed individu-ally, there was no O3 treatment effect on recently mature source
leaves (P > 0.31); however, mature source leaves of O3-treated
plants retained a significantly greater percent 14C than leaves of CF-treated plants in both late July (P = 0.009) and mid-Au-gust (P = 0.007) (Figure 2). The significant O3× leaf position
interaction, which was greater in Clones 259 and 271 than in Clone 216, indicates that the mature and recently mature source leaves reacted differently to O3 treatment (Table 2). For
exam-ple, recently mature source leaves of Clone 271 retained more
14C in CF-treated plants, whereas mature source leaves retained
more 14C in O3-treated plants (Figure 2).
Translocation of 14C to sink tissues The average percentage distributions of 14C in leaf, stem and root fractions were as follows. Leaves above the source contained 47% of the 14C in the shoot above the source; leaves below the source contained 3% of the 14C in the shoot below the source; and fine roots
contained 27% of the total 14C in roots. Because there were no
important seasonal, O3 treatment or clonal effects on carbon
allocation patterns between leaves and stems or between fine and coarse roots (excluding source leaves), leaves and stems were combined to form the upper shoot and lower shoot sinks, and fine and coarse root were combined to form the root sink (Figure 3).
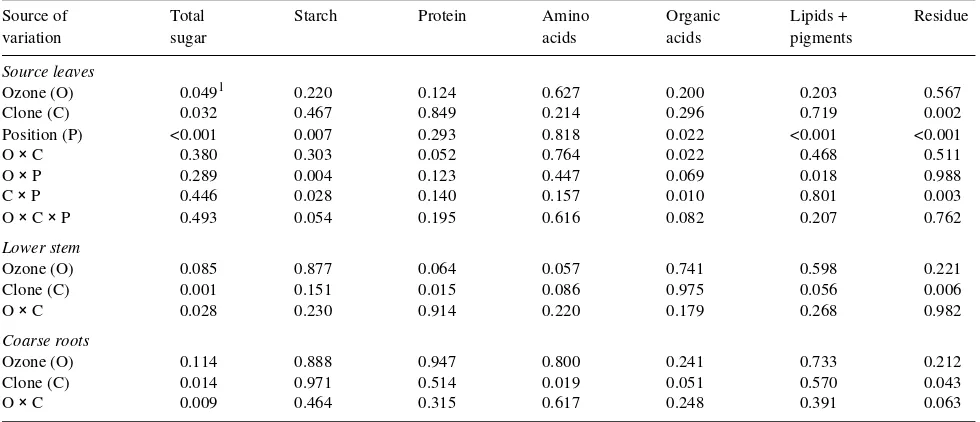
Table 2. Probability values for the percentage of total 14C initially fixed in source leaves, recovered in the whole plant, retained in source leaves, and found in various plant components. Each parameter analysis of variance was based on a split-plot design that included O3 treatment and harvest
as whole-plot factors, and clone and leaf position as split-plot factors.
Variation % 14C Fixed % 14C Recovered % 14C Retained % 14C Allocated within the plant
Upper shoot Lower shoot Roots
Ozone (O) 0.811 0.912 0.573 0.127 0.016 0.599
Harvest (H) 0.0001 0.351 0.418 <0.001 <0.001 <0.001
Clone (C) 0.159 0.003 0.024 0.002 0.022 0.431
Position (P) 0.108 0.003 0.009 <0.001 0.004 <0.001
O × C 0.340 0.927 0.131 0.036 0.191 0.918
O × P 0.514 0.149 0.004 0.018 0.578 0.017
O × H 0.066 0.525 0.592 0.719 0.395 0.924
C × P 0.033 0.424 0.162 0.001 0.620 0.001
C × H 0.058 0.012 0.463 0.177 0.651 0.558
P × H 0.390 0.219 0.128 <0.001 0.072 0.001
O × C × P 0.070 0.479 0.305 0.122 0.694 0.451
O × C × H 0.026 0.198 0.558 0.863 0.550 0.556
O × P × H 0.448 0.491 0.506 0.355 0.402 0.206
C × P × H 0.014 0.088 0.222 0.184 0.561 0.798
1 Probability values less than 0.10 are considered significant.
Figure 2. Effects of O3 exposure on the percentage of 14C recovered in
plants and retained in source leaves. Labeled CO2 was applied to
recently mature and mature leaves, and the plants were harvested after a 48-h chase period. Three aspen clones (216, 259 and 271) were treated three times during the season. Ozone treatments were charcoal-filtered air (CF) and twice ambient O3 (2×). Each error bar represents
The proportion of 14C allocated from recently mature source
leaves to various sink tissues was more affected by growth stage of the plants than by any other factor (Figure 3, Table 2). During active shoot growth in early July, 40 to 70% of the carbon translocated from recently mature source leaves was allocated acropetally to the growing shoot. By late July, this proportion had dropped to nearly 30% in Clone 216, but remained about 60% for Clone 271. In mid-August, when terminal buds had developed on all plants except some plants of Clone 271 and leaf expansion was complete in Clones 216 and 259, the proportion of 14C allocated acropetally was
negli-gible except for the plants of Clone 271 that continued to produce leaves. The greater acropetal than basipetal allocation from recently mature source leaves early in the season is indicated by significant position and position × harvest inter-action for percent 14C allocated to the upper shoot (Table 2).
Basipetal allocation from recently mature leaves to lower shoot and roots increased during the season as allocation to the upper shoot decreased (Figure 3). In early July, less than 15% of 14C
allocated from recently mature leaves was found in roots. By mid-August, 14C allocated from recently mature leaves to roots
exceeded 30% in all but the CF-treated plants of Clone 271 (Figure 3).
There was a significant difference in 14C allocation to sinks
associated with leaf position (Table 2, Figure 3) that was also dependent on harvest time; and there was a significant position by harvest interaction (Table 2) resulting from changes in
patterns of allocation from recently mature leaves. The pat-terns of carbon allocation from mature leaves to upper shoot, lower shoot and roots were similar during the entire season (Figure 3). In general, the proportion of 14C recovered in shoots above mature source leaves was less than 6% of the total found in sink tissue during the entire season (Figure 3). Con-comitantly, the percent 14C allocated to roots from mature source leaves (about 60%) was significantly greater than that allocated to roots from recently mature source leaves (15 to 35%) throughout the season (Table 2, Figure 3).
Ozone treatment effects on allocation of 14C were most evident late in the season. The percent 14C allocated from recently mature source leaves to roots was greater in O3-treated
plants than in CF-treated plants from late July through mid-August (Figure 3). The increased 14C allocation from recently mature source leaves to roots of O3-treated plants was at the
expense of 14C allocated to aboveground plant tissues (Fig-ure 3). In contrast, the proportion of 14C allocated from mature
source leaves to roots was significantly less in O3-treated
plants than in CF-treated plants in mid-August (Figure 3). Coincident with a decreased allocation to roots from mature leaves there was an increased allocation to the lower shoot. The shift in allocation from mature source leaves from roots to lower shoot began earlier and to a much greater extent in Clone 271 than in the other clones. The significant interaction be-tween O3 and leaf position demonstrates the contrasting
treat-ment effects of the two leaf positions on carbon allocation (Table 2).
Carbon partitioning
Partitioning of 14C in source leaves Carbon partitioning in source leaves was affected in complex ways by O3 treatment,
clone and leaf position (Table 3, Figure 4). The effect of O3 on
percent 14C varied among the chemical fractions. More 14C was incorporated into the total sugar, lipids + pigments and organic acid fractions (Figure 4), whereas less 14C was incorporated into the starch and protein fractions in O3-treated plants than
in CF-treated plants. Clonal effects were evident for the total sugar and residue fractions (Table 3, Figure 4). In recently mature leaves, Clone 271 had significantly less 14C in the total
sugar fraction than the other clones, whereas both Clones 259 and 271 had more 14C in the residue than Clone 216. Partition-ing of 14C varied by leaf position; recently mature source leaves had less 14C in the total sugar fraction, but more 14C in the starch (CF plants), residue (Clones 259 and 271) and lipids + pig-ments fractions (both CF and O3 plants) than mature source
leaves (Figure 4). There were also significant O3 × clone
interactions for 14C incorporation into protein and organic acids, and significant O3 × leaf position and clone × leaf
position interactions on 14C incorporation into the starch and organic acid fractions (Table 3).
Partitioning of 14C in sink tissue Partitioning patterns were less evident in lower stem and coarse root sink tissues than in source leaves (Figures 5 and 6). Incorporation of 14C into several chemical fractions was not affected by O3 or clone
(Table 3). Percent 14C (mean ± standard deviation) of fractions showing no effects for the lower stem were: starch, 7.8 ± 3.6% Figure 3. Effects of O3 exposure on 14C allocation within the plants.
Sink tissue types (upper shoot, lower shoot and root) are diagramed in Figure 1. Labeled CO2 was applied to recently mature and mature
leaves, and the plants were harvested after a 48-h chase period. Three aspen clones (216, 259 and 271) were treated three times during the season. Ozone treatments were charcoal-filtered air (CF) and twice ambient O3 (2×). Each error bar represents the standard error of three
and organic acids, 4.2 ± 1.2%; and for the coarse roots were: starch, 9.0 ± 3.7%; protein, 5.0 ± 1.7%; and lipids + pigments, 5.6 ± 0.8%.
Few consistent responses in carbon partitioning related to either O3 treatment or clone were found among the chemical
fractions in the lower stem and coarse roots. For example, incorporation of 14C into both residue and protein fractions decreased with O3 treatment in the lower stem (Figure 5), but
not in coarse roots (Table 2, Figure 6). The most interesting aspect of carbon partitioning in sink tissue was the variable clonal responses to O3. In the lower stem, incorporation of 14C
into total sugars increased with O3 treatment in Clones 216 and
271, but not in Clone 259, whereas 14C incorporation into amino acids was greater for Clones 216 and 259, but not for Clone 271 (Figure 5). This response is shown as a significant O3× clone interaction for the sugar fraction (Table 3). In coarse
roots of Clone 259, O3 decreased 14C in total sugars, but
increased 14C in the residue, organic acid and amino acid fractions (Figure 6). Ozone treatment had no effect on 14C incorporation into coarse root chemical fractions of either Clone 216 or 271. This differential clonal response to O3
treatment resulted in a significant treatment × clone interaction for both the sugar and residue fractions (Table 3).
Chemical composition of source leaves The chemical com-position of source leaves sampled in mid-August was affected by O3, clone and leaf position. In the O3-treated plants,
concen-trations of reducing sugars in recently mature source leaves were significantly lower, whereas concentrations of nonreduc-ing sugars tended to be higher than in leaves of CF-treated plants; as a result, there was no significant treatment effect on the concentration of total sugars (Table 4, Figure 7). In contrast to recently mature leaves, mature source leaves from O3-treated
plants had higher concentrations of reducing sugars but similar concentrations of nonreducing sugars compared with CF-treated plants. As a result, concentrations of total sugars were slightly greater in mature leaves of O3-treated plants than in
mature leaves of CF-treated plants.
Starch concentrations were lower in recently mature leaves of O3-treated plants than in recently mature leaves of
CF-treated plants, but this effect was less pronounced in mature leaves (Table 4, Figure 7). Mature leaves of O3-treated plants
had significantly lower concentrations of the lipids + pigments fraction and the water--methanol soluble fraction (mainly tan-nins and phenolics), and a significantly greater amount of residue compared to CF-treated plants.
Chemical composition of sink tissue The concentrations of the chemical fractions of the lower stem differed little in response to treatment. Concentrations (mg g−1, mean ± stand-ard deviation) for each fraction were: residue, 788 ± 26; reduc-ing sugars, 40 ± 10; nonreducreduc-ing sugars, 23 ± 10; total sugars, 63 ± 13; water--methanol solubles, 50 ± 10; lipids + pigments, 44 ± 7; starch, 32 ± 9; and amino acids, 1.1 ± 0.2. Significant differences in the lower stem were associated with clones and O3 × clonal interactions (Table 4). Ozone-treated plants of
Clone 259 had greater concentrations of water--methanol sol-ubles in stems than CF-treated plants (44.7 and 38.9 mg g−1,
respectively). Of the three clones, Clone 259 had the lowest concentration of starch in lower stem tissue (24.5 mg g−1 versus
36.5 and 34.7 mg g−1 for Clones 216 and 271, respectively),
and Clone 271 had the lowest concentration of amino acids (0.98 mg g−1 versus 1.14 and 1.17 mg g−1 for Clones 216 and 259, respectively).
Chemical composition of coarse roots sampled in mid-Au-gust varied with O3 treatment and clone. With O3 treatment,
Table 3. Probability values for the percentage of 14C found in chemical fractions of source leaves and in sink tissues of lower stem and coarse roots. Source leaf analysis of variance was a three-way factorial design with O3 treatment, clone and leaf position as treatment factors. Lower stem and
coarse root analysis of variance was a two-way factorial design with O3 treatment and clone as treatment factors.
Source of Total Starch Protein Amino Organic Lipids + Residue
variation sugar acids acids pigments
Source leaves
Ozone (O) 0.0491 0.220 0.124 0.627 0.200 0.203 0.567
Clone (C) 0.032 0.467 0.849 0.214 0.296 0.719 0.002
Position (P) <0.001 0.007 0.293 0.818 0.022 <0.001 <0.001
O × C 0.380 0.303 0.052 0.764 0.022 0.468 0.511
O × P 0.289 0.004 0.123 0.447 0.069 0.018 0.988
C × P 0.446 0.028 0.140 0.157 0.010 0.801 0.003
O × C × P 0.493 0.054 0.195 0.616 0.082 0.207 0.762
Lower stem
Ozone (O) 0.085 0.877 0.064 0.057 0.741 0.598 0.221
Clone (C) 0.001 0.151 0.015 0.086 0.975 0.056 0.006
O × C 0.028 0.230 0.914 0.220 0.179 0.268 0.982
Coarse roots
Ozone (O) 0.114 0.888 0.947 0.800 0.241 0.733 0.212
Clone (C) 0.014 0.971 0.514 0.019 0.051 0.570 0.043
O × C 0.009 0.464 0.315 0.617 0.248 0.391 0.063
amino acids, water--methanol soluble and residue content in-creased in roots of O3-treated plants compared to roots of
CF-treated plants, whereas sugar, starch and lipids + pigments concentrations decreased (Table 4, Figure 8). The response of Clone 259 to O3 was much greater than that of the other clones,
especially for sugars, amino acids and residue components (Figure 8). In both the CF and O3 treatments, coarse roots of
Clone 271 had significantly greater lipids + pigments and water--methanol concentrations, and less starch than the other clones.
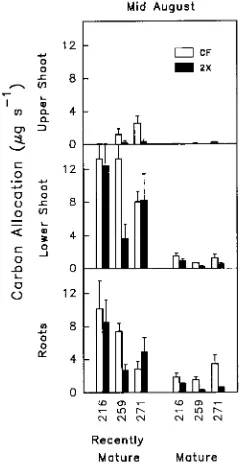
Total carbon allocation to sink tissue The amount of carbon fixed and then allocated to sink tissue was much greater for recently mature leaves than for mature leaves (Figure 9, posi-tional effect in Table 5). In mid-August, most of the carbon fixed in recently mature leaves was allocated to the lower shoot, whereas most carbon fixed by mature source leaves was allo-cated to roots. Significant carbon allocation to the shoot above recently mature leaves was found only in CF-treated plants of Clones 259 and 271. Carbon allocation to the lower shoot and roots decreased with O3 exposure in Clone 259. In contrast,
recently mature leaves of Clones 216 and 271 exposed to O3
were able to maintain carbon allocation equal to or greater than leaves of CF-treated plants. In Clone 271, this basipetal shift in carbon allocation in response to O3 decreased acropetal
allocation. Total carbon allocation from mature source leaves to lower shoots and roots was always less in O3-treated plants
than in CF-treated plants (Figure 9).
Discussion
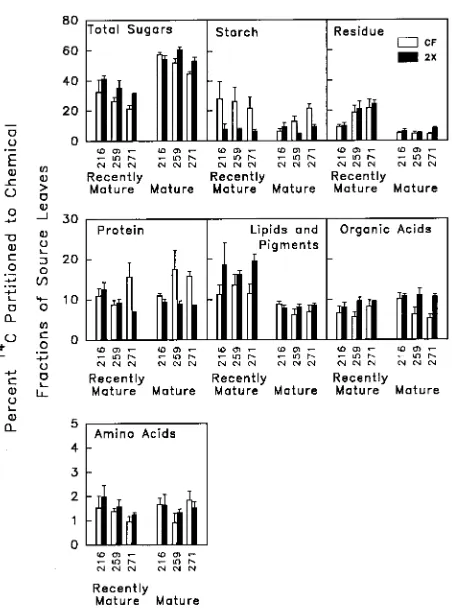
Seasonal carbon allocation patterns in aspen were typical of indeterminately growing plants (Figure 3). Carbon supplied to the actively growing shoot tip and leaves came predominantly from the recently mature leaves directly below the developing leaf zone. As the season progressed, the percentage of carbon allocated acropetally from recently mature leaves decreased, whereas that allocated basipetally to the lower stem and roots increased. The lower leaves on the stem translocated virtually all carbon to lower stem and roots throughout the season. When the late season increase in carbon allocation from re-cently mature leaves was added to that supplied by mature source leaves, carbon allocation to roots increased dramati-cally. The seasonal response of aspen in this study (Figure 3) Figure 4. Effects of O3 exposure on 14C partitioning among chemical
fractions in source leaves. Labeled CO2 was applied to recently mature
and mature leaves, and the plants were harvested after a 48-h chase period. Three aspen clones (216, 259 and 271) were treated three times during the season. Ozone treatments were charcoal-filtered air (CF) and twice ambient O3 (2×). Chemical analyses to determine 14C
partitioning are from the mid-August samples only. The two leaf positions were considered separately because of significant positional effects in the statistical analysis. Each error bar represents the standard error of three replicate samples.
Figure 5. Effects of O3 exposure on 14C partitioning among chemical
fractions in lower stems. Labeled CO2 was applied to recently mature and mature leaves, and the plants were harvested after a 48-h chase period. Three aspen clones (216, 259 and 271) were treated three times during the season. Ozone treatments were charcoal-filtered air (CF) and twice ambient O3 (2×). Chemical analyses to determine 14C
partitioning are from the mid-August samples only. The percentage of
14C found in the different chemical fractions after labeling leaves from
was the same as that found in other Populus species (Nelson and Dickson 1981, Dickson and Nelson 1982, Dickson 1986, 1991). These typical carbon allocation patterns of different leaf age classes were largely unchanged by O3 exposure. However,
some shifts in carbon allocation patterns to compensate for O3
damage did occur, particularly in the O3-tolerant Clone 271.
Figure 6. Effects of O3 exposure on 14C partitioning among chemical
fractions in coarse roots. Labeled CO2 was applied to recently mature
and mature leaves, and the plants were harvested after a 48-h chase period. Three aspen clones (216, 259 and 271) were treated three times during the season. Ozone treatments were charcoal-filtered air (CF) and twice ambient O3 (2×). Chemical analyses to determine 14C partitioning are from the mid-August samples only. The percentage of
14C found in the different chemical fractions after labeling leaves from
either of the two source leaf positions did not differ in coarse roots of plants; therefore, root data from the two source leaf positions were combined in the statistical analysis. Each error bar represents the standard error of six replicate samples.
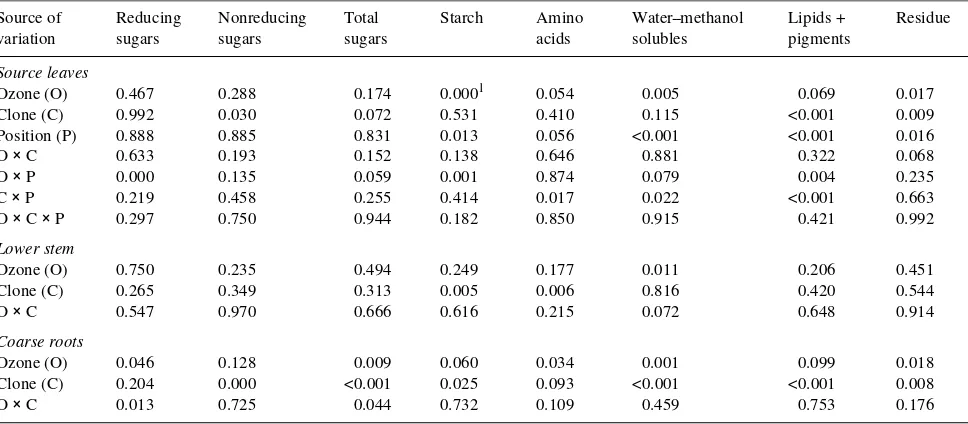
Table 4. Probability values for the chemical composition of source leaves and sink tissues of lower stem and coarse roots from plants sampled in mid-August. Source leaf analysis of variance was a three-way factorial design with O3 treatment, clone and leaf position as treatment factors.
Lower stem and coarse root analysis of variance was a two-way factorial design with O3 treatment and clone as treatment factors.
Source of Reducing Nonreducing Total Starch Amino Water--methanol Lipids + Residue
variation sugars sugars sugars acids solubles pigments
Source leaves
Ozone (O) 0.467 0.288 0.174 0.0001 0.054 0.005 0.069 0.017
Clone (C) 0.992 0.030 0.072 0.531 0.410 0.115 <0.001 0.009
Position (P) 0.888 0.885 0.831 0.013 0.056 <0.001 <0.001 0.016
O × C 0.633 0.193 0.152 0.138 0.646 0.881 0.322 0.068
O × P 0.000 0.135 0.059 0.001 0.874 0.079 0.004 0.235
C × P 0.219 0.458 0.255 0.414 0.017 0.022 <0.001 0.663
O × C × P 0.297 0.750 0.944 0.182 0.850 0.915 0.421 0.992
Lower stem
Ozone (O) 0.750 0.235 0.494 0.249 0.177 0.011 0.206 0.451
Clone (C) 0.265 0.349 0.313 0.005 0.006 0.816 0.420 0.544
O × C 0.547 0.970 0.666 0.616 0.215 0.072 0.648 0.914
Coarse roots
Ozone (O) 0.046 0.128 0.009 0.060 0.034 0.001 0.099 0.018
Clone (C) 0.204 0.000 <0.001 0.025 0.093 <0.001 <0.001 0.008
O × C 0.013 0.725 0.044 0.732 0.109 0.459 0.753 0.176
1 Probability values less than 0.10 are considered significant.
Figure 7. Effects of O3 exposure on chemical composition of source
leaves. Ozone treatments were charcoal-filtered air (CF) and twice ambient O3 (2×). Chemical analyses of leaves from the three aspen
In many species, O3 decreases root biomass accumulation
more than shoot biomass accumulation (Cooley and Manning 1987). Shoots may receive a greater proportion of the limited assimilates as a result of decreased phloem loading (McLaugh-lin and McConathy 1983), decreased phloem transport (Spence et al. 1990), or greater carbon demands for repair of O3-damaged foliage (McLaughlin and McConathy 1983).
Ad-ditionally, photosynthetic carbon fixation rates of mature leaves exposed to O3 stress are severely inhibited (Reich 1983,
Coleman et al. 1995). Because lower leaves have a major role in supplying roots with carbon, O3 stress should inhibit root
growth to a greater extent than shoot growth. However, in some
species allocation of carbon to biomass of both aboveground and belowground plant parts declines equally with O3
treat-ment, and shoot/root ratios remain constant (Cooley and Man-ning 1987). Aspen appears to fit this pattern of response because shoot/root ratios were unaffected by O3 treatment (P =
0.485; Karnosky, unpublished data). Although the amount of carbon allocated from mature leaves to roots was severely inhibited by O3 treatment in aspen, recently mature leaf carbon
allocation shifted to favor roots at the expense of the shoot, thus compensating for decreased carbon allocation from ma-ture leaves to roots (Figures 3 and 9).
Carbon partitioning patterns in leaves can vary diurnally in response to accumulation and translocation of assimilates (Huber 1983, Dickson 1987, 1991). Additionally, other plant and environmental factors can have a large influence on leaf carbon metabolism (Geiger 1979, Stitt 1987, Rufty et al. 1988). Carbon partitioning in aspen source leaf tissue re-sponded to O3 stress to a much greater extent than that in sink
tissues (Tables 3 and 4). The most significant response to O3
stress in aspen was found in leaf tissues where 14C incorpora-tion into starch was less than half that of the CF-treated plants (Figure 4), resulting in substantial decreases in the total starch concentration, especially in recently mature leaves (Figure 7). Coarse root starch concentrations also decreased with O3
treat-ment (Figure 8). Similar declines in starch concentrations in response to O3 have been found for Pinus taeda L. (Meier et
al. 1990, Friend et al. 1992), Pinus ponderosa Laws. (Miller et Figure 8. Effects of O3 exposure on chemical composition of coarse
roots. Ozone treatments were charcoal-filtered air (CF) and twice ambient O3 (2×). Chemical analyses of roots from the three aspen clones (216, 259 and 271) are from the mid-August samples only. Each error bar represents the standard error of six replicate samples.
Figure 9. Effects of O3 exposure on total carbon allocated within the plant. Sink tissue types (upper shoot, lower shoot and root) are dia-grammed in Figure 1. Carbon allocation within the three aspen clones (216, 259 and 271) was calculated from the percentage of 14C allo-cated to each sink and the photosynthetic productivity of the recently mature and mature leaf age classes in mid-August. Ozone treatments were charcoal-filtered air (CF) and twice ambient O3 (2×). Each error bar represents the standard error of three replicate samples.
Table 5. Probability values for the amount of carbon allocated to sink tissues of upper shoot, lower shoot and roots from plants sampled in mid-August. Each analysis of variance was a three-way factorial design with O3 treatment, clone and leaf position as treatment factors.
Variation Amount of carbon allocated to
Upper shoot Lower shoot Roots
Ozone (O) 0.0721 0.345 0.308
Clone (C) 0.166 0.117 0.002
Position (P) 0.047 <0.001 <0.001
O × C 0.279 0.102 0.031
O × P 0.124 0.159 0.534
C × P 0.210 0.219 0.001
O × C × P 0.346 0.082 0.005
al. 1969), Pinus echinata Mill. (Paynter et al. 1991), Gossypium hirsutum L. (Miller et al. 1989) and Trifolium repens L. (Blum et al. 1982). There are, however, cases where O3 exposure increased starch concentrations in shoots (Tingey
et al. 1976).
Incorporation of 14C into sugar generally increased with O3
exposure in source leaf and lower stem tissue (Figures 4 and 5); however, total sugar concentrations were mostly un-changed because of differential incorporation into the different sugar fractions. For example, reducing sugar concentrations decreased in recently mature leaf tissue, whereas nonreducing sugar concentrations increased. At the same time, both sugar fractions and total sugars tended to increase in mature leaves. Similar complex responses to O3 treatment have been found in
Pinus species (Barnes 1972, Tingey et al. 1976, Paynter et al. 1991). Decreases in starch and increases in soluble sugars are a common response to O3 exposure (Friend et al. 1992).
To determine how shifts in carbon allocation patterns af-fected growth, we calculated the total amount of carbon translocated to sink tissue from photosynthetic data and the percent 14C allocated to different tissues. Ozone significantly decreased mature leaf photosynthetic rate. This negative effect was similar in magnitude for all clones. In contrast, O3 effects
on recently mature leaf photosynthetic rate differed among the clones: photosynthesis was unaffected in Clone 216, signifi-cantly decreased in Clone 259, and slightly increased in Clone 271. In addition to decreases in photosynthetic rate, abscission of mature leaves was observed to varying degrees in all clones, and O3 treatment significantly increased the loss of mature
leaves. Clones 216 and 259 lost more leaf area than Clone 271 (Coleman et al. 1995). Because of decreases in photosynthetic rate and loss of leaves in the O3-treated clones, much less
photosynthate was available for transport to sinks. For exam-ple, in Clone 259, when the rate of 7.4 µg s−1 of carbon
allocated to roots from the recently mature leaves of CF plants is totaled for 8 h per day over 100 days, an accumulation of 21.3 g of carbon is predicted. This approach assumes that the midday photosynthetic rate holds for 8 h and represents the cumulative daily photosynthetic productivity, and that the amount retained after the 48-h chase period represents dry matter accumulation. The corresponding values for O3-treated
plants of Clone 259 were 2.7 µg allocated s−1 and 7.7 g
accumulated, respectively. Adding the contribution of mature leaves, the total accumulation was 25.6 and 8.6 g for CF-treated and O3-treated plants, respectively.
The differing clonal responses in carbon allocation to O3
treatment provide information about the mechanisms of vari-able sensitivities. All clones increased the percent of carbon allocated from recently mature leaves to lower stem and root tissue following terminal bud set, but Clone 271 appeared to make adjustments sooner and to a greater extent than the other clones. Clone 271 was exceptional in its ability to compensate for O3 stress. Not only were plants of this clone able to shift a
greater proportion of carbon to sinks in the lower portion of the plant, but the recently mature leaves also compensated by increasing their photosynthetic rate. As a result, there was no apparent O3 effect on carbon allocation to sink tissue in this
clone (Figure 9). Ozone has been shown to increase the photo-synthetic rate of retained foliage in other tree species (Eamus et al. 1990), and this increase may result from increased sink demand of the diminishing leaf area. Photosynthetic rate of retained leaves is known to increase in Populus following artificial defoliation (Bassman and Dickmann 1982), and this photosynthetic adjustment was associated with shifts in carbon allocation (Bassman and Dickmann 1985). It is reasonable, therefore, to expect a similar response in O3-stressed aspen in
which mature leaves senesce and abscise prematurely. There was a negative effect of O3 on the total amount of
carbon transported in the O3-sensitive Clone 259 (Figure 9, cf.
Karnosky et al. 1992). Sensitivity of Clone 259 is related to decreases in photosynthetic rate and loss of lower leaves rather than to changes in carbon allocation. Carbon allocation from recently mature leaves did shift basipetally to compensate for loss of photosynthate from lower mature leaves. This shift in carbon allocation, however, could not compensate for overall loss of productivity resulting from O3 exposure of Clone 259.
Ranking of these clones with respect to O3 sensitivity was
originally based on relative decreases in biomass production and foliar injury in response to O3 exposure. Based on
de-creases in biomass with O3 exposure, in 1989 the clones were
ranked 216 > 271 > 259 (Karnosky et al. 1992). In 1990, biomass rankings were the same. In 1991, based on decreases in biomass, the clones ranked 271 > 216 > 259 (Karnosky, unpublished data). Small changes in environmental or experi-mental parameters may change the relative biomass produc-tion of Clones 216 and 271, both of which are relatively tolerant to O3 exposure compared to Clone 259. Our data
indicate that tolerance is determined largely by the photosyn-thetic response to O3 exposure, and that this response differs
significantly among the three clones (Coleman et al. 1995). In summary, seasonal patterns of carbon allocation found in this study were typical of indeterminately growing plants where carbon transported from recently mature leaves moves both acropetally and basipetally until terminal bud set. Follow-ing terminal bud set, all leaves on the plant transport carbon basipetally. Ozone effects on carbon allocation patterns were more apparent later in the season. Mature leaves translocated significantly less 14C to the roots when exposed to O3. Recently
mature leaves increased carbon allocation to roots with O3
exposure in an apparently compensatory response. This com-pensation by recently mature leaves resulted in O3 having
negligible effects on the shoot/root ratio. Although the adjust-ments of carbon allocation from recently mature source leaves to different sinks distributed the impact of O3 more evenly
throughout the plant, the greatest impact of O3 was on total
carbon gain (cf. Coleman et al. 1995). Those clones that retained relatively greater leaf area and photosynthetic rate were most successful at maintaining productivity at rates simi-lar to CF-treated plants.
Acknowledgments
Funding was provided by USDA CSRS grant #89-34171-4384, US EPA grant #DW12934109-0, and by USDA Forest Service, Northern Stations Global Change Research Program. This paper was presented at an international workshop entitled ‘‘Ecophysiology and Genetics of Trees and Forests in a Changing Environment’’ in Viterbo, Italy, in May 1993.
References
Adams, M.B. and E.G. O’Neill. 1991. Effects of ozone and acidic deposition on carbon allocation and mycorrhizal colonization of Pinus taeda L. seedlings. For. Sci. 37:5--16.
Adams, M.B., N.T. Edwards, G.E. Taylor, Jr. and B.L. Skaggs. 1990. Whole-plant 14C-photosynthate allocation in Pinus taeda: seasonal patterns at ambient and elevated ozone levels. Can. J. For. Res. 20:152--158.
Anonymous. 1993. Northeastern area forest health report. USDA Forest Service, NE, Report No. NA-TP-03-93.
Barnes, R.L. 1972. Effects of chronic exposure to ozone on soluble sugar and ascorbic acid contents of pine seedlings. Can. J. Bot. 50:215--219.
Bassman, J.H. and D.I. Dickmann. 1982. Effects of defoliation in the developing leaf zone on young Populus × euramericana plants. I. Photosynthetic physiology, growth, and dry weight partitioning. For. Sci. 28:599--612.
Bassman, J.H. and D.I. Dickmann. 1985. Effects of defoliation in the developing leaf zone on young Populus × euramericana plants. II. Distribution of 14C-photosynthate after defoliation. For. Sci. 31:358--366.
Blum, U., G.R. Smith and R.C. Fites. 1982. Effects of multiple O3 exposures on carbohydrate and mineral contents of ladino clover. Environ. Exp. Bot. 22:143--154.
Brouwer, R. 1983. Functional equilibrium: sense or nonsense? Neth. J. Agric. Sci. 31:335--348.
Bücker, J. and H.J. Ballach. 1992. Alterations in carbohydrate levels in leaves of Populus due to ambient air pollution. Physiol. Plant. 86:512--517.
Butler, L.K. and T.W. Tibbitts. 1979. Stomatal mechanisms determin-ing genetic resistance to ozone in Phaseolus vulgaris L. J. Am. Soc. Hortic. Sci. 104:213--216.
Coleman, M.D., R.E. Dickson, J.G. Isebrands and D.F. Karnosky. 1995. Photosynthetic productivity of aspen clones varying in sensi-tivity to tropospheric ozone. Tree Physiol. 15:585--592.
Cooley, D.R. and W.J. Manning. 1987. The impact of ozone on assimilate partitioning in plants: a review. Environ. Pollut. 47:95--113.
Dickson, R.E. 1979. Analytical procedures for the sequential extrac-tion of 14C-labeled constituents from leaves, bark and wood of cottonwood plants. Physiol. Plant. 45:480--488.
Dickson, R.E. 1986. Carbon fixation and distribution in young Popu-lus trees. In Crown and Canopy Structure in Relation to Productiv-ity. Eds. T. Fujimori and D. Whitehead. Forestry and Forest Products Research Institute, Ibaraki, Japan, pp 409--426.
Dickson, R.E. 1987. Diurnal changes in leaf chemical constituents and
14C partitioning in cottonwood. Tree Physiol. 3:157--171.
Dickson, R.E. 1991. Assimilate distribution and storage. In Physiol-ogy of Trees. Ed. A.S. Raghavendra. John Wiley and Sons, New York, New York, pp 51--85.
Dickson, R.E. and J.G. Isebrands. 1991. Leaves as regulators of stress response. In Response of Plants to Multiple Stresses. Eds. H.A. Mooney, E.J. Pell and W.E. Winner. Academic Press, New York, New York, pp 3--34.
Dickson, R.E. and J.G. Isebrands. 1993. Carbon allocation terminol-ogy: should it be more rational? Bull. Ecol. Soc. Am. 74:175--177. Dickson, R.E. and E.A. Nelson. 1982. Fixation and distribution of 14C in Populus deltoides during dormancy induction. Physiol. Plant. 54:393--401.
Eamus, D., J.D. Barnes, L. Mortensen, H. Ro-Poulsen and A.W. Davison. 1990. Persistent stimulation of CO2 assimilation and sto-matal conductance by summer ozone fumigation in Norway spruce. Environ. Pollut. 63:365--379.
Friend, A.L., P.T. Tomlinson, R.E. Dickson, E.G. O’Neill, N.T. Ed-wards and G.E. Taylor, Jr. 1992. Biochemical composition of lob-lolly pine reflects pollutant exposure. Tree Physiol. 11:35--47. Geiger, D.R. 1979. Control of partitioning and export of carbon in
leaves of higher plants. Bot. Gaz. 140:241--248.
Gillespie, C.T. and W.E. Winner. 1989. Development of lines of radish differing in resistance to O3 and SO2. New Phytol. 112:353--361.
Gorissen, A. and J.A. van Veen. 1988. Temporary disturbance of translocation of assimilates in Douglas-fir caused by low levels of ozone and sulfur dioxide. Plant Physiol. 88:559--563.
Gorissen, A., N.N. Joosten and A.E. Jansen. 1991a. Effects of ozone and ammonium sulphate on carbon partitioning to mycorrhizal roots of juvenile Douglas-fir. New Phytol. 119:243--250.
Gorissen, A., G.C. Schelling and J.A. van Veen. 1991b. Concentration-dependent effects of ozone on translocation of assimilates in Douglas-fir. J. Environ. Qual. 20:169--173.
Heck, W.W., J.A. Dunning, R.A. Reinert, S.A. Prior, M. Rangappa and P.S. Benepal. 1988. Differential responses of four bean cultivars to chronic doses of ozone. J. Am. Soc. Hortic. Sci. 113:46--51. Huber, S.C. 1983. Relation between photosynthetic starch formation
and dry-weight partitioning between the shoot and root. Can. J. Bot. 61:2709--2716.
Isebrands, J.G. and R.E. Dickson. 1991. Measuring carbohydrate production and distribution: radiotracer techniques and applica-tions. In Techniques and Approaches in Forest Tree Ecophysiology. Eds. J.P. Lassoie and T.M. Hinckley. CRC Press, Boca Raton, Florida, USA, pp 357--392.
Karnosky, D.F., Z.E. Gagnon, D.D. Reed and J.A. Witter. 1992. Growth and biomass allocation of symptomatic and asymptomatic Populus tremuloides clones in response to seasonal ozone expo-sures. Can. J. For. Res. 22:1785--1788.
Lefohn, A.S. and J.E. Pinkerton. 1988. High resolution charac-terization of ozone data for sites located in forested areas of the United States. J. Air Pollut. Control Assoc. 38:1504--1511. McCool, P.M. and J.A. Menge. 1983. Influence of ozone on carbon
partitioning in tomato: potential role of carbon flow in regulation of the mycorrhizal symbiosis under conditions of stress. New Phytol. 94:241--247.
McLaughlin, S.B. and R.K. McConathy. 1983. Effects of SO2 and O3 on allocation of 14C-labeled photosynthate in Phaseolus vulgaris. Plant Physiol. 73:630--635.
Meier, S., L.F. Grand, M.M. Schoeneberger, R.A. Reinert and R.I. Bruck. 1990. Growth, ectomycorrhizae and nonstructural carbohy-drates of loblolly pine seedlings exposed to ozone and soil water deficit. Environ. Pollut. 64:11--27.
Miller, J.E., R.P. Patterson, W.A. Pursley, A.S. Heagle and W.W. Heck. 1989. Response of soluble sugars and starch in field-grown cotton to ozone, water stress, and their combination. Environ. Exp. Bot. 29:477--486.
Nelson, E.A. and R.E. Dickson. 1981. Accumulation of food reserves in cottonwood stems during dormancy induction. Can. J. For. Res. 11:145--154.
Paynter, V.A., J.C. Reardon and V.B. Shelburne. 1991. Carbohydrate changes in shortleaf pine (Pinus echinata) needles exposed to acid rain and ozone. Can. J. For. Res. 21:666--671.
Reich, P.B. 1983. Effects of low concentrations of O3 on net
photosyn-thesis, dark respiration, and chlorophyll contents in aging hybrid poplar leaves. Plant Physiol. 73:291--296.
Reich, P.B. 1987. Quantifying plant response to ozone: a unifying theory. Tree Physiol. 3:63--91.
Rufty, T.W., S.C. Huber and R.J. Volk. 1988. Alterations in leaf carbohydrate metabolism in response to nitrogen stress. Plant Physiol. 88:725--730.
Spence, R.D., E.J. Rykiel, Jr. and P.J.H. Sharpe. 1990. Ozone alters carbon allocation in loblolly pine: assessment with carbon-11 label-ing. Environ. Pollut. 64:93--106.
Stitt, M. 1987. Fructose 2,6-bisphosphate and plant carbohydrate metabolism. Plant Physiol. 84:201--204.
Tingey, D.T. 1974. Ozone induced alterations in the metabolite pools and enzyme activities of plants. In Air Pollution Effects on Plant Growth. ACS Symposium, No. 3, American Chemical Society, pp 40--57.
Tingey, D.T., R.G. Wilhour and C. Standley. 1976. The effect of chronic ozone exposures on the metabolite content of ponderosa pine seedlings. For. Sci. 22:234--241.