M. Nausch*, G. Nausch
Institut fu¨r Ostseeforschung, Seestrasse 15, D-18119 Rostock-Warnemu¨nde, Germany
Accepted 3 May 2000
Abstract
In the Baltic Sea, peptidase and alkaline phosphatase activities always show the same pattern in nutrient gradients: increasing enzyme activities with decreasing dissolved inorganic nitrogen (DIN) and phosphate. The field experiments reported here suggest that peptidase activity may be regulated by DIN in a manner similar to that of alkaline phosphatase by phosphate. In nutrient gradients established in mesocosms, peptidase activity increased 5- to 7-fold, whereas the alkaline phosphatase activity increased between 29- and 65-fold. Parallel to the enzyme activities, phytoplankton biomass (measured as chlorophyll a), organic phosphorus and nitrogen increased, but the closest correlation was found between peptidase and alkaline phosphatase activity r0:90;n18;p,0:01:The addition of nitrate, and nitrate plus phosphate, at the time where nutrients were depleted and both enzyme activities were high, did not result in a decrease of peptidase activity. Rather, the peptidase activity was highest after simultaneous treatment with phosphate and nitrate. The addition of 1 mg l21alkaline phosphatase caused a 6-fold increase of the peptidase activity after 96 h. Several mechanisms of the stimulation of peptidase activity by alkaline phosphatase are discussed.q2000 Elsevier Science Ltd. All rights reserved.
Keywords: Peptidase; Alkaline phosphatase; Phosphate; Inorganic nitrogen; Extracellular enzyme activities; Aquatic ecosystems
1. Introduction
Studies of extracellular enzyme activities are used to describe the degradation of organic matter in aquatic ecosystems (Hollibaugh and Azam, 1983; Azam and Cho, 1987; Billen, 1991; Boetius and Lochte, 1994, 1996; Karner et al., 1995; Martinez et al., 1996) and terrestrial soils (Asmar et al., 1994; Bishop et al., 1994; Falih and Wain-wright, 1996; Chander et al., 1997). They are determined by the addition of artificial substrates (Darrah and Harris 1986; Chro´st, 1991; Hoppe, 1993; Shand and Smith 1997). The maximum rate of hydrolysis (Vmax) of artificial substrates is
used to characterise these enzyme activities, and is an indir-ect measure of the quantity of enzymes in the environment. Due to differences in their regulation, in aquatic environ-ments some extracellular enzyme activities (e.g. alkaline phosphatase) are highest during the intensive phase of phytoplankton growth, whereas others reach highest values during phytoplankton breakdown or at the end of the growth season (Chro´st, 1991; Mu¨nster, 1991; Nausch et al., 1998). Different abiotic and biotic factors may influence the synthesis and activity of extracellular enzymes, including
temperature, pH (Chro´st, 1990; Christian and Karl, 1995), the presence of humic substances (Stewart and Wetzel, 1982; Carlsson and Graneli, 1993; Boavida and Wetzel, 1998), oxygen conditions (Newman and Reddy, 1993), hydrogen sulphide (Hoppe et al., 1990), or UV-B radiation (Garde and Gustavson, 1999). In addition, heavy metals (Yamada et al., 1983; Kandeler et al., 1996) and herbicides (Simon and Bergerova, 1984) can influence enzyme activ-ities in soils. Enzyme stimulation and repression by substrates and end-products are assumed to be the main regulators (Chro´st, 1990). However, the interaction of enzymes with their substrates is more complex. For exam-ple, the degradation of proteins by peptidases is not only necessary for the supply of nitrogen, but also to provide carbon. This is how glucose is thought to inhibit peptidase activity (Chro´st, 1991; Boetius and Lochte, 1996). Hoppe and Ullrich (1999) proposed similar mechanisms for the regulation of phosphatase activity in the deep sea, where phosphate is available and hydrolysis of organic phosphorus compounds is used to meet the carbon demand of bacteria. In the Baltic Sea, inorganic nutrients are depleted below their detection limits (PO4,0.02mM, NO213,0.05mM)
during the growth season (Nehring et al., 1995). In the central part of the Baltic Sea, where the input from land sources can be neglected, regeneration from organic matter is the main source (apart from nitrogen fixation) of nutrients
0038-0717/00/$ - see front matterq2000 Elsevier Science Ltd. All rights reserved.
PII: S 0 0 3 8 - 0 7 1 7 ( 0 0 ) 0 0 1 7 3 - 5
* Corresponding author. Tel.:149-381-5197-227; fax:1 49-381-5197-440.
to maintain primary production (Wasmund et al., 2000). We investigated both peptidase and alkaline phosphatase activ-ity in nutrient gradients in the Baltic Sea, and addressed the question of regulatory factors. It is assumed that peptidases are regulated by the availability of polymeric nitrogen substrates, such as proteins and large polypeptides, and provide low molecular weight compounds for rapid assim-ilation by bacteria (Hollibaugh and Azam, 1983; Billen, 1991; Chro´st 1991). However, the influence of inorganic nitrogen on the peptidase activity of pure bacterial cultures is shown by Priest (1984) and was shown in the environment only by Chro´st (1991) in lakes. In contrast, the regulation of alkaline phosphatase in aquatic environments by phosphate availability has been described extensively (e.g. Halemejko and Chro´st, 1984; Gage and Gorham, 1985; Paasche and Erga, 1988; Hernandez et al., 1993). We investigated the influence of nitrate, phosphate and alkaline phosphatase on peptidase activity in an attempt to explain the observed behaviour of peptidases in nutrient gradients in marine environments.
2. Material and methods
2.1. Field investigations
Field investigations were carried out in the Gotland Basin (578 18.4250N and 0208 04.520E) from June 27 to July 3, 1993. Drift experiments on the salinity gradient were performed in the Pomeranian Bight in June 1994 and 1995. Inorganic nutrient gradients have different origins in these areas. In the euphotic zone of the Gotland Basin, the nutrient gradient is caused exclusively by the uptake of nutrients by phytoplankton. The salinity during the investi-gations ranged between 7.04 and 7.14 with depth, whereas the temperature decreased from 14.28C at 1.5 m to 3.68C at 25 m. In contrast, in the Pomeranian Bight, nutrient-enriched fresh water comes from the Odra River and is mixed with water of higher salinity and a lower nutrient content from the open Baltic Sea (Bodungen et al., 1995). Consumption of nutrients by phytoplankton in the growth season reduces the nutrient concentration concomitantly. During the investigation, salinity increased from about 3, near the river mouth, to 7.5 after the mixing of both water bodies. The temperature ranged between 15 and 198C. The Bight is relatively shallow, with a mean water depth of 13 m.
Water was collected at depths of 1.5, 4.5, 7, 9, 12, 15, 16.5, 18 and 21 m in the euphotic zone of the Gotland Basin, and at 1.5 m from the surface and 1 m from the bottom in the Pomeranian Bight. Water samples were taken with a rosette sampler (Hydrobios Apparatebau GmbH, Kiel-Holtenau, Gemany) combined with a probe for measuring the conduc-tivity, temperature, density (CTD) (Seabird SBE 911, Belle-vue, WA, USA) and chlorophyll fluorescence (Haardt-Optik, Mikroelektonik, Kiel, Germany).
2.2. Mesocosm experiments
Mesocosm experiments were performed in January and February 1998, over a period of 20 days. Three 100-l meso-cosms, filled with nutrient-rich winter water from the Arkona Basin (Baltic Sea), were illuminated permanently with 500 W halogen lamps (light intensity 200mE s21m22)
to induce phytoplankton development and nutrient gradi-ents. After the depletion of nutrients and increased alkaline phosphatase and peptidase activity at day 15, 7mM
potas-sium nitrate (MERCK 5065) was added to the first meso-cosm, and 7mM potassium nitrate plus 1mM potassium
dihydrogen phosphate (MERCK 4873) were added to the second mesocosm. The same amounts of nutrients were added each day after the first supply to prevent nutrient depletion by phytoplankton uptake. The third mesocosm (control) did not receive any nutrients. The incubation temperature was 108C. Inorganic nutrient concentrations were determined daily. Extracellular enzyme activities, chlorophyll a (Chl a), bacterial numbers, organic phos-phorus and nitrogen were measured every two or three days.
2.3. Stimulation experiments
Four successive stimulation experiments were performed in January and February 1999 using water from the Arkona Basin, which was stored in a 100-l mesocosm. To induce phytoplankton development and nutrient depletion, the mesocosm was stored at 58C and illuminated, as described above. However, the phytoplankton development was weak and nutrients decreased slowly. Inorganic nutrient concen-trations were 0.45mM PO4and 5.42mM NO31NO2during
the first experiment and 0.07mM PO4 and 4.65mM
NO31NO2 during the last experiment. In these
experi-ments, alkaline phosphatase (SIGMA P7640) and potassium dihydrogen phosphate (PO4) (MERCK 4873) were added to
2 l of filtered (0.8mm) Arkona Basin water contained in
Duran Bottles. Final concentrations were 2, 1, or 0.15 mg l21 for alkaline phosphatase and 1mM of PO4.
The bottles were incubated at 118C in the dark and aerated with air passed through a 0.2mm filter. The peptidase
activ-ity and the activactiv-ity of added alkaline phosphatase were esti-mated every day for 5 days.
2.4. Nutrient and chlorophyll analysis
particulate organic nutrient content is the difference between total phosphorus or nitrogen and the dissolved fraction.
Chl a was estimated fluorometrically (excitation wave-length 450, and emission 670 nm) after filtration (Whatman GF/F-filter) and extraction in 90% acetone (UNESCO, 1994).
2.5. Bacterial enumeration
Water samples for bacterial counting were preserved with formaldehyde (final concentration of 0.5% v/v) (Kepner and Pratt, 1994). Sub-samples, 5–10 ml for field experiments and 1–5 ml for stimulation experiments (depending on the bacterial concentration) were filtered onto 0.2mm black
Nuclepore filters. The filters were stained with a 10 mg l21 4,6-diaminidino-2-phenylindol (DAPI) solution for 5 min and mounted with fluorescent free immersion oil (Cargille oil). Cells were counted with an epifluorescence microscope (Zeiss-Axioskop) combined with an image analysis system (Photometrix GmbH, Mu¨nchen, Germany) and the compu-ter software “IP Lab Spectrum” (Signal Analytic Corp., Vienna, USA). Twenty fields or more were counted to deter-mine a minimum number of 400 cells. Cells per ml were calculated according to Turley (1993) and cell volumes according to Sieracki et al. (1989).
2.6. Enzyme activities
Peptidase and alkaline phosphatase activity were measured according to Hoppe (1993), with leucine-4-methyl-7-coumarylamide hydrochloride (Leu-MCA) (FLUKA 61888) and 4-methylumbelliferyl phosphate (MUF-P) (SIGMA M 8883) as substrates. The maxi-mum potential rate of hydrolysis (Vmax) was measured
at concentrations of 250mM MUF-P or Leu-MCA. The
incubation was performed using cuvettes in triplicates and in the dark. Incubation temperatures were in situ in field investigations, or the temperatures at which the other experiments were performed. Fluorescence measurements were made using a spectrofluorometer (SFM 25, KONTRON Instruments GmbH, Neufahrn, Germany) at 364 nm excitation and 445 nm emission wave-lengths. The Vmaxdescribes the enzyme activity in a certain
volume of water in nmole l21h21 (nM h21), whereas the ‘specific’ peptidase enzyme activity is calculated per bacter-ial cell and is given in amol cell21h21. Because phytoplank-ton is the main producer of alkaline phosphatase during its growth phase, the enzyme activity in mesocosm experi-ments is related to the phytoplankton biomass as specific alkaline phosphatase activity and is given in nMmg21Chl
a h21.
All calculations and statistical analyses were performed with computer software Microsoft Excel 97.
3. Results
3.1. Field investigations
Alkaline phosphatase and peptidase activities in the euphotic zone of the Gotland Basin in July 1993 are shown in Fig. 1. An inverse relationship between the extra-cellular enzymes and their respective nutrients was observed. In the upper 12 m, phosphate concentrations were at the detection limit (0–0.02mM) and increased to
0.35mM at 21 m. Alkaline phosphatase activity reached a
maximum of 300 nM h21 at 7 m and decreased to 50 nM h21 in 21 m. The correlation coefficient between phosphate and alkaline phosphatase activity was r
20:85 n9;p,0:01:Peptidase activity varied between
65 and 73 nM h21in the upper 12 m and decreased drasti-cally to 17 nM h21at greater depths. Dissolved inorganic nitrogen (DIN) concentrations increased in the same depth
profile, from 0.1–0.2mM in the upper 12 m to 0.45mM at
21 m. DIN and peptidase activity correlated with a coeffi-cient of r20:78 n9;p,0:05:
In the Pomeranian Bight, DIN decreased with increasing distance from the fresh water input (Bodungen et al., 1995; Nausch et al., 1999). Within these gradients, peptidase activities showed an inverse relationship to DIN and a DIN threshold concentration of 3–4mM could be detected
for this relationship. At higher DIN concentrations, the peptidase activity remained low and independent from the nutrient concentrations. The correlation coefficient for the data shown in Fig. 2 was r0:43 n62;p,0:01:
The correlation coefficient increased to r0:55 n22; p,0:01 if only DIN concentrations below 4mM were
applied.
With increasing alkaline phosphatase activities, up to a
Vmaxof 200 nM h21, the peptidase activity also increased. At
higher alkaline phosphatase activities, the peptidase
Fig. 2. Peptidase activities in relation to dissolved inorganic nitrogen concentrations in the Pomeranian Bight.
activities remained constant. The correlation coefficient between the two activities was r0:68 n18; p
0:01:Using a curve fitting programme of Excel-software,
the best description of this relationship was obtained with a third level polynominal function (Fig. 3). The same relation-ship between alkaline phosphatase and peptidase activity was also found in the Gotland Basin, where the peptidase activity did not increase any further when phosphatase activities increased higher than 250mM h21. In this region,
the correlation coefficient between both parameters was r
0:82 n9;p0:01:
3.2. Mesocosm experiments
In the mesocosm experiments, a nutrient gradient was established by phytoplankton and bacterial growth. The
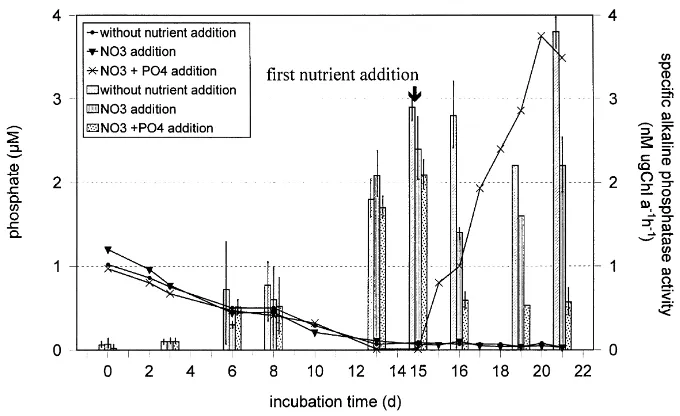
effects of phosphate and nitrate on alkaline phosphatase and peptidase activity were investigated by the addition of phosphate and nitrate when alkaline phosphatase and pepti-dase activity was high and inorganic nutrients were low. In Figs. 4 and 5, the course of phosphate, DIN and specific enzyme activities are shown before and after nutrient addi-tion. Enzyme activity per volume, e.g. Vmax (nM h21) had
the same pattern, but the effect of nutrient supply is more obvious with the specific activities because nutrient treat-ment was followed by phytoplankton and bacterial growth. The increasing quantity of enzyme-producing organisms was accompanied by an increase in enzyme activity. Using the equation T t S t×B t(T, total activity per litre water; S, specific enzyme activity; B, phytoplankton or bacterial biomass; t, time), the extent to which the change of
Vmax can be attributed to the increase of biomass was Fig. 4. Phosphate concentrations (lines) and specific alkaline phosphatase activity (bars) in mesocosm experiments.
calculated. Only about 2% of the increase of Vmaxof alkaline
phosphatase activity can be explained by the increase of phytoplankton and bacteria in the control, 38% in the meso-cosm after nitrate supply and 83% after nitrate plus phos-phate treatment. The increase of Vmax of peptidase activity
can be attributed to bacterial growth in the mesocosm with-out nutrient addition and in the mesocosm with nitrate addi-tion by about 28%. In the mesocosm with nitrate plus phosphate additions, bacterial growth accounted for only about 15% of the development of Vmaxof peptidase activity.
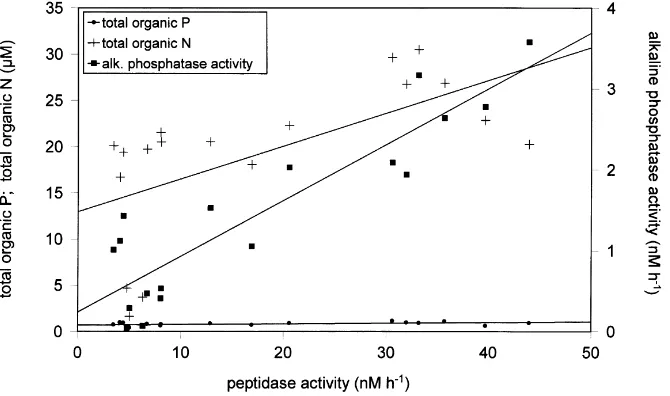
The experiments can be divided into two phases: those before and those after nutrient addition. In the first phase, the increase of alkaline phosphatase and peptidase activity was parallel to the decrease in inorganic nitrogen and phos-phate concentrations. The peptidase activity increased 5- to 7-fold whereas the alkaline phosphatase activity increased between 29- and 65-fold. The phytoplankton biomass (Chl
a), total organic phosphorus and nitrogen increased parallel
to the enzyme activities (Tables 1–3). However, the closest correlation coefficient r0:90; n18; p,0:01 was
between peptidase and alkaline phosphatase activity. There were also correlations between the peptidase activity and total (particulate and dissolved) organic nitrogen r
0:61; n18; p,0:01 and to a lesser extent with total
(particulate and dissolved) organic phosphorus r0:48; n18;p,0:05(Fig. 6).
In the second phase, the alkaline phosphatase activity reacted as expected, with a decrease following the addition of phosphate. The addition of nitrate alone resulted in an increase of Vmax(Table 2), but the specific alkaline
phospha-tase activity was reduced (Fig. 4). The peptidase activity was highest after simultaneous treatment with nitrate and phosphate and correlated better with Chl a and organic phosphorus than with organic nitrogen concentrations
Table 1
Development of alkaline phosphatase activity (APA) and peptidase activity and different biomass parameters in mesocosm experiments without nutrient addition
Parameter Incubation time (days)
0 3 6 8 13 15 17 20
NO3(mM) 5.74 3.87 2.06 1.91 0.16 0.05 0.1 0.28
PO4(mM) 1.02 0.75 0.5 0.5 0.07 0.07 0.07 0.04
APA (nM h21) 0.0 0.5 1.6 1.5 1.9 3.6 3.0 4.4
Spec. APA (nMmg21Chl a h21) 0.1 0.1 0.7 0.8 1.8 2.9 2.8 3.8
Peptidase activity (nM h21) 5.0 6.7 4.4 12.9 32.0 44.0 33.3 63.3
Spec. peptidase activity (fmol cell21h21)
2.6 2.3 n.d. 3.3 n.d. 22.0 15.3 20.9
Chlorophyll a (mgl21) 1.8 4.7 2.0 2.0 1.1 1.2 1.8 1.3
Dissolved org. phosphorus (mM) 0.2 0.3 0.6 0.6 0.7 0.5 0.7 0.6
Particulate org. phosphorus (mM)
0.2 0.5 0.4 0.3 0.3 0.5 0.3 0.2
Dissolved org. nitrogen (mM) 18.9 19.1 20.3 20.4 20.3 19.8 27.4 25.7
Particulate org.nitrogen (mM) 3.8 4.8 4.7 4.6 5.2 6.2 7.7 6.5
Bacterial counts (cells ml21) 1.9×10⁶ 2.9×10⁶ n.d. 4.2×10⁶ n.d. 2.6×10⁶ 2.2×10⁶ 3.0×10⁶
Table 2
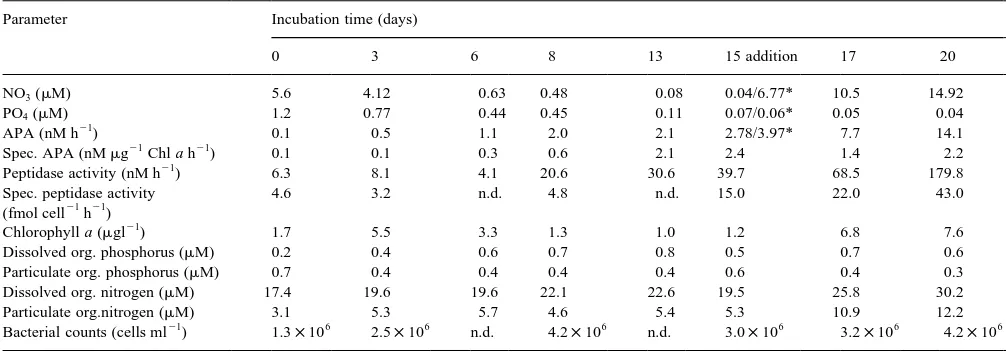
Development of alkaline phosphatase activity (APA) and peptidase activity and different biomass parameters in mesocosm experiments after nitrate addition at day 15 (* value immediately after nutrient supply)
Parameter Incubation time (days)
0 3 6 8 13 15 addition 17 20
NO3(mM) 5.6 4.12 0.63 0.48 0.08 0.04/6.77* 10.5 14.92
PO4(mM) 1.2 0.77 0.44 0.45 0.11 0.07/0.06* 0.05 0.04
APA (nM h21) 0.1 0.5 1.1 2.0 2.1 2.78/3.97* 7.7 14.1
Spec. APA (nMmg21Chl a h21) 0.1 0.1 0.3 0.6 2.1 2.4 1.4 2.2
Peptidase activity (nM h21) 6.3 8.1 4.1 20.6 30.6 39.7 68.5 179.8
Spec. peptidase activity (fmol cell21h21)
4.6 3.2 n.d. 4.8 n.d. 15.0 22.0 43.0
Chlorophyll a (mgl21) 1.7 5.5 3.3 1.3 1.0 1.2 6.8 7.6
Dissolved org. phosphorus (mM) 0.2 0.4 0.6 0.7 0.8 0.5 0.7 0.6
Particulate org. phosphorus (mM) 0.7 0.4 0.4 0.4 0.4 0.6 0.4 0.3
Dissolved org. nitrogen (mM) 17.4 19.6 19.6 22.1 22.6 19.5 25.8 30.2
Particulate org.nitrogen (mM) 3.1 5.3 5.7 4.6 5.4 5.3 10.9 12.2
(Table 3). Correlation coefficients between peptidase activ-ity and Chl a, as well as total organic phosphorus, were r
0:75 n8;p0:05:The relationship between peptidase
activity and total organic nitrogen r0:32was not
signif-icant. Bacterial growth was similar in both mesocosms, plus nitrate only and plus nitrate and phosphate. Phytoplankton biomasses and dissolved organic phosphorus levels were higher after combined treatment with phosphate and nitrate than with nitrate treatment alone (Tables 2 and 3).
3.3. Stimulation experiments
In these experiments, it was investigated whether alkaline phosphatase and phosphate supply could influence the bacterial peptidase activity. Treatment of 0.8mm-filtered
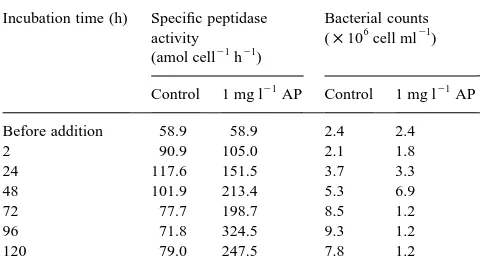
seawater with alkaline phosphatase resulted in the stimula-tion of peptidase activity. The peptidase activity increased with the incubation time, and reached a maximum at 72 or 96 h. At 96 h, activity was 6-fold higher than the control. Activity was reduced at longer incubation times (Fig. 7). The activity of the added alkaline phosphatase decreased with increasing peptidase activity. The specific peptidase activity showed the same pattern. The bacterial counts increased during the incubation time, reaching a maximum at 72 or 96 h and then declining at 120 h (Table 4).
Stimulation of peptidase activity depended on the quantity of added alkaline phosphatase (Fig. 8). The highest peptidase activity was observed at 1 mg l21 alkaline phosphatase-protein and a measured phosphatase activity of 15mM h21.
Higher levels (2 mg l21) caused a slightly lower peptidase
0 3 6 8 13 15 addition 17 20
NO3(mM) 5.68 4.12 2.21 2.02 0.08 0.05/5.95* 9.4 8.93
PO4(mM) 0.97 0.67 0.47 0.41 0.01 0.01/0.8* 1.93 3.75
APA (nM h21) 0.0 0.4 1.0 1.1 2.6 3.2 4.3 5.9
Spec. APA (nMmg21Chl a h21) 0.0 0.1 0.5 0.5 1.7 2.1 0.6 0.6
Peptidase activity (nM h21) 4.8 8.0 3.5 16.9 35.7 33.2 140.3 521.7
Spec. peptidase activity (fmol cell21h21)
2.4 3.1 n.d. 3.8 n.d. 17.0 46.3 136.0
Chlorophyll a (mgl21) 2.0 5.0 2.0 2.0 1.6 1.5 8.0 9.9
Dissolved org. phosphorus (mM) 0.2 0.4 0.6 0.8 0.9 0.6 1.5 1.3
Particulate org. phosphorus (mM) 0.3 0.2 0.2 n.d. 0.3 0.3 0.6 1.5
Dissolved org. nitrogen (mM) 17.6 20.1 18.9 19.9 22.0 21.0 25.1 28.9
Particulate org.nitrogen (mM) 3.2 6.1 4.4 4.3 7.9 7 13.1 15.5
Bacterial counts (cells ml21) 1.9×10⁶ 2.5×10⁶ n.d. 4.4×10⁶ n.d. 2.6×10⁶ 3.0×10⁶ 3.8×10⁶
Fig. 6. Relationships between peptidase activity and total organic phosphorus, and nitrogen and alkaline phosphatase activity in the first part of the mesocosm experiments, during a period of declining inorganic nutrients, and before nutrient addition. The correlation coefficients are: peptidase activity-total organic phosphorus r0:48;n18;p0:05;peptidase activity-total organic nitrogen r0:61;n18;p0:01;peptidase activity-alkaline phosphatase activity
activity. The specific activity increased during the incubation time. At 72 h-incubation, the specific peptidase activity was higher at 1 mg l21and 0.15 mg l21alkaline phosphatase than at 2 mg l21 alkaline phosphatase. At 96 h, the differences between the concentrations were not so clear.
The supply of phosphate did not influence Vmaxof
pepti-dase activity up to 48 h. Later, a suppressive effect of phos-phate on the Vmaxof the peptidase was observed (Table 5).
The specific peptidase activity did not differ significantly from the control and remained at a constant level during the incubation period. In addition, alkaline phosphatase activity was not influenced by phosphate treatment. In these experiments phosphate concentrations ranged between 0.45 and 0.21mM. Bacterial development was
the same in the control and after phosphate treatment.
4. Discussion
Inorganic nitrogen is the final product of mineralisation of
organic nitrogen compounds (Breland and Hansen, 1996; Nacro et al., 1996). According to a model of the pathway of organic matter degradation (Billen and Fontigny, 1987), bacteria take up low molecular weight nitrogen compounds, e.g. amino acids, after exoproteolytic degradation of proteins. The release of inorganic nitrogen is a result of intracellular catabolism. The uptake of amino acids by bacteria and their repressive effect on the synthesis and activity of extracellular proteases is often described (Amano et al., 1982; Hollibaugh and Azam, 1983; Goldman et al., 1987; Coffin, 1989). There are also some indications that inorganic nitrogen is involved in the regulation of pepti-dase activity (Priest, 1984) and bacteria have transport mechanisms for amino acids and inorganic nitrogen compounds (Payne, 1980). Chro´st (1991) showed that pepti-dase activity could be reduced in an eutrophic lake by treat-ing the lake water with additions of 50mM nitrate or
100mM ammonia. The investigated gradients were oxic
and ammonia was converted rapidly into nitrate. Therefore, the influence of nitrate onto the peptidase activity was inves-tigated. In contrast to the alkaline phosphatase activity, which is depressed by phosphate (Paasche and Erga, 1988; Ammerman, 1991; Nausch et al., 1998), the peptidase activity was not inhibited in our experiments in the presence of nitrate concentrations between 7 and 16mM, levels that
are representative for the Baltic Sea. There is a seasonal effect in that the highest peptidase activities are found in autumn at higher inorganic nutrient concentrations and not in summer when inorganic nutrients are lowest (Nausch et al., 1998). These observations support the conclusion that DIN cannot repress the peptidase activity and hence the inverse relationship of peptidase activity to inorganic nitro-gen is only apparent.
In the mesocosm experiments, there were no indications that nitrogen-containing matter alone was responsible for
Fig. 7. Stimulation of the peptidase activity (bars) by alkaline phosphatase and the activity of added phosphatase (lines). Standard deviations of the peptidase activity in the control and after alkaline phosphatase treatment did not exceed 8%. Standard deviations of the activity of added alkaline phosphatase ranged between 1 and 15%.
Table 4
Development of specific peptidase activity and bacterial counts after treat-ment with alkaline phosphatase
Incubation time (h) Specific peptidase activity
(amol cell21h21)
Bacterial counts (×106cell ml21)
Control 1 mg l21AP Control 1 mg l21AP
Before addition 58.9 58.9 2.4 2.4
2 90.9 105.0 2.1 1.8
24 117.6 151.5 3.7 3.3
48 101.9 213.4 5.3 6.9
72 77.7 198.7 8.5 1.2
96 71.8 324.5 9.3 1.2
the increase of peptidase activity. Dissolved and particulate nitrogen were not the dominating factors influencing the peptidase activity. Our results indicate that the peptidase activity is directly or indirectly influenced by phosphate and can be increased by alkaline phosphatase. This could explain the correlation with alkaline phosphatase activity in nutrient gradients. Perhaps, the inverse relationship between DIN and the peptidase activity is a result of the simulta-neously decline of phosphate and nitrate by phytoplankton uptake. There are two possible explanations for how alka-line phosphatase can influence the peptidase activity: (a) alkaline phosphatase is itself a glycoprotein and can act as a substrate for peptidase; and (b) alkaline phosphatase can act via phosphate release. The decline of the activity of added alkaline phosphatase during the experiments supports the first idea. However, in other experiments (Nausch, 2000), the addition of a leucine-peptidase to autoclaved seawater containing 1 mg l21alkaline phosphatase did not result in a decrease of alkaline phosphatase activity. Also in unautoclaced water samples, the alkaline phosphatase activ-ity did not decline after treatment with peptidase. These observations contradict the assumption that the peptidase activity, which was measured with Leu-MCA, can degrade the alkaline phosphatase.
A concentration-dependent stimulation of peptidase activity by alkaline phosphatase was recorded with a maxi-mum peptidase activity at 1 mg l21alkaline phosphatase. If the phosphatase can be degraded by peptidase and the degradation products are used by the bacteria, then enhanced bacterial growth can be expected. But in this experiment, bacterial counts and bacterial volumes did not differ from the control at 0.15 mg l21alkaline phosphatase (data not shown). Only after 72 h incubation, bacterial counts were significantly higher following the addition of 1 mg l21and 2 mg l21alkaline phosphatase. In other experi-ments (Table 5), treatment with alkaline phosphatase caused an increase in bacterial numbers but only to 33% above the control. Product repression by amino acids cannot be an explanation for the dose-dependent stimulation of the pepti-dase activity, because Vmaxand the specific peptidase
activ-ity were always higher than the control. In Nausch (2000), the specific peptidase activity of bacteria was repressed by small polypeptides by 22–67%. We have two hypotheses about the characteristics of dose-dependent stimulation of the peptidase activity. Firstly, if alkaline phosphatase is a substrate for the peptidase, then the capacity for the produc-tion of peptidase in each bacterial cell was exhausted at 1 mg l21. Higher substrate concentrations cannot be degraded by peptidase. Secondly, if alkaline phosphatase is not a substrate for peptidase then the available polymeric organic material in seawater can be completely converted by the petidase activity at 1 mg l21 alkaline phosphatase, and a higher stimulation has no effect because no substrate is available. The influence of different substrate concentra-tions on the interaction of alkaline phosphatase and pepti-dase activity is being investigated.
Phosphate treatment experiments should reveal if the influence of alkaline phosphatase on peptidase activity is due to phosphate release. But, phosphate did not influence the peptidase activity in substrate stimulation experiments
Fig. 8. Development of the peptidase activity (lines) and the specific peptidase activity (bars) at three different concentrations of added alkaline phosphatase. Standard deviations of all values did not exceed 5.3%.
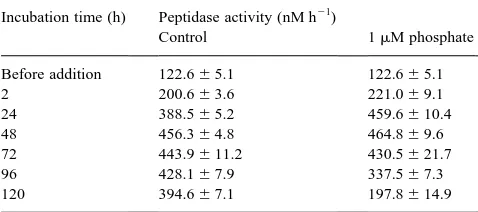
Table 5
Influence of polyphosphate and phosphate on the peptidase activity
Incubation time (h) Peptidase activity (nM h21)
Control 1mM phosphate
Before addition 122.6^5.1 122.6^5.1
2 200.6^3.6 221.0^9.1
24 388.5^5.2 459.6^10.4
48 456.3^4.8 464.8^9.6
72 443.9^11.2 430.5^21.7
96 428.1^7.9 337.5^7.3
where phytoplankton was excluded. It is possible that the phosphate in seawater was sufficient for the optimal degra-dation of organic nitrogen compounds. New organic phos-phorus substrates produced following phosphate treatment, as observed in mesocosm experiment 2 (Table 5), can stimu-late the peptidase activity. Furthermore, it could be shown that the albumin stimulated peptidase activity was enhanced by phosphate (Nausch, 2000), an indication that phosphate enhances the peptidase activity if polymeric organic nitro-gen compounds are available.
References
Amano, M., Hara, S., Taga, N., 1982. Utilization of dissolved amino acids in sea water by marine bacteria. Marine Biology 68, 31–36. Ammerman, J.W., 1991. Role of ecto-phosphorylases in phosphorus
regen-eration in estuarine and coastal ecosystems. In: Chro´st, R.J. (Ed.). Microbial Enzymes in Aquatic Environments, Springer, New York, pp. 165–186.
Asmar, F., Eiland, F., Nielsen, N.E., 1994. Effect of extracellular-enzyme activities on solubilization rate of soil organic nitrogen. Biology and Fertility of Soils 17, 32–38.
Azam, F., Cho, B.C., 1987. Bacterial utilization of organic matter in the sea. In: Fletcher, M., Gray, T.R.G., Jones, J.G. (Eds.). Ecology of Microbial Communities, Cambridge University Press, Cambridge, pp. 260–281. Billen, G., 1991. Protein degradation in aquatic environments. In: Chro´st,
R.J. (Ed.). Microbial Enzymes in Aquatic Environments, Springer, New York, pp. 123–143.
Billen, G., Fontigny, A., 1987. Dynamics of a Phaeocystis-dominated spring bloom in Belgian coastal waters. II. Bacterioplankton dynamics. Marine Ecology Progress Series 37, 249–257.
Bishop, M.L., Chang, A.C., Lee, R.W.K., 1994. Enzymatic mineralization of organic phosphorus in a volcanic soil in Chile. Soil Science 157, 238–243.
Boavida, J.M., Wetzel, R.G., 1998. Inhibition of phosphatase activity by dissolved humic substances and hydrolytic reactivation by natural ultra-violet light. Freshwater Biology 40, 285–293.
Bodungen, von B., Graeve, M., Kube, J., Meyer-Harms, B., Mumm, N., Nagel, K., Pollehne, F., Reckermann, M., Sattler, C., Siegel, H., Wodarg, D., 1995. Stoff-Flu¨sse am Grenzfluß — Transport und Umsatzprozesse im U¨ bergangsbereich zwischen Odera¨stuar und Pommerscher Bucht (TRUMP). Geowissenschaften 12/13, 479–485. Boetius, A., Lochte, K., 1994. Regulation of microbial enzyme degradation
of organic matter in deep-sea sediments. Marine Ecology Progress Series 104, 299–307.
Boetius, A., Lochte, K., 1996. Effect of organic enrichments on hydrolytic potentials and growth of bacteria in deep-sea sediments. Marine Ecol-ogy Progress Series 140, 239–250.
Breland, T.A., Hansen, S., 1996. Nitrogen mineralization and microbial biomass as affected by soil compaction. Soil Biology & Biochemistry 28, 655–663.
Carlsson, P., Graneli, E., 1993. Availability of humic bound nitrogen for coastal phytoplankton. Estuarine and Coastal Shelf Research 36, 433– 447.
Chander, K., Goyal, S., Mundra, M.C., Kapoor, K.K., 1997. Organic matter, microbial biomass and enzyme activity of soils under different crop rotations in the tropics. Biology and Fertility of Soils 24, 306–310. Christian, R.J., Karl, D.M., 1995. Bacterial ectoenzymes in marine waters:
activity ratios and temperature response in three ocean provinces. Limnology and Oceanography 40, 1042–1049.
Chro´st, R.J., 1990. Microbial enzymes in aquatic environments. In: Over-beck, J., Chro´st, R.J. (Eds.). Aquatic Microbial Ecology, Biochemical and Molecular Approaches, Springer, New York, pp. 47–79. Chro´st, R.J., 1991. Environmental control of the synthesis and activity of
aquatic microbial enzymes. In: Chro´st, R.J. (Ed.). Microbial Enzymes in Aquatic Environments, Springer, New York, pp. 29–84.
Coffin, R.B., 1989. Bacterial uptake of dissolved free and combined amino acids in estuarine waters. Limnology and Oceanography 34, 531–542. Darrah, P.R., Harris, P.J., 1986. A fluorometric method for measuring the
activity of soil enzymes. Plant and Soil 92, 81–88.
Falih, A.M.K., Wainwright, M., 1996. Microbial and enzyme activity in soils amended with a natural source of easily available carbon. Biology and Fertility of Soils 21, 177–183.
Gage, M.A., Gorham, E., 1985. Alkaline phosphatase activity and cellular phosphorus as an index of the phosphorus status of phytoplankton in Minnesota lakes. Freshwater Biology 15, 227–233.
Garde, K., Gustavson, K., 1999. The impact of UV-B radiation on alkaline phosphatase activity in phosphorus-depleted marine ecosystems. Jour-nal Experimental Marine Biology and Ecology 238, 93–106. Goldman, J.C., Caron, D.A., Dennett, M.R., 1987. Regulation of gross
growth efficiency and ammonium regeneration in bacteria by substrate C:N ratio. Limnology and Oceanography 32, 1239–1252.
Grasshoff, K., Ehrhardt, M., Kremling, K., 1983. Methods of Seawater Analysis. 2nd ed. Verlag Chemie, Weinheim (419pp.).
Halemejko, G.Z., Chro´st, R.J., 1984. The role of phosphatases in phos-phorus mineralization during decomposition of lake phytoplankton blooms. Archiv Hydrobiologie 101, 489–502.
Hernandez, I., Fernandez, J.A., Niell, F.X., 1993. Influence of phosphorus status on the seasonal variation of alkaline phosphatase activity in Porphyra umbilicalis (L.) Ku¨tzing. Journal Experimental Marine Biol-ogy and EcolBiol-ogy 173, 182–196.
Hollibaugh, J.T., Azam, F., 1983. Microbial degradation of dissolved proteins in seawater. Limnology and Oceanography 28, 1104–1116. Hoppe, H.G., Gocke, K., Kuparinen, J., 1990. Effects of H2S on the
hetero-trophic substrate uptake, extracellular enzyme activity and growth of brackish water bacteria. Marine Ecology Progress Series 64, 157–167. Hoppe, H.G., 1993. Use of fluorogenic model substrates for extracellular enzyme activity (EEA) measurement of bacteria. In: Kemp, P.F., Sherr, B.F., Sherr, E.B., Cole, J.J. (Eds.). Handbook of Methods in Aquatic Microbial Ecology, Lewis Publishers, Boca Raton, pp. 423–431. Hoppe, H.G., Ullrich, S., 1999. Profiles of ectoenzymes in the Indian
Ocean: phenomena of phosphatase activity in the mesopelagic zone. Aquatic Microbial Ecology 19, 139–148.
Kandeler, E., Kampichler, C., Horak, O., 1996. Influence of heavy metals on the functional diversity of soil microbial communities. Biology and Fertility of Soils 23, 299–306.
Karner, M., Rassoulzadegan, C., Rassoulzadegan, F., 1995. Extracellular enzyme activity: indications for short-term variability in a coastal marine ecosystem. Microbial Ecology 30, 143–156.
Kepner, R.L., Pratt, J.R., 1994. Use of fluorochromes for direct enumeration of total bacteria in environmental samples. Microbiological Reviews 58, 603–615.
Martinez, J., Smith, D.C., Steward, G.F., Azam, F., 1996. Variability in ectohydrolytic enzyme activities of pelagic marine bacteria and its significance for substrate processing in the sea. Aquatic Microbial Ecol-ogy 10, 223–230.
Mu¨nster, U., 1991. Extracellular enzyme activity in eutrophic and polyhu-mic lakes. In: Chro´st, R.J. (Ed.). Microbial Enzymes in Aquatic Envir-onments, Springer, New York, pp. 96–123.
Nacro, H.B., Benest, D., Abbadie, L., 1996. Distribution of microbial activ-ities and organic matter according to particle size in humid sacanna soil (Lamo, Cote d’Ivoire). Soil Biology & Biochemistry 28, 1687–1697. Nausch, G., Nehring, D., Aertebjerg, G., 1999. Anthropogenic nutrient load
of the Baltic Sea. Limnologica 29, 233–241.
Nausch, M., Pollehne, F., Kerstan, E., 1998. Extracellular enzyme activities in relation to hydrodynamics in the Pomeranian Bight (southern Baltic Sea). Microbial Ecology 36, 251–258.
Nausch, M., 2000. Experimental evidence for interactions between bacter-ial peptidase and alkaline phosphatase activity in the Baltic Sea. Submitted for publication.
Quality 22, 832–838.
Payne, J.W. (Ed.), 1980. Microorganisms and nitrogen sources. Wiley and Sons, Chichester (cited in: Goldman, J.C., Caron, D.A., Dennett, M.R., 1987. Regulation of gross growth efficiency and ammonium regenera-tion in bacteria by substrate C:N ratio, Limnology and Oceanography 32, pp. 1239–1252).
Paasche, E., Erga, S.R., 1988. Phosphorus and nitrogen limitation of phyto-plankton in the inner Oslofjord (Norway). Sarsia 73, 229–243. Priest, F.G., 1984. Extracellular enzymes. Aspects of Microbiology, vol. 9.
Van Nostrand Reinhold, Wokingham (78pp.).
Rohde, K.H., Nehring, D., 1979. Ausgewa¨hlte Methoden zur Bestimmung von Inhaltsstoffen im Meer— und Brackwasser. Geoda¨tische Geophy-sikalische Vero¨ffentlichungen, Reihe IV 27, 1–68.
Shand, A.C., Smith, S., 1997. Enzymatic release of phosphate from model substrates and P compounds in soil solution from peaty podzol. Biology and Fertility of Soils 24, 183–187.
Stewart, A.J., Wetzel, R.G., 1982. Influence of dissolved humic materials on carbon assimilation and alkaline phosphatase activity in natural algal-bacterial assemblage. Freshwater Biology 12, 369–380. Turley, C.M., 1993. Direct estimates of bacterial numbers in seawater
samples without incurring cell loss due to sample storage. In: Kemp, P.F., Sherr, B.F., Sherr, E.B., Cole, J.J. (Eds.). Handbook of Methods in Aquatic Microbial Ecology, Lewis Publishers, Boca Raton, pp. 143– 147.
UNESCO, 1994. Protocols for the Joint Global Ocean flux Study (JGOFS) core measurements. IOC/SCOR Manual and Guides 29, pp. 128–134. Wasmund, N., Voss, M., Lochte, K., 2000. Annual nitrogen fixation pattern
in the Baltic Proper. Marine Ecology Progress Series. In press. Yamada, R., Imaizumi, M., Sano, K., 1983. The influence of heavy metal on