www.elsevier.com / locate / livprodsci
Estimating daily yields of cows from different milking schemes
a ,
*
a a b cL.R. Schaeffer
, J. Jamrozik , R. Van Dorp , D.F. Kelton , D.W. Lazenby
a
Centre for Genetic Improvement of Livestock, Department of Animal and Poultry Science, University of Guelph, Guelph, ON,
Canada N1G 2 W1
b
Population Medicine, Ontario Veterinary College, University of Guelph, Guelph, Ontario, Canada
c
Ontario Dairy Herd Improvement Corporation, Guelph, Ontario, Canada
Received 6 August 1999; received in revised form 16 December 1999; accepted 19 December 1999
Abstract
A multiple regression model was used to derive equations for predicting 24 h milk, fat, and protein yields of dairy cows on either two-times or three-times-a-day milking under different testing schemes. New prediction equations were developed for 72 subclasses of days in milk, parity, and season of calving for each of 18 possible three-times-a-day testing schemes and for each of four possible two-times-a-day testing schemes. The prediction equations were compared to current official factors and found to be slightly better than the official factors. For two-times-a-day testing schemes the accuracies of 24 h fat yield predictions from one milk weight and one fat and protein determination were 0.88 for an evening milking and 0.89 for a morning milking. For three-times-a-day milkings the accuracies of 24 h fat and protein yields from two milk weights with fat and protein contents on each were 0.91–0.94 depending on which two of the three milkings were observed. If only one of three milkings were recorded, then accuracies of 24 h predicted fat and protein yields dropped to 0.80–0.82. More data from herds milking three-times-a-day are needed on all breeds. 2000 Elsevier Science B.V. All rights reserved.
Keywords: Dairy cattle; Daily yields; Recording schemes; Prediction
1. Introduction evolution of computing hardware and software, many producers can obtain many of the benefits of The cost (in money, time, and inconvenience) of milk recording from automated milking systems. recording individual cow milk yields needs to be as Therefore, traditional milk recording organizations low as possible to keep dairy producers enrolled on need to evolve and participate in hardware and milk recording programs. For many years, Canadian software developments in order that the yield data milk recording programs had very stringent rules and for cows can be collected and utilized in national regulations, and had a limited number of milk genetic evaluation systems. The role of supervising recording plans available to producers. With the data collection has changed to a role of collecting and identifying the type of data that has been collected, and letting the producer decide how often
*Coresponding author. Tel.: 11-519-824-120; fax: 1
1-519-to provide the data. At the same time, breed
associa-767-0573.
E-mail address: [email protected] (L.R. Schaeffer). tions want to maintain awards programs for top
producing cows, so they continue to demand a high milk weight is recorded, but fat and protein content
level of supervised testing. are not necessarily determined for that sample. Thus,
A growing segment of the Canadian dairy industry a method to predict 24 h yields needs to incorporate includes herds that milk cows three-times per day phenotypic correlations between milk, fat, and pro-(33) versus the traditional two-times per day (23). tein yields.
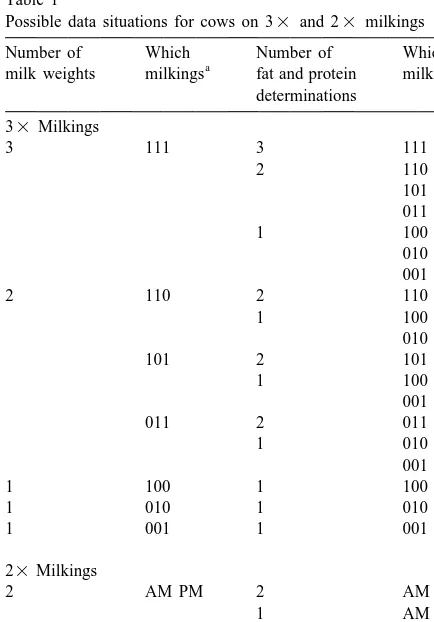
Many 33 herds have not enrolled in milk recording An important feature in 33 herds is the interval because of a lack of adjustment factors to estimate between milkings. In practice, time between startup total 24 h yields from just one or two of the three of the milking machines is known, and this interval milkings. With the increased flexibility in milk is assumed to be the same for all cows in a herd. recording schemes, there are many possible scenarios However, in a milking parlour situation, the intervals with 33 herds on a given test day. These combina- for individual cows could vary markedly. A cow tions are shown in Table 1 along with the combina- may enter the parlour first out of 20 cows at one tions for 23 herds in terms of availability of milk, milking and last out of 20 cows in the next milking. fat, and protein yields. The word sample denotes one If the herd is large, then the cow may not enter the of the three milkings in a 33 herd or one of the two holding pen in the same order every milking. Thus, milkings in a 23 herd. At the time of sampling, a there could be significant deviations from the mean interval between machine startups for many indi-viduals.
Stage of lactation of the cow has been shown to be
Table 1
important in predicting 24 h yields (Schaeffer and
Possible data situations for cows on 33 and 23 milkings
Rennie, 1976; Lee and Wardrop, 1984). Also, parity
Number of Which Number of Which
a and season of calving may have effects on yield
milk weights milkings fat and protein milkings
predictions. With these considerations in mind, the
determinations
objectives of this study were to develop a model for
33Milkings
estimating 24 h milk and component yields, to
3 111 3 111
estimate the parameters to adjust sample yields, and
2 110
101 to verify the factors in terms of accuracy of
predic-011 tions for both 23 and 33 testing schemes.
1 100
Data were collected from three Ontario and one
001
Alberta Holstein herds from 1996 through 1998 and
011 2 011
1 010 included 3857 test day records from 996 cows. Cows
001 were milked three-times per day. The first milking of
1 100 1 100
the day was defined as the milking that occurred
1 010 1 010
after 0 h on a 24 h clock. Samples for milk, fat, and
1 001 1 001
protein yield were taken at each milking and the
23Milkings milking start time was recorded for each cow. The
2 AM PM 2 AM PM phenotypic means and variances are given in Table
1 AM
Indicates when samples were taken, for 33 milkings, the
For the 33 data, 24 h yields were calculated as
three digit code correspond to mornings, afternoon, and evening
Table 2 third and later), and season of calving (October to Means and variances of 24 h test day yields (kg) April and May to September) for a total of 72
Trait Cows Records Mean Variance subclasses. The days in milk (DIM) classes are shown in Table 3. The intervals for the 33 data
23data
Milk yield 2384 14 013 27.0 81.60 were expressed as deviations from 480 min. Recall
Fat yield 2378 13 899 0.983 0.0981 that the intervals for each cow were known. Protein yield 2380 13 929 0.873 0.0659 The model was modified to fit the possible
combi-nations given in Table 1 by removing the appropriate
33data
covariates. For example, the situation when there are
Milk yield 996 3857 32.8 84.66
Fat yield 988 3592 1.116 0.1154 only two sample weights for milk, fat, and protein
Protein yield 988 3592 1.041 0.0600 and these are from the first two milkings, then
b (INT ) , b (Milk) , b (Fat) , and b (Prot) would3 3 6 3 9 3 12 3
be removed from the model, and the other parame-ters would be estimated.
three milkings. Milk, fat, and protein yields were Cow effects were random, but the ratio of residual analyzed separately. The general model for a 24 h to cow variances was never estimated due to the
yield was small size of the data set. The assumed ratio was 1.0,
corresponding to a repeatability of 0.5. Cows were
yijkm5 (HTD )i1Cowj also assumed to be genetically unrelated for these
1[b01b (INT )1 11b (INT )2 21b (INT )3 3 analyses.
1b (Milk)4 11b (Milk)5 21b (Milk)6 3
2.3. Two-times-a-day data
1b (Fat)7 11b (Fat)8 21b (Fat)9 3
1b (Prot)10 11b (Prot)11 21b (Prot) ]12 3 k
Data were collected from 19 Holstein herds in 1eijkm,
Alberta, Manitoba, British Columbia, and Ontario.
where Morning (AM) and evening (PM) milk weights and
their corresponding fat and protein percentages were
yijkm is the m-th 24 h yield (milk, fat, or obtained for 2395 cows over their completed
lacta-protein) made by tions. Out of 14 878 test day records, 4989 were
cow j in herd-test date subclass i at days from first lactation cows, 3572 were from second
in milk, parity, lactation cows, and 6407 were from third and later
and season of calving subclass k, lactation cows. Records were collected from 1991 (HTD )i is a fixed effect of herd-test date,
Cowj is a random effect of cow j (includes genetic and
permanent environmental effects), Table 3
Definition of days in milk classes
(INT )t is the interval before the t-th milking,
(Milk)t is the sample milk weight at the t-th Class Range
milking,
1 #30 d
(Fat)t is the sample fat weight at the t-th 2 31–50 d
milking, 3 51–70 d
4 71–90 d
(Prot)t is the sample protein weight at the t-th
5 91–110 d
milking,
6 111–130 d
and
7 131–150 d
eijkm is the residual effect. 8 151–180 d
9 181–220 d
10 221–260 d
Note that the regression coefficients were nested
11 261–300 d
within subclasses that were formed on the basis of
12 .300 d
through 1993. All herds had automated milking For the 33 data set, the same data that were used systems so that milk yields between supervised test to estimate the regression coefficients were used to days were available. The data were previously used calculate accuracies of prediction. Hence the derived by Schaeffer and Jamrozik (1996). The raw pheno- regression coefficients should perform better than typic means and variances are given in Table 2. any factors that may have been derived from other The data were split into two subsets, where one data. Further data need to be collected for a true was used to estimate the factors for predicting 24 h verification analysis.
yields, and the other data set was used to verify the The current official milk recording program uti-accuracy of the factors. Data set 1 contained 10 288 lizes adjustment factors for 23 and 33 herds. For test day records from 1672 cows in 14 herds, with 23 herds with either AM or PM yields measured, each of the four provinces represented by at least one the factors used were derived by Lee and Wardrop herd. Data set 2 contained the other five herds with (1984). These factors multiplicatively adjust milk 4590 test day records also from 1672 cows. The start yields for milking interval and stage of lactation, and of milking times for AM and PM milkings were only multiplicatively adjust fat percentage for milking available on a herd basis on that test day and the interval, but there are no factors for protein per-intervals were expressed as deviations from 720 min. centage. For 33 data, there is a requirement that two of the three samples have milk weights and one or both of these have fat and protein composition 2.4. Model for two-times data
known. The same procedure and factors as reported by Wiggans (1986) are used to multiply the totals The model for 23 data set 1 was the same as for
from two milkings. These factors were applied to the the 33 data set, except that the number of
covari-complete set of 23 data and to the 33 data in this ables was reduced because there were only two
study for comparison. milkings rather than three in these data. Also, only
No tests were conducted to test whether more or one interval needs to be known because the two
less than 72 subclasses of prediction equations were intervals sum to 24 h. The intervals were only known
needed. A reduction in the number of subclasses for each herd-test date rather than for each cow.
should be possible without sacrificing accuracy of predictions. This can be done safely only after more 2.5. Verification
data are collected. In the current study, an average of 23 cows or 63 test day records per subclass were in The analyses provided regression coefficients for
the 23 data sets, and only 13 cows and 53 test day predicting 24 h yields in various situations of
records in the 33 data set. Thus, standard errors on missing information, and for the 72 subclasses of
regression coefficients for some subclasses could be days in milk, parity, and season of calving. For the
very large. 23 data set, the 24 h yields were predicted in data
set 2 from the regression coefficients estimated from data set 1. The predicted 24 h yields were compared
3. Results and discussion
to the actual 24 h yields, so that the variance of the differences could be calculated for each situation.
3.1. Two-times-a-day milkings The variance of the difference is denoted as Var(dif ).
The variance of actual 24 h yields, denoted as
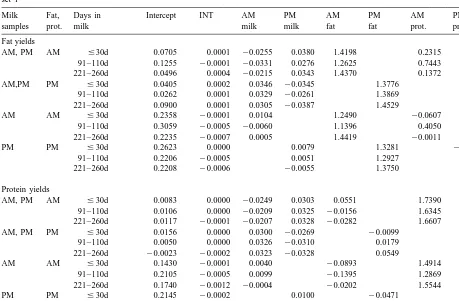
A sample of the 23 prediction equations are
Var(act), were available from Table 2. The accuracy
given in Table 4 for fat and protein yields. The of the prediction, (Acc), was defined as
intercept values are relative to zero so that a value of 0.1366 for predicting protein yield from a PM
Acc5Var(act) /(Var(act)1Var(dif )).
milking at 221 to 260 DIM means that 0.1366 kg Thus, accuracy was derived from an independent set must be added after multiplying the PM protein yield of records. Note that Var(dif ) includes the square of by 1.6581 and multiplying PM milk and fat yields by
Table 4
Prediction equations for fat and protein yields for first lactation Holsteins calving between October to April for 23 milking herds for data set 1
Milk Fat, Days in Intercept INT AM PM AM PM AM PM
samples prot. milk milk milk fat fat prot. prot.
Fat yields
AM, PM AM #30d 0.0705 0.0001 20.0255 0.0380 1.4198 0.2315
91–110d 0.1255 20.0001 20.0331 0.0276 1.2625 0.7443
221–260d 0.0496 0.0004 20.0215 0.0343 1.4370 0.1372
AM,PM PM #30d 0.0405 0.0002 0.0346 20.0345 1.3776 0.5893
91–110d 0.0262 0.0001 0.0329 20.0261 1.3869 0.3294
221–260d 0.0900 0.0001 0.0305 20.0387 1.4529 0.5732
AM AM #30d 0.2358 20.0001 0.0104 1.2490 20.0607
91–110d 0.3059 20.0005 20.0060 1.1396 0.4050
221–260d 0.2235 20.0007 0.0005 1.4419 20.0011
PM PM #30d 0.2623 0.0000 0.0079 1.3281 20.1241
91–110d 0.2206 20.0005 0.0051 1.2927 0.0709
221–260d 0.2208 20.0006 20.0055 1.3750 0.3035
Protein yields
AM, PM AM #30d 0.0083 0.0000 20.0249 0.0303 0.0551 1.7390
91–110d 0.0106 0.0000 20.0209 0.0325 20.0156 1.6345 221–260d 0.0117 20.0001 20.0207 0.0328 20.0282 1.6607
AM, PM PM #30d 0.0156 0.0000 0.0300 20.0269 20.0099 1.8679
91–110d 0.0050 0.0000 0.0326 20.0310 0.0179 1.9048
221–260d 20.0023 20.0002 0.0323 20.0328 0.0549 1.9454
AM AM #30d 0.1430 20.0001 0.0040 20.0893 1.4914
91–110d 0.2105 20.0005 0.0099 20.1395 1.2869
221–260d 0.1740 20.0012 20.0004 20.0202 1.5544
PM PM #30d 0.2145 20.0002 0.0100 20.0471 1.2242
91–110d 0.1997 20.0007 20.0003 20.0765 1.6556
221–260d 0.1366 20.0009 0.0022 20.0232 1.6581
interval by 20.0009. Because the intercept values The regressions on previous milking interval seem to are additive, the estimates will need to be re-esti- be very small. The variation in intervals between 23 mated every few years, and they could also vary herds was not that great.
depending on herd level of production. There were Cow effects were included as random effects with not enough data to study the effects of production a variance ratio of 1.0, and genetic relationships levels on predictions. An alternative is to use meth- among cows were ignored. The variance ratio was odology that does not have an additive intercept and not estimated, and therefore, may not have been is strictly multiplicative. However, experience with optimal. Assuming that repeatability could be be-age at calving correction factors with 305-d yields tween 0.4 and 0.7, the range in variance ratios could has shown that multiplicative factors can also change be from 0.43 to 1.5. Within such a range there would with time (Ptak et al., 1993). Thus, either additive or not be significant changes in estimates of cow multiplicative procedures need to be continually effects, so that estimates of fixed effects and
regres-updated to be effective. sion coefficients would be negligible. The value of
Some of the regression coefficients in Table 4 1.0 reflects a repeatability of 0.5 for test day yields were negative, but were generally of small mag- within lactations.
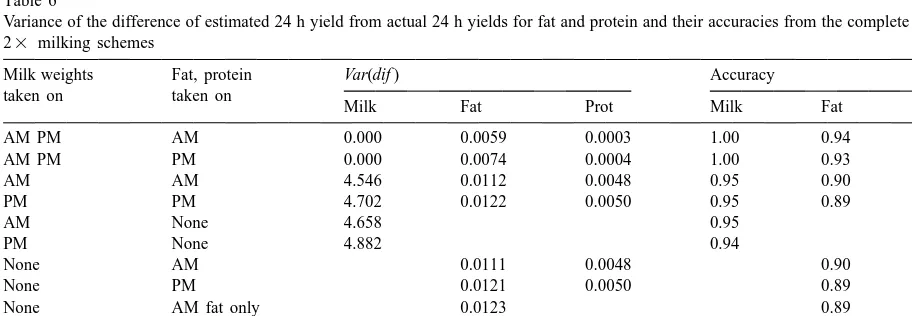
Table 5 Note that 24 h protein yields were predicted more Variance of the difference of estimated 24 h yield from actual 24 h accurately than fat yields. This has been reported in yields for fat and protein and their accuracies from data set 2 for
previous studies (Wiggans, 1986). When there was
23 milking schemes. Prediction equations were derived from
only one milk weight with fat and protein, then the
data set 1
accuracy of 24 h fat yield predictions were reduced
Milk weights Fat, protein Var(dif ) Accuracy
to 0.88 for the PM sample and 0.89 for the AM
taken on taken on
Fat Prot Fat Prot sample. There was little difference in accuracies of
AM PM AM 0.0069 0.0003 0.93 0.995 24 h fat or protein yield predictions when the traits
AM PM PM 0.0086 0.0005 0.92 0.99 were considered separately. Thus, there was no
AM AM 0.0123 0.0059 0.89 0.92
practical advantage in a prediction equation for 24 h
PM PM 0.0140 0.0069 0.88 0.91
fat(protein) that included sample weights for milk,
None AM 0.0120 0.0057 0.89 0.92
fat, and protein.
None PM 0.0136 0.0068 0.88 0.91
None AM fat only 0.0131 0.88 The current official adjustment factors gave
sig-None PM fat only 0.0134 0.88 nificantly lower accuracies for all 24 h yields (Table
None AM prot only 0.0057 0.92
7). Thus, accounting for days in milk, parities, and
None PM prot only 0.0069 0.91
seasons of calving seemed to benefit the 24 h predictions in this study. Alternating AM–PM test-cow effects because estimates of these factors would ing schemes have been in use for many years not be available in practical situations, but these
factors have to be considered in estimating the
Table 7
regression coefficients. The complete set of 23 data
Variance of the difference of estimated 24 h yield from actual 24 h
were used to derive prediction equations and verifi- yields for milk, fat and protein and their accuracies from the cation was made on the same data (Table 6). This complete data for 23 milking schemes using the current official
factors
was to see how much bias in accuracy could
potentially exist in the 33 data where splitting the Trait Sample Var(dif ) Accuracy
data was not feasible for verification. The accuracies
Milk AM 5.053 0.94
shown in Table 6 were only slightly larger than those PM 7.573 0.92
in Table 5, and may be due to a larger data set being Fat AM 0.0166 0.86
PM 0.0193 0.84
used to estimate the prediction equations, and to the
Protein AM 0.0054 0.92
fact that they were applied to the same data from
PM 0.0081 0.89
which they were estimated.
Table 6
Variance of the difference of estimated 24 h yield from actual 24 h yields for fat and protein and their accuracies from the complete data for 23 milking schemes
Milk weights Fat, protein Var(dif ) Accuracy
taken on taken on
Milk Fat Prot Milk Fat Prot
AM PM AM 0.000 0.0059 0.0003 1.00 0.94 0.995
AM PM PM 0.000 0.0074 0.0004 1.00 0.93 0.99
AM AM 4.546 0.0112 0.0048 0.95 0.90 0.93
PM PM 4.702 0.0122 0.0050 0.95 0.89 0.93
AM None 4.658 0.95
PM None 4.882 0.94
None AM 0.0111 0.0048 0.90 0.93
None PM 0.0121 0.0050 0.89 0.93
None AM fat only 0.0123 0.89
None PM fat only 0.0122 0.89
None AM prot only 0.0049 0.93
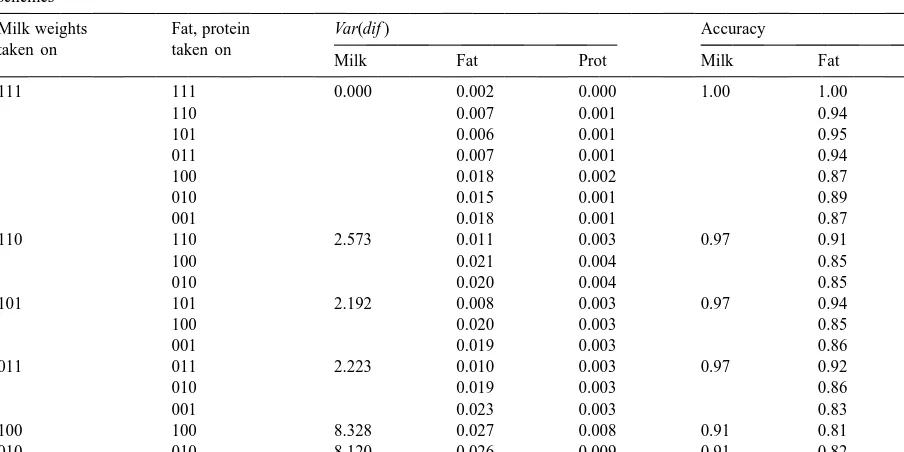
assuming an average 30-d interval between tests. The The accuracies of the prediction equations for differ-effect of increasing the interval between test days on ent 33 testing schemes are given in Tables 9 and predictions of 305-d yields is an important issue, but 10. There were differences in 24 h fat yield ac-was not included in this study. Concentration ac-was on curacies depending on the number of milk weights the accuracy of 24 h yield predictions which are the that were included. For example, when there were basic components of calculated 305-d yields. three milk weights and two of those had fat and The multiple trait regressions were chosen for this protein information the accuracies for 24 h fat yield study because a very likely testing scenario would be predictions were 0.94–0.95, but when there were one in which both AM and PM milk weights are only two milk weights and both had fat and protein available, but fat and protein content would only be information, then the accuracies dropped to 0.91– determined from one milking. Making use of correla- 0.94.
tions between traits was intended to assist in the Similarly, when there were three milk weights and
predictions. only one sample of fat and protein, the accuracy of
In Tables 5 and 6 where ‘None’ indicates that no 24 h fat yield predictions was 0.87–0.89, but when milk weight was available, provides a comparison of there were two milk weights and only one fat and predictions of fat and protein yields as single traits in protein sample, then the accuracy was 0.83–0.86. contrast to when one or more milk weights were also The worst case was when there was only one milk available. The current official procedure is applied to weight and one sample for fat and protein, the traits independently as in Table 7, for comparison. accuracy of 24 h fat yield predictions decreased to 0.80–0.82. Hence in a 33 milking scheme, the
3.2. Three-times-a-day milkings accuracies of prediction depend on the number of
milk weights and all traits should be included in the A sample of the prediction equations for 33 prediction equations for each trait.
herds are shown in Table 8 for fat and protein yields. When fat (protein) was considered separately in
Table 8
Prediction equations for fat and protein yields for first lactation Holsteins calving between October to April for 33 milking herds
Milk Fat, Days in Intercept INT1 INT2 1st 2nd 1st 2nd 1st 2nd
samples prot. milk milk milk fat fat prot prot
Fat yields
110 110 #30d 0.1405 0.0004 0.0016 20.0148 0.0223 1.0783 1.1410 0.0537 0.2326 91–110d 0.1994 20.0002 20.0004 0.0439 20.0275 0.9733 1.1700 21.2844 0.9995 221–260d 0.1906 20.0004 20.0012 0.0059 0.0096 0.8596 0.9137 0.2845 20.0637 110 100 #30d 0.1830 0.0008 0.0015 20.0491 0.0538 1.4476 1.1285
91–110d 0.3106 0.0001 20.0005 20.0202 0.0348 1.6150 20.0353 221–260d 0.2438 20.0010 20.0017 0.0130 0.0417 1.1973 20.5177
110 010 #30d 0.2109 0.0004 0.0018 0.0216 0.0016 1.6640 0.2387
91–110d 0.2576 20.0005 20.0006 0.0407 20.0111 1.6989 20.4395 221–260d 0.3268 20.0007 20.0004 0.0519 20.0289 1.0240 0.3238
Protein yields
110 110 #30d 0.1269 0.0002 0.0010 0.0212 20.0043 20.1701 0.1380 0.4753 1.6475 91–110d 0.1189 20.0007 20.0009 20.0001 0.0059 20.0401 20.0844 1.2578 1.3423 221–260d 0.1135 20.0004 20.0008 0.0046 0.0127 20.0127 20.2501 1.2456 1.1862 110 100 #30d 0.1684 0.0003 0.0010 20.0278 0.0514 20.1249 1.8863
91–110d 0.1360 20.0006 20.0010 20.0276 0.0447 20.1310 2.1861 221–260d 0.1254 20.0003 20.0011 20.0238 0.0487 20.1021 1.9838
110 010 #30d 0.1414 0.0004 0.0007 0.0324 20.0127 20.0487 2.0092
Table 9
Variance of the difference of estimated 24 h yield from actual 24 h yields for milk, fat, and protein and their accuracies for 33 milking schemes
Milk weights Fat, protein Var(dif ) Accuracy
taken on taken on
Milk Fat Prot Milk Fat Prot
111 111 0.000 0.002 0.000 1.00 1.00 1.00
110 0.007 0.001 0.94 0.98
101 0.006 0.001 0.95 0.98
011 0.007 0.001 0.94 0.98
100 0.018 0.002 0.87 0.97
010 0.015 0.001 0.89 0.98
001 0.018 0.001 0.87 0.97
110 110 2.573 0.011 0.003 0.97 0.91 0.95
100 0.021 0.004 0.85 0.94
010 0.020 0.004 0.85 0.94
101 101 2.192 0.008 0.003 0.97 0.94 0.95
100 0.020 0.003 0.85 0.95
001 0.019 0.003 0.86 0.95
011 011 2.223 0.010 0.003 0.97 0.92 0.95
010 0.019 0.003 0.86 0.95
001 0.023 0.003 0.83 0.95
100 100 8.328 0.027 0.008 0.91 0.81 0.88
010 010 8.120 0.026 0.009 0.91 0.82 0.87
001 001 8.357 0.028 0.009 0.91 0.80 0.87
the prediction equations (Table 10), then the
ac-Table 10
Variance of the difference of estimated 24 h yield from actual 24 h curacies of 24 h fat yield predictions were lower at yields for fat and protein and their accuracies for 33 milking 0.90–0.93 with two samples out of three, and 0.80– schemes when considered separately
0.82 with one sample out of three milkings. Thus,
Samples Var(dif ) Accuracy having two milk weights and only one fat (protein)
sample was more accurate than having just one fat
Fat Protein Fat Protein
(protein) sample.
111 0.003 0.000 1.00 1.00
The current 33 adjustment factors were
signifi-110 0.012 0.003 0.91 0.95
101 0.009 0.003 0.93 0.95 cantly less accurate than the corresponding situations
011 0.013 0.003 0.90 0.95 in Table 9 (Table 11), but were similar to a single 100 0.027 0.009 0.81 0.87 sample for fat. The accuracies for 24 h protein yield
010 0.026 0.009 0.82 0.87
predictions were better than single samples for
001 0.029 0.009 0.80 0.87
protein in Table 10. The official factors use two milk
Table 11
Variance of the difference of estimated 24 h yield from actual 24 h yields for milk, fat, and protein and their accuracies for 33 milking schemes using the current official factors
Milk weights Fat, protein Var(dif ) Accuracy
taken on taken on
Milk Fat Prot Milk Fat Prot
110 100 3.256 0.028 0.004 0.96 0.80 0.94
010 0.027 0.004 0.81 0.94
101 100 2.510 0.031 0.004 0.97 0.79 0.94
001 0.025 0.003 0.82 0.95
011 010 2.687 0.025 0.004 0.97 0.82 0.94
weights and one fat (protein) sample similar to prediction equations for both 23 and 33 milkings,
results in Table 9. and may be useful for other studies too. A long term
plan could reduce the time needed to produce new
3.3. Conclusions prediction equations when they are needed, and
could potentially be much larger in number of cows Prediction equations for 24 h yields from 33 and breeds than those in this study. The plan should milkings seem to benefit from including milk, fat, also include collection of data on other milking and protein yields in the prediction equations for scheme alternatives such as 5 milkings within 48 h, each trait. This additional computational complexity or robotic milking.
is easily handled within a milk recording program. The modern philosophy of Canadian milk record-Thus, depending on the availability of particular ing is to let the producer decide on test day the weights on test day, the best use can be made of number of milk weights and content samples taken them to get 24 h predictions. Such flexibility should by the supervisor. This decision is influenced by allow more dairy producers to remain on milk costs and by the desire of the producer to meet breed
recording programs. association standards for awards or to receive official
Although the prediction of 24 h yields from 23 genetic evaluations on cows that might be potential milkings did not benefit from including all traits in bull dams. The responsibility of the milk recording the prediction equations, the same concepts should organization is to report exactly how the records probably be used as for 33 milkings. Only one were collected. This study was aimed at supporting breed (Holstein) has been studied, and only data this philosophy by providing 24 h yield prediction from a small number of herds was used. Therefore, procedures for 23 and 33 milking herds.
the strategy should be to allow for the possibility that 23 milkings might benefit from simultaneous
esti-mation in other breeds or in the larger Holstein Acknowledgements
population.
The accuracy of the predicted 24 h fat yield is The financial support of the Ontario Ministry of reported to dairy producers as the accuracy for the Agriculture, Food, and Rural Affairs is gratefully predicted 24 h milk, fat, and protein yields on that acknowledged. The data collection and sample test-test day, even though the accuracies for milk and ing were performed by Ontario DHI and Western protein yields would generally be higher than that for Canada DHI Services.
fat yields. The reported accuracies are, therefore, conservative. A single accuracy figure minimizes
confusion among dairy producers, because if there is References
the same information available for each trait,
produc-ers feel the accuracy should be the same for each. Lee, A.J., Wardrop, J., 1984. Predicting daily milk yield, fat percent, and protein percent from morning or afternoon tests. J.
The regression coefficients for predicting 24 h
Dairy Sci. 67, 351–357.
yields derived in this study were based on very small
Ptak, E., Horst, H.S., Schaeffer, L.R., 1993. Interaction of age and
numbers of cows, herds, and only one breed. Milk month of calving with year for Ontario Holstein production recording organizations should commit to continued traits. J. Dairy Sci. 76, 3792–3798.
sampling of a random set of 23 and 33 herds to Schaeffer, L.R., Rennie, J.C., 1976. AM–PM testing for estimat-ing lactation yields. Can. J. Anim. Sci. 56, 9–15.
supplement the established datasets. Sampling in the
Schaeffer, L.R., Jamrozik, J., 1996. Multiple trait prediction of
selected herds would require the collection of all
dairy cattle lactation yields. J. Dairy Sci. 79, 2044–2055.
three (two) samples on test day with separate fat and Wiggans, G.R., 1986. Estimating daily yields of cows milked protein analyses of each sample, and with the exact three-times-a-day. J. Dairy Sci. 69, 2935–2940.