A SHAPE SIMILARITY BASED CHANGE DETECTION APPROACH OF
MULTI-RESOLUTION REMOTE SENSING IMAGES
Penglin Zhang, Zhiyong Lv, Dan Zhang, Jiangping Chen
School of Remote Sensing and Information Engineering, Wuhan University No.129, LuoYu Road, WuHan, China
Email: [email protected]
Commission VII/5
KEY WORDS:change detection, shape similarity, remote sensing, multi-resolution image
ABSTRACT:
While a lot of approaches have been reported for change detection using high resolution images, few approaches which are used for different scale images have been developed. This paper proposes a change detection approach which can be used to detect the change in images with different scales. In this study, image objects have been extracted from images obtained at different time. Then, descriptors to describe the shape features are constructed. After that, the similarity between corresponding features is defined to measure whether the observed objects changed or not. To test the proposed approach, a test for building change detection is designed. The accuracy of our result is96.1%, which is distinctly higher than that of conventional method81.9%. The primary results show that the proposed approach is feasible and valid.
1. INTRODUCTION
Change detection plays an important role in the information ex-traction, and it is widely used in many aspects, such as disaster as-sessment, deforestation, urban growth and so on. A great amount of research about change detection has been done by many ex-perts and scholars (Singh, 1998, Coppin et al., 2004, Lu et al., 2004, Radke et al., 2005, Mao et al., 2011).
However, with the development of satellite and sensor technolo-gies, the resolution of image changes quite significantly. Images at the finest scales are not only inclined to highlight geometri-cal details, but are more easily to be affected by noise; while other images at coarser scales exhibit less precise details but a stronger immunity to noise (Moser et al., 2011). Therefore, how to detect the change among multi-resolution images is a hot top-ic, on which there have been several heated discussions going on. The O.Hall raised a multi-resolution framework for landscape analysis (Hay et al., 2001). It is noted that landscape analysis performed at a single scale is insufficient to understand multi-resolution patterns and processes (Coburn and Roberts, 2004). Methods of multi-resolution change detection can be categorized into pixel-level based and object-level based, according to the nature of the data processing granularity. The former analyzes and detects changes at pixel level (Coburn and Roberts, 2004, Bruzzone and Carlin, 2006, Celik, 2009) and the latter finds out changes at the object level (Hay et al., 2001, Lang and Blaschke, 2003). And the similarity measure for change detection was used for other kind of data source,such as SAR image. (Inglada and Mercier, 2007).
Although many methods have been raised for change detection, there are few approaches of change detection based on the shape similarity of multi-resolution images. This paper proposes a change detection approach, called FVA (feature vector analysis), for multi-resolution images, which is based on calculating the shape simi-larity of corresponding features. The FVA consists of four steps: (1) Image registration: selecting two images with different res-olutions, and performing the position registration based on the same geographic coordinate system; (2) Image segmentation: ap-plying segmentation algorithm to images to extract image blobs
(objects); (3) Image classification: classification and extracting silhouette of target objects from each image; (4) Shape similar-ity calculation: calculating shape similarsimilar-ity of the correspond-ing features. The appropriate threshold is determined to separate changed area from unchanged region.
The paper is divided into four sections. In section I, related re-search and a brief introduction of the FVA algorithm are given. The methodology is explained in section II. The result of exper-iment is discussed in section III. Finally, section IV draws the conclusion.
2. METHOD
Unlike the traditional method of change detection, the basic idea of FVA is to detect changes by calculating shape similarity of corresponding features. Since shapes of corresponding objects in multi-resolution images are similar and the shape of an object can be described, it is useful for detecting changes in multi-resolution images. In the paper, the focus is on how to describe the shape and calculate the shape similarity between the features of each candidate objects in multi-resolution images. The flowchart of FVA is shown in Figure1 and its pivotal steps are detailed in the following section.
2.1 Reprocessing and classification of images
The approach of FVA is similar to other kinds of change detec-tion techniques. It also requires some basic data pre-processing. The important pre-processing steps for FVA are as follows: (a) radiometric and coordinate normalization; (b) position registra-tion based on the same geographic coordinate system; (c) multi-resolution segmentation; (d) classification based on the result of segmentation. The feature vectors of classification result are ex-ported into a shapefile. In this paper, these steps are accomplished by ENVI and eCongnition software.
The quality of registration is critical for change detection. Mis-registration will lead the corruption of change detection result which is difficult to be mitigated via post-processing interven-tion. For the multi-resolution image, it is impossible to register ISPRS Annals of the Photogrammetry, Remote Sensing and Spatial Information Sciences, Volume I-7, 2012
XXII ISPRS Congress, 25 August – 01 September 2012, Melbourne, Australia
Figure 1. The flowchart of FVA approach
the paired images pixel by pixel accurately. The FVA avoids strict requirement for pixel-registration through position registration by selecting ground control points manually, which is based on the same geographic coordinate system.
Radiometric normalization can reduce the effect of atmospher-ic conditions, solar illumination, sensor calibration, phonologatmospher-ic variability, and other conditions. The segmentation procedure s-tarts with single image objects of one pixel and repeatedly merges them in several loops in pairs to larger units as long as an upper threshold of homogeneity is not exceeded locally. The geneity criterion is defined as a combination of spectral homo-geneity and shape homohomo-geneity. The silhouettes of features are extracted from each image through classification algorithm based on the result of segmentation. The features of objects do not over-lap with each other, and they are organized into one layer. Finally, the feature vectors of classification are exported into a shapefile together.
2.2 Features’ shape matching algorithm
After the previous pre-processing step, the extracted features for-m the canditate object feature data set (T1-feature data set and
T2-feature data set in Figure1). Features’ shape matching is
an-other crital step for the proposed approach,the mis-matching error will lead to the corruption of change detection result, so correct matching is critical for the following calculation. The algorithm of feature matching contains three steps:
step1: SetP ={p1, p2, p3. . . pi}, wherePis the canditate object feature data set,p1,p2,p3,· · ·,piare elements of the feature data set. The candidate object feature data setPis traversed one by one for matching corresponding features .
step2: Getpi from the setP, select the features which are con-tained/intersectant withpi, the alternative feature data setQ for matching is composed of the selected features:
Q={q1, q2, q3. . . qj}
wherej∈[0, i−1],qjis the candidate feature for matching.
step3: The distance between the gravity center ofpiandqjis as-sumed asdi. The minimum distancednis chosen from the
D,and
D={d1, d2, d3. . . di}
dn= min{d1, d2, d3. . . di}
whered1 = (p1, q1), d2 = (p2, q2),d3 = (p3, q3)· · ·
di= (pi, qj). The minnimum distancedn= (pm, qn),pm andqnare the matched corresponding features.
The featurepmmatches withqn, which means they are corre-sponding features at the same geographical location in each im-age. As the statement in section II, the silhouette of an object has different representation in different spatial resolution, and the al-gorithm matches the polygons which are the nearest gravity cen-ter among the polygons feature dataset. Obviously, the algorith-m algorith-matches features based on the geographical location, if there have no changes, the algorithm matches the true corresponding features, and on the contrary, the matching result is false.
2.3 Calculation of shape similarity and change detection
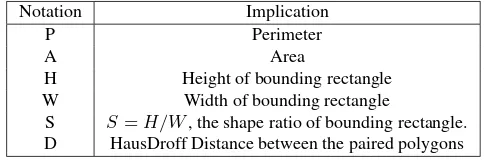
The shape of an object is an important visual feature for describ-ing image content (Loncaric, 1998, Zhang and Lu, 2004). The techniques about representation and description of shape can be generally classified into two classes: contour-based and region-based method (Zhang and Lu, 2004). In this paper, the contour shape descriptors are used (Peura and Iivarinen, 1997) and they are developed for calculating the SSM (shape similarity measure-ment). The notations used here are listed in Table 1.
Notation Implication
P Perimeter
A Area
H Height of bounding rectangle
W Width of bounding rectangle
S S=H/W, the shape ratio of bounding rectangle. D HausDroff Distance between the paired polygons
Table 1. Descriptor for an object Shape
The bounding rectangle refers to the convexity of polygon (Peu-ra and Iivarinen, 1997), the height (H) is defined as the longer edge of a rectangle than the width (W). HausDroff distance is a classical correspondence-based shape matching method (Peura and Iivarinen, 1997). It has often been used to measure similarity between shapes (Chetverikov and Khenokh, 1999, Huttenlocher and Rucklidge, 1991). In the proposed approach of FVA, thepm andqn are matched features who are selected from the feature dataset to calculate their SSM value by the above descriptors, ac-cording the following rules:
R1: SSM(S) = min(Sm Sn,
Sn
Sm), Sm= ( Hm Wn,
Wn
Hm), whereSm
is the shape ratio of an bounding rectangle. SSM(S) is defined as the factor of SSM.
R2: SSM(P) = min(Lm Ln,
Ln
Lm), whereLmis the perimeter of
pm,Lnis the perimeter ofqn.
R3: SSM(A) = min(Am An,
An
Am), whereAmis the area ofpm,
andAnis the area ofqn.
R4: SSM(D) = min(dm dn,
dn
dm), wheredm is the HausDroff
Distance between datum point andpm, anddnis the Haus-Droff Distance between datum point andqn.
ISPRS Annals of the Photogrammetry, Remote Sensing and Spatial Information Sciences, Volume I-7, 2012 XXII ISPRS Congress, 25 August – 01 September 2012, Melbourne, Australia
The above four parameters are used for calculating the value of SSM(pm, qn), which is defined in Equation (1)
SSM(pm, qn) =K1·SSM(S) +K2·SSM(P)+
K3·SSM(A) +K4·SSM(D)
(1)
WhereK1,K2,K3andK4are weight of each parameter factor,
and∑4i=1Ki = 1,SSM(pm, qn) ∈ [0,1]. When change
oc-curs, the value ofSSM(pm, qn)is lower; on the contrary, the value ofSSM(pm, qn) is higher. The weights K1, K2, K3
andK4 of each factor reflects the subjective impact on the
re-sult. Therefore, they can be determined by the owner of an ap-plication. To generate change map by FVA, it’s necessary to pro-cess the superimposed feature polygon according to the value of SSM(pm, qn)as the following rules:
(a): ifSSM(pm, qn)> T, the unchanged region ispm∪qn.
(b): ifSSM(pm, qn) ≤T, the changed region ispm∪qn−
pm∩qn.
WhereT is the threshold of SSM, which is used to determine if an object is changed. The changed region and unchanged region are generated by the rule (a) and rule (b). The processed superim-posed feature polygon is used as mask for classifying the classi-fication result of post image, then the change detection thematic map of FVA is generated.
3. RESULTS
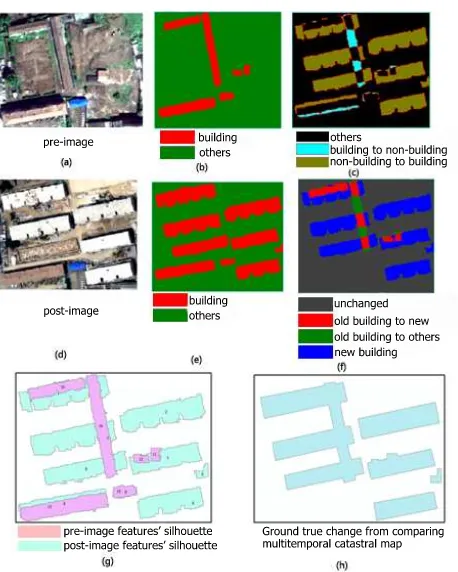
To verify the proposed approach of FVA is feasible and effective, two images are used to detect changes of building in the experi-mental district. Figure2 (a) is the pre-image of 300 pixels×250 pixels, and Figure2 (d) is the post-image of 300 pixels×250 pix-els, which are both obtained from a part of PingSun city of Shanxi province in China. They also captured by different remote sen-sors, Figure2 (a) is QuickBird image with resolution of 0.6 cen-timeter (2002), and Figure2 (d) is captured by aerial ADS camera with resolution of half meter (2003), they are multi-resolution image pairs, which have the same geographic coordinate system. The silhouette of each building is extracted from each image by eCongnition software and the respective result of thematic map of building is Figure2 (b) and Figure2 (e). To evaluate the accuracy of change detection by comparing with the method of image dif-ference, so it is necessary to resample the resolution of thematic map Figure2 (e) to 0.6 centimeter, and the change map Figure2 (c) is generated by difference the resampling result of Figure2 (b) and thematic map Figure2 (e) pixel by pixel. Figure2 (f) shows the FVA change detection result. Figure2 (h) is the true change of ground which is obtained by comparing the corresponding period of cadastral maps.
The features of thematic maps of building are exported, and the superimposed result is shown in Figure2(g). The result of feature matching and the value ofSM Mare illustrated in Table2. Espe-cially, the value ofK1,K2,K3,K4andTare0.2,0.2,0.2,0.4
and0.85, and they are effective for the experimental district.
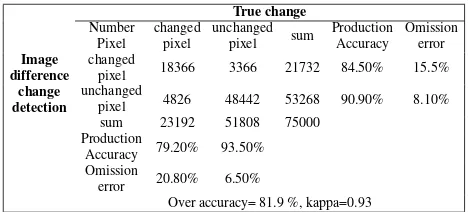
To analyze the result of change detection quantitatively, we com-pare the accuracy of image difference method with FVA approach. The cadastral maps which are contemporaneous with each image are used as the true change of ground, instead of the visual inter-pretation. From the experiment of building change detection, the
paried featureID SSM(S) SSM(L) SSM(A) SSM(D) SSM Result 1,10 0.9416 0.5502 0.3271 0.8508 0.7042 changed 2, none 0 0 0 0 0 changed 3,14 0.1243 0.9697 0.7232 0.6737 0.633 changed 4,13 0.9611 0.9625 0.922 0.84 0.9052 unchange 5,15 0.8858 0.9 0.853 0.9666 0.9145 unchange 6, none 0 0 0 0 0 changed 7,11 0.3572 0.2486 0.0985 0.7907 0.4572 changed 8, none 0 0 0 0 0 changed
9,14 0.1234 0.9623 0.8595 0.2531 0.4903 changed 11,7 0.3572 0.2486 0.0985 0.7907 0.4572 changed 12,7 0.8279 0.2415 0.0918 0.7947 0.5502 changed
Table 2. The feature matching and SMM calculated result of change detection
overall accuracy of FVA is about96.1%and Kappa coefficient is about0.98, which is higher than the method of image difference, which overall accuracy is about81.9%, and kappa coefficient is about0.93. The quantitative results in detail are illustrated in Tabel3 and Table4. The preliminary result of this experiment re-veals that the approach of FVA can detects the building changes effectively from the multi-resolution remote sensing images.
Figure 2. Process of processing and result of change detection
In the experiment, the approach of FVA integrates the spatial fea-ture in multi-resolution images, including similarity of bounding rectangle, the area of features, perimeter of features, the Haus-Droff Distance of features. There is no mis-matching error for the experimental district, and the error on the pixel level is lead by the difference of the corresponding features’ shape in multi-resolution images and the deviation of the relax geographic reg-istration.
4. DISCUSSION AND CONCLUSIONS
China has been experiencing national geographical state moni-toring, which needs to integrate multi-resolution image data to detect change. As one of the important means for earth surface monitoring, remote sensing technology provides necessary data ISPRS Annals of the Photogrammetry, Remote Sensing and Spatial Information Sciences, Volume I-7, 2012
XXII ISPRS Congress, 25 August – 01 September 2012, Melbourne, Australia
True change
pixel 18366 3366 21732 84.50% 15.5% unchanged
pixel 4826 48442 53268 90.90% 8.10% sum 23192 51808 75000
Production
Accuracy 79.20% 93.50% Omission
error 20.80% 6.50%
Over accuracy= 81.9 %, kappa=0.93
Table 3. Accuracy of the Image Difference change detection
True change
pixel 21869 1602 23471 93.2% 6.8 % unchanged
pixel 1323 50206 51529 97.4% 2.6% sum 23192 51808 75000
Production
Accuracy 94.3% 96.9% Omission
error 5.7% 3.1%
Over accuracy= 96.1 %, kappa=0.98
Table 4. Accuracy of the FVA change detection
for timely detection change at regional and global scales. With the improvement of remote sensing image resolution, traditional change detection methods cannot cope with multi-resolution and multi-sensor source data. This study has proposed an FVA ap-proach aimed at effectively detecting change of multi-resolution and multi-sensor source data. The basic idea of FVA method is to utilize the shape similarity of corresponding features in multi-scale space.
The performance of FVA was evaluated by using data from t-wo remote sensing platforms, QuickBird satellite (0.61m) and aerial ADS camera (0.5m). Comparing the true change which is obtained by analyzing the contemporaneous cadastral map with each image, the result consistently demonstrated the improve-ment of the FVA. Quantitative assessimprove-ment also demonstrated that the FVA achieved higher accuracy than the conventional approach with the overall accuracy increased from81.9%to96.1%, and the Kappa coefficient increased from0.93to0.98. The omission error of the approach of FVA is decreased from20.8%to5.7%, comparing with the method of image difference.
This research has shown that the shape similarity of correspond-ing features in multi-resolution image is highly useful for change detection. The change is detected by utilizing shape similari-ty, which can avoid strict pixel-registration. Although an object in the multi-resolution images may have different shapes, when these shapes are superimposed, the gravity centers of them are s-patially close to each other and thus these shapes are correspond-ing features and considered similar. The result of experiment showed that the approach of FVA can detect changed regions of multi-resolution images effectively.
However, more complex and larger spatial area has not yet been used for testing effectiveness of the proposed FVA approach. The FVA is invalid for detecting the change in texture other than in shape, for example: an area changes entirely from grassplot to concrete floor. Therefore, questions that remained to be addressed in the further study are: (1) To consider the topical texture and the partial spectrum in shape similarity calculation; (2) To design more effective and robust algorithms for matching corresponding features;(3) Larger images and other kinds of change detection are needed to verify the performance of the FVA approach.
5. ACKNOWLEDGMENT
This work is partly supported by project 2012BAJ15B04.
REFERENCES
Bruzzone, L. and Carlin, L., 2006. A multilevel context-based system for classification of very high spatial resolution images. Geosciences and Remote Sensing 44(9), pp. 2587–2600.
Celik, T., 2009. Multiscale Change Detection in Multitemporal Satellite Images. IEEE,Geoscience and Remote Sensing Letters 6(4), pp. 820–824.
Chetverikov, D. and Khenokh, Y., 1999. Matching for shape de-fect detection. Lecture Notes in Computer Science 1689(82), p-p. 367–374.
Coburn, C. and Roberts, A., 2004. A multiscale texture analysis procedure for improved forest stands classification. International Journal of Remote Sensing 25(20), pp. 4287–4308.
Coppin, P., Lambin, E. and Jonckheere, I., 2004. Review Arti-cle Digital change detection methods in ecosystem monitoring:a review. International Journal of Remote Sensing 25(9), pp. 1565– 1596.
Hay, G., Marceau, D., Dube, P. and Bouchard, A., 2001. A multi-scale framework for landscape analysis: Object-specific analysis and upscaling. Landscape Ecology 16(6), pp. 471– 490.
Huttenlocher, D. and Rucklidge, W., 1991. A Multi-Resolution Technique for Comparing Images Using the Hausdorff Distance. Technical Report CUCS-TR-91-1211.
Inglada, J. and Mercier, G., 2007. A new statistical similarity measure for change detection in multitemporal SAR images and its extension to multi-scale change analysis. IEEE,Geoscience and Remote Sensing 45(5), pp. 1432–1445.
Lang, S. and Blaschke, T., 2003. Digital change detection tech-niques using remotely-sensed data. International Archives of Photogrammetry, Remote Sensing and Spatial Information Sci-ences 34(3), pp. 181–186.
Loncaric, S., 1998. A survey of shape analysis techniques. Pat-tern Recognition 31(8), pp. 983–1001.
Lu, D., Mausel, P., Brondizio, E. and Moran, E., 2004. Change detection techniques. International Journal of Remote Sensing 25(12), pp. 2365–2407.
Mao, F., Gong, W. and Zhu, Z., 2011. Simple multiscale al-gorithm for layer detection with lidar. Applied Optics 50(36), pp. 6591–6598.
Moser, G., Angiati, E. and Serpico, 2011. Digital change de-tection techniques using remotely-sensed data. Geoscience and Remote Sensing Letters 8(4), pp. 725–729.
Peura, M. and Iivarinen, J., 1997. Efficiency of simple shape descriptors. In:3rd International Workshop on Visual Form p-p. 443–451.
Radke, R., Andra, S., Al-Kofahi, O. and Roysam, B., 2005. Im-age detection algorithms: a systematic survey. International Jour-nal of Remote Sensing 14(3), pp. 294–307.
Singh, A., 1998. Digital change detection techniques using remotely-sensed data. International Journal of Remote Sensing 10(6), pp. 989–1003.
Zhang, D. and Lu, G., 2004. Review of shape representation and description techniques. International Journal of Remote Sensing 37(1), pp. 1–19.
ISPRS Annals of the Photogrammetry, Remote Sensing and Spatial Information Sciences, Volume I-7, 2012 XXII ISPRS Congress, 25 August – 01 September 2012, Melbourne, Australia