STREAMED VERTICAL RECTANGLE DETECTION IN TERRESTRIAL LASER SCANS
FOR FACADE DATABASE PRODUCTION
J´erˆome Demantk´e, Bruno Vallet, Nicolas Paparoditis
IGN, MATIS, 73 avenue de Paris, 94165 Saint-Mand´e, France; Universit´e Paris-Est - [email protected]
Commission III - WG III/2
ABSTRACT:
A reliable and accurate facade database would be a major asset in applications such as localization of autonomous vehicles, registration and fine building modeling. Mobile mapping devices now provide the data required to create such a database, but efficient methods should be designed in order to tackle the enormous amount of data collected by such means (a million point per second for hours of acquisition). Another important limitation is the presence of numerous objects in urban scenes of many different types. This paper proposes a method that overcomes these two issues:
• The facade detection algorithm is streamed : the data is processed in the order it was acquired. More precisely, the input data is split into overlapping blocks which are analysed in turn to extract facade parts. Close overlapping parts are then merged in order to recover the full facade rectangle.
• The geometry of the neighborhood of each point is analysed to define a probability that the point belongs to a vertical planar patch. This probability is then injected in a RANdom SAmple Consensus (RANSAC) algorithm both in the sampling step and in the hypothesis validation, in order to favour the most reliable candidates. This ensures much more robustness against outliers during the facade detection.
This way, the main vertical rectangles are detected without any prior knowledge about the data. The only assumptions are that the facades are roughly planar and vertical. The method has been successfully tested on a large dataset in Paris. The facades are detected despite the presence of trees occluding large areas of some facades. The robustness and accuracy of the detected facade rectangles makes them useful for localization applications and for registration of other scans of the same city or of entire city models.
1 INTRODUCTION
The high level of detail of data collected by mobile lidar map-ping systems allows for fine geometrical modeling of urban en-vironment. This high level of detail makes the amounts of data required to model an entire city huge. Consequently, efficient methods are needed to detect the main scanned structures in order to split the modelization of a whole city into smaller parts (blocks, building, facades,...) Whereas numerous works focus on the fine reconstruction of certain types of urban objects (facades, trees, signalization,...) the detection of such objects in large amounts of data remains quite unexplored, making these methods hardly scalable.
In this paper, we aim to automate a necessary step in fine fa-cade modeling over large areas: detect the main fafa-cade rectangles present in the scene. This seemingly simple task faces the scaling problem and other difficulties that often leads to perform it in a semi-automatic way, by pre-selecting manually areas containing each facade or resorting to a cadastral database (Hammoudi et al., 2009), a 3D model (Benitez et al., 2010) or aerial lidar data (Poullis and You, 2009). However, automation of this treatment is necessary to enable the modeling of large-scale urban scenes.
1.1 Related Works
Common primitive detection methods such as Hough or RANSAC do not scale well to large datasets as their complexity is more than linear. This problem can be addressed in two (non exclu-sive) ways:
1. Improve the performance of the detection method.
2. Partition the data into smaller blocks.
Performance improvement:Several authors have proposed method-ologies to improve the performance of facade detection methods. For instance, (Hammoudi et al., 2009) proposes to accelerate the Hough transform algorithm by thresholding the accumulation in parameter space with an upper bound above which plane hy-potheses are directly accepted. Other methods take advantage of repeated structures in facades in order to filter and consoli-date point clouds (Friedman and Stamos (2011) and Zheng et al. (2010)).
In the proposed method, point filtering is performed in a prob-abilistic way with RANSAC : we increase the probability that RANSAC selects points belonging to vertical planes (which con-tain many points). More precisely, the probability to select a point is calculated based on local geometrical features (see 2.1).
Spatial vs temporal partitioning:In order to perform geomet-rical analysis of a huge dataset, a space partitioning is required to speed up access to close points. As space partitioning data struc-tures (Octree, kd-tree...) call for memory space, partitioning is often performed at two scale levels :
1. Data is split into large pieces : semantic ”City blocks” (Her-nandez and Marcotegui, 2009b) or horizontal grid squares for aerial data (Zhou and Neumann, 2009).
2. A dedicated spatial data structure (octree, kd-tree,...) is then constructed for each piece.
Hence, data is natively structured according to acquisition geom-etry, so splitting the data according to the acquisition order has a physical sense. It could be seen as a drawback that this way, scans of the same objects acquired at different time will not be processed together. We see that as an advantage because urban areas are dynamic environments, and many things might have changed between two scans of the same area: cars and pedes-trians might have moved, windows and doors might have been opened or closed,... All this advocates to consider two scans of the same place as different objects, which simply lie at the same geographic position. Obviously, these objects should be asso-ciated (but not assimilated) for registration or change detection purposes, but not for primitive extraction or object detection.
Facade detection in 2D:To tackle the problem of facade de-tection in laser scans, some assumptions are commonly made (Rutzinger et al., 2009):
A facade is roughly planar
The main plane is supposed vertical
Even if this verticality assumption is strong, it is verified in most cases and allows to reduce the problem of facade detection in 3D to the simpler problem of segment detection in 2D. Hence, 3D points are usually accumulated in horizontal pixel maps (Her-nandez and Marcotegui, 2009b), or planes (Frueh et al., 2005), in which lines are searched instead of planes. The lines may be found using the Hough transform or RANSAC. Both methods are adequate for detecting simple primitives in noisy data.
Multiple planes detection:Using RANSAC, problems appears when several planes have to be detected. This difficulty can be overpassed by modifying the algorithm : a minimum description length criterion is used to estimate the model parameters (Yang et al., 2010) or an order constraint favors some plane orientations (Boulaassal, 2010). In our approach, RANSAC is performed on overlapping blocks and many plane hypotheses are found and then compared to keep the most relevant.
1.2 Data acquisition
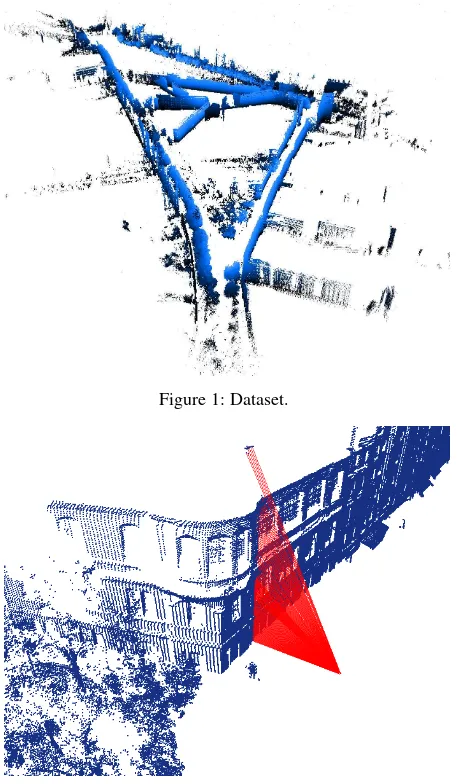
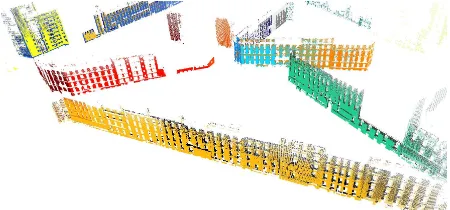
The data used for this study was acquired in a dense urban area by a mobile mapping system and consists of 3 loops over a 300m trajectory. The Lidar is a RIEGL fixed on the roof of the vehi-cle. Scanning axis is vertical and each sweep records 201 echos. Beam angles with horizontal plane are between 0°and 80°(fig 2). The dataset is displayed in figure 1 and contains approximately 10 million points. As the scan is performed at constant rate, with the mobile mapping vehicle moving at variable speed (it even sometimes stop), the density of the acquired point cloud in the direction of the scan is very variable. The simplest way to deal with this issue is to filter out points to ensure a reasonable maxi-mum density.
2 PROPOSED METHOD
The proposed method is divided into three steps:
Figure 1: Dataset.
Figure 2: Vertical sweep. Laser beams (red).
1. Weighting points : Local geometrical features are com-puted on each point. This step allows to weight 3D points with a probability that they belong to a facade.
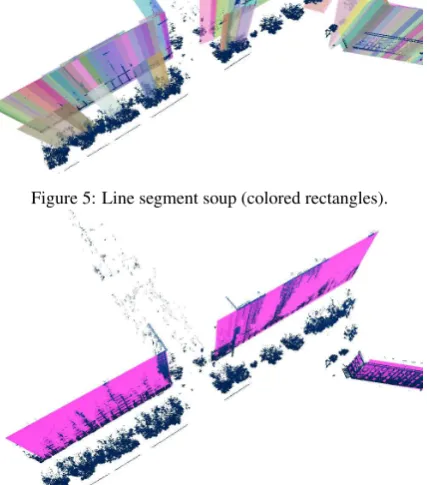
2. Finding line segments : The journey of the vehicle is re-played. At regular intervals, a weighted RANSAC is per-formed on points accumulated in a buffer. The buffer con-tains points acquired around the current position. The line segments with sufficient scores are kept. At the end of this step, a line segment soup is obtained (fig 5).
3. Merging line segments : The line segments computed with RANSAC are connected together according to a dis-tance criterion (CD) and an overlap criterion (CO). The
connectivity is checked on each pair of line segments. Then, a graph is drawn, linking the connected line segments. Fi-nally, the connected component are extracted, connected line segments are merged and the resulting facades are filtered.
Data processings are illustrated from the input point cloud to the output detected rectangles in figures 3, 4, 5, 6. We will now de-scribe these three steps in detail.
2.1 Weighting points
Figure 3: Input data : a lidar point cloud.
Figure 4: Probability that a point belongs to a flat vertical area.
Figure 5: Line segment soup (colored rectangles).
Figure 6: Output : detected rectangles (pink).
1 0
Figure 7: Probabilities that each 3D point belongs to a flat vertical area. Pf ∈ [0,1]. Values are stronger on facades, but also on
large tree trunks.
with some features that are computed on a set of nearby points Vpi.
The 3D structure tensor ofVpi is calculated. It provides three orthogonal vectors that outline the three main directions of the set of points. Let→e−1,−→e2,e−→3these normalized vectors andσ1, σ2, σ3
their corresponding norms in descending order.
A normal vector ofpi is provided by−→e3. It allows to define a
”verticality” score :
Verticality= 1− |z−→
e3|.
Another feature,a2Dis also derived from the structure tensor of
Vpi (Demantk´e et al. (2010)). It measures the flattening ofVpi on the(−→e1,e→−2)plane (perpendicular to−→e3).
a2D=
σ2−σ3
σ1
.
We usea2D andVerticality to define a probability that a 3D
point belongs to a flat vertical area. This probabilityPfis
calcu-lated as follow :
Pf =Verticality×a2D
and is displayed on figure 7.
Both features are consistent with the searched primitives that are vertical planes. Indeed, the points belonging to a local vertical plane have a higher probability to belong also to a vertical wall. Thus the following probabilityPf is intended to favor points
ac-cording to the local geometric analysis. Hence, a central idea of this paper is to combine a small-scale analysis with a primitive detection on a larger scale. This will be done by exploiting the probabilityPfin two different manners in a RANSAC algorithm.
2.2 Finding line segments
We will now search for vertical planes in the data based on a RANSAC algorithm that we modified by exploitingPf in both
Figure 8: Sketch of two point buffers, according to a virtual posi-tion of the vehicle t and the next one (t + 1) shifted withLgap.
First, we note that the facade planes are vertical, we do not need to look for planes in 3D but simply for lines in a projection of the points in the horizontal plane. If a 2D line reaches a sufficient score, it is kept. It is then converted into a line segment according to the inliers points : inliers that are farthest of each other are chosen to bound the line segment.
Streamed detection:RANSAC is not performed at once on the full data, but on overlapping point buffers. A point buffer will be associated to the trajectory interval of the vehicle while acquiring these points. If we callLtraj the length of the trajectory and
s ∈ [0, Ltraj]the curvilinear coordinate of the vehicle center
position along the trajectory, we can define thekthbuffer as the points acquired whileslies in the interval:
[kLgap, kLgap+Lbuf f er]
whereLgapis the distance between two successive interval lower
bounds andLbuf f erthe buffer length (fig 8). Hence, the overlap
between two successive buffers is equal toLoverlap=Lbuf f er−
Lgap and buffers are overlapping ifLbuf f er > Lgap. In our
experiments, we have chosenLgap = 2,5 m andLbuf f er = 10m which induces a buffer overlap of7.5m = 75%. Such a large overlap increases robustness at the cost of a slight increases in computation time.
Figure 9: Illustration of the point selection with non uniform probability.
Weighted RANSAC:On each buffer, a weighted RANSAC is performed. RANSAC iterates two steps: random selection of two points to define a 2D line and computation of a line score. The line with the best score after a certain number of iteration is returned. We introduce the probabilityPf in each step:
1. The probability to select a pointpiamong all points isP(pi) =
Pf(pi)
PP
f
. To implement this, we compute the sums:
Si=
2. Whereas in RANSAC, the score of a line is its number of in-liers, we compute the line score by adding individual inlier
piand the lineL.
InjectingPf in the point selection allows to find the most
perti-nent lines much faster. Injecting it in the score ensures that the detected lines are really along physical planes (walls).
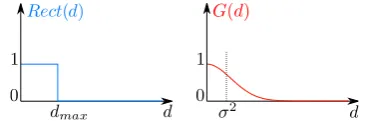
Distance weighting:RANSAC is very sensible to the inlier thresh-old. In particular points near the threshold distance will be ran-domly classed as inliers or outliers if their distance is slightly above or beneath the threshold. SummingScore(pi)over all in-liers is equivalent to summingRect(di)×Score(pi)over all points in the buffer where
Rect(d) =
1 if d≤dmax 0 if d > dmax
The problem comes from the fact thatRect(d)is not continuous neardmax. We propose to make the score continuous by
replac-ingRectwith a Gaussian functionG(cf figure 10).
Figure 10: BothRect(d)andG(d)can be used to add the scores of each point to the score of a line, depending on their orthogonal distancedto this line.Rect(d)is parameterized by the maximal distance for inliersdmaxandG(d)is parameterized withσ.
Finally, each line is restricted to the smallest segment containing all the inliers. The method has been tested withσ= 0.1m,0.5m and1m. The best results were obtained forσ = 0.1m which allows for the best precision. The output of this step is a soup of all the line segments provided by RANSAC on all buffers. In the next step, we will merge the segments of this soup that match the same line.
2.3 Merging line segments
(a)Distance. (b)Overlap.
Figure 11: The distance of[AB]to[OV](fig a) and the overlap between[OV]and[AB]projected on (OV) (fig b).
the mean of orthogonal distances ofAandBto(OV)(fig 11.a): In order to obtain a symmetric function, we define:
D([OV],[AB]) =D[OV]([AB]) +D[AB]([OV]) 2
Finally the symmetric distance criterion writes:
CD([OV],[AB])≡ D([OV],[AB])< r σ, r≥1 (1)
Two line segments satisfie this criterion if the distance is lower than a maximal tolerancer σwhereσis the sigma ofG(fig 10). Empirically, we fixed it to5σ. If two line segments are along the same line, their orthogonal distanceDis zero, even if they are distant while being on the same line. This is why we also need to measure the overlap between the segments.
Overlap criterion: Assuming−−→OV .−→AB≥0, let:
O[OV]([AB]) = min(
−−→
OV .→−u ,−−→OB.−→u)−max(OO.−−→−→u ,−→OA.−→u)
the overlapping part of the projection of[AB]on(OV)(fig 11.b). This value is positive if the projection of[AB]is effectively over-lapping[OV]. Once again, a symmetrized overlap value is given by :
O([OV],[AB]) = O[OV]([AB]) +O[AB]([OV]) 2
Finally the overlap criterion writes:
CO([OV],[AB])≡ O([OV],[AB])> s Loverlap, s∈]0,1[
(2) Empirically, we set the minimum overlap(s Loverlap)
to2.5×Loverlap.
Merge: To merge the segments globally, we create a merge graph where the nodes are the segments, and an edge between two nodes means that the corresponding segments should be merged (they satisfy both criteria). Each connected component of this graph correspond to a set of segments to be merged together. For each connected components with sufficiently high score (sum of individual inliers scores) an unique plane is estimated (least squares fit) from all the inliers of the segments to merge.
The condition for keeping connected component is a threshold on the sum of inlier scores. This means that a very large number of poor inliers can be turned into a facade, whereas a small number of good inliers on a narrow facade could be rejected. Instead, average score could be chosen, favoring small vertical flat areas. But the sum yields better results because the facades differ from other urban objects by their size.
Figure 12: Detected rectangles over the whole dataset.
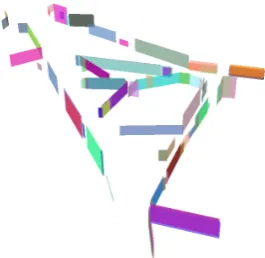
Rectangle delimitation: The plane obtained by this merging procedure should be delimited to form a facade rectangle (fig 12). We developed this methodology as a focussing step which enables to isolate blocks of points corresponding to individual facades from a large amount of data, such that one can simply choose the smallest vertical rectangle containing all inliers.
The choice of rectangle delimitation however depends on the ap-plication, in particular if a topology between the rectangles is re-quired. Recovering this facade topology is complex: facade rect-angles have to be consistent with the 3D volumes of underlying scene. Topology can be refined by computing intersections be-tween rectangles or deleting areas with low point density. Clues to detect facade bounds are provided by images, where the sky-building limit is protruding and continuous (Hammoudi et al., 2011), contribution of aerial data can also facilitate this task by exploiting another point of view.
3 RESULTS
Figure 13: Top view of a facade. Detected line (pink).
70 cm 0
Figure 14: Detected rectangles (pink) overlaid on point cloud and orthogonal distance to the closest plane.
Figure 15: Orthogonal distance to the closest plane. The accuracy of our approach is depending onσ(fig 10). Here, one can see two different facades. They are oriented along the same direction, but they are slightly shifted : the right one is darker. Both have been matched with the same main plane because this shift is lower than
5σ(equation 1).
Figure 16: Point cloud data without outliers. Inlier points of a detected rectangle have the same color. It happens one facade to be swept several times. Then, a shift due to georeferencing problems may appear between detected rectangles, as the yellow and the dark ones at the forefront.
that presented in Monnier et al. (2012). Conversely, facades too highly occluded by trees or with a direction too orthogonal to the trajectory have too few points to be correctly detected.
We encountered no example of over-segmentation in our test area: all the segments corresponding to the same facade were always merged. Concerning under-segmentation, it is natural in the case of urban scenes as adjacent facades often share the same plane, so they cannot be distinguished based on our method. To separate coplanar facades, other merging criteria should be used such as the discontinuities in facade heights (Hernandez and Marcotegui, 2009b), exploiting the alignments of fine features such as win-dows (Burochin et al., 2010) or analyzing accumulations of the vertical image gradient (Hern´andez and Marcotegui, 2009a).
4 CONCLUSIONS AND FUTURE WORK
We have presented a streamed vertical rectangle detection algo-rithm which automates facade database production from terres-trial laser scans. This algorithm overcomes the volume of data and georeferencing problems, and provides an initial analysis of urban scenes. A modified RANSAC is performed on overlap-ping buffers of 3D points acquired during the same time interval. Facade parts are thus extracted from the datasets in linear time (in number of 3D points) and constant memory complexity. Fa-cade parts are then merged and the most relevant faFa-cade planes are kept. The construction of the merge graph is quadratic in the number of segments, but this number is negligible compared to the number of points.
In future work, vehicle drift could be detected thanks to shifted rectangles that correspond to the same facade, then, rectangle matching could enable registration refinement, indeed, vertical
Boulaassal, H., 2010. Segmentation et Mod´elisation G´eom´etriques de Fac¸ades de Bˆatiments `a Partir de Relev´es Laser Terrestres. PhD thesis, Universit´e de Strasbourg.
Burochin, J.-P., Vallet, B., Tournaire, O. and Paparoditis, N., 2010. A formulation for unsupervised hierarchical segmen-tation of facade images with periodic models. Vol. 38 (Part 3 A), pp. 227–232.
Demantk´e, J., Mallet, C., David, N. and Vallet, B., 2010. Di-mensionality based scale selection in 3d lidar point cloud. The International Archives of the Photogrammetry, Remote Sens-ing and Spatial Information Sciences.
Friedman, S. and Stamos, I., 2011. Real time detection of re-peated structures in point clouds of urban scenes. In: 3DIM-PVT ’11, IEEE.
Frueh, C., Siddharth, J. and Zakhor, A., 2005. Data processing algorithms for generating textured 3d building facade meshes from laser scans and camera images. Int. J. Comput. Vision 61, pp. 159–184.
Hammoudi, K., Dornaika, F. and Paparoditis, N., 2009. Extract-ing buildExtract-ing footprints from 3d point clouds usExtract-ing a terres-trial laser scanning at street level. In: International Archives of Photogrammetry, Remote Sensing and Spatial Information Sciences, Vol. 38 (Part 3/W4), p. 6570.
Hammoudi, K., Dornaika, F. and Paparoditis, N., 2011. Gener-ating virtual 3d model of urban street facades by fusing terres-trial multi-source data. Intelligent Environments, International Conference on Intelligent Environments 0, pp. 330–333.
Hern´andez, J. and Marcotegui, B., 2009a. Morphological seg-mentation of building fac¸ade images. In: ICIP, pp. 4029–4032.
Hernandez, J. and Marcotegui, B., 2009b. Point cloud segmenta-tion towards urban ground modeling. In: IEEE Urban Remote Sensing Event, pp. 1–5.
Howard, A., Wolf, D. and Sukhatme, G., 2004. Towards 3d map-ping in large urban environments. In: Intelligent Robots and Systems, 2004.(IROS 2004). Proceedings. 2004 IEEE/RSJ In-ternational Conference on, Vol. 1, IEEE, pp. 419–424.
Monnier, F., Vallet, B. and Soheilian, B., 2012. Trees detection from laser point clouds acquierd in dense urban areas by a mo-bile mapping system. Vol. 38 (Part 3 A), p. to appear.
Poullis, C. and You, S., 2009. Automatic reconstruction of cities from remote sensor data. In: CVPR, pp. 2775–2782.
Rutzinger, M., Elberink, S. O., Pu, S. and Vosselman, G., 2009. Automatic extraction of vertical walls from mobile and air-borne laser scanning data. GeoInformation Science.
Yang, Y., M. and Forstner, W., 2010. Plane detection in point cloud data. Technical report.
Zheng, Q., Sharf, A., Wan, G., Li, Y., Mitra, N., Cohen-Or, D. and Chen, B., 2010. Non-local scan consolidation for 3d urban scenes. ACM Transactions on Graphics 29, pp. Article 94.