This art icle was dow nloaded by: [ Universit as Dian Nuswant oro] , [ Ririh Dian Prat iw i SE Msi] On: 29 Sept em ber 2013, At : 20: 53
Publisher: Rout ledge
I nform a Lt d Regist ered in England and Wales Regist ered Num ber: 1072954 Regist ered office: Mort im er House, 37- 41 Mort im er St reet , London W1T 3JH, UK
Accounting and Business Research
Publicat ion det ails, including inst ruct ions f or aut hors and subscript ion inf ormat ion: ht t p: / / www. t andf online. com/ loi/ rabr20
Intellectual capital disclosure and corporate
governance structure in UK firms
Jing Li a , Richard Pike b & Roszaini Hanif f a a a
Universit y of Bradf ord b
School of Management , Universit y of Bradf ord, Emm Lane, Bradf ord, UK, BD9 4JL E-mail: Published online: 04 Jan 2011.
To cite this article: Jing Li , Richard Pike & Roszaini Hanif f a (2008) Int ellect ual capit al disclosure and corporat e governance st ruct ure in UK f irms, Account ing and Business Research, 38: 2, 137-159, DOI: 10. 1080/ 00014788. 2008. 9663326
To link to this article: ht t p: / / dx. doi. org/ 10. 1080/ 00014788. 2008. 9663326
PLEASE SCROLL DOWN FOR ARTI CLE
Taylor & Francis m akes every effort t o ensure t he accuracy of all t he inform at ion ( t he “ Cont ent ” ) cont ained in t he publicat ions on our plat form . How ever, Taylor & Francis, our agent s, and our licensors m ake no
represent at ions or warrant ies w hat soever as t o t he accuracy, com plet eness, or suit abilit y for any purpose of t he Cont ent . Any opinions and view s expressed in t his publicat ion are t he opinions and view s of t he aut hors, and are not t he view s of or endorsed by Taylor & Francis. The accuracy of t he Cont ent should not be relied upon and should be independent ly verified w it h prim ary sources of inform at ion. Taylor and Francis shall not be liable for any losses, act ions, claim s, proceedings, dem ands, cost s, expenses, dam ages, and ot her liabilit ies w hat soever or how soever caused arising direct ly or indirect ly in connect ion w it h, in relat ion t o or arising out of t he use of t he Cont ent .
This art icle m ay be used for research, t eaching, and privat e st udy purposes. Any subst ant ial or syst em at ic reproduct ion, redist ribut ion, reselling, loan, sub- licensing, syst em at ic supply, or dist ribut ion in any
1. Introduction
The purpose of this paper is to investigate the in-fluence of corporate governance on intellectual capital disclosure in corporate annual reports, con-trolling for other firm characteristics. Intellectual capital is increasingly recognised as having much greater significance in creating and maintaining competitive advantage and shareholder value (Tayles et al., 2007). Definitions of intellectual capital vary (for example, Stewart, 1997; Mouritsen, 1998). One of the most comprehensive definitions of intellectual capital is offered by CIMA (2001): ‘… the possession of knowledge and experience, professional knowledge and skill, good relation-ships, and technological capacities, which when applied will give organisations competitive advan-tage.’ Sveiby (1997) suggests that the concept of intellectual capital can be categorised into human, structural and organisational capital, while Guthrie and Petty (2000) offer an alternative categorisa-tion: internal structure, external structure and human capital. The various forms of intellectual capital disclosure are valuable information for in-vestors as they help reduce uncertainty about fu-ture prospects and facilitate a more precise valuation of the company (Bukh, 2003). However, financial reports fail to reflect such a wide range of value-creating intangible assets (Lev and Zarowin, 1999), giving rise to increasing information asym-metry between firms and users (Barth et al., 2001),
and creating inefficiencies in the resource alloca-tion process within capital markets.
A number of research reports (e.g. FASB, 2001; ASB, 2007) and academic studies (e.g. Lev, 2001; Mouritsen et al., 2001) have called for greater dis-closure of non-financial indicators of investment in intangible assets. Cañibano et al. (2000) argue that the cost associated with a radical change in the ac-counting system to make it more value relevant for intellectual capital intensive firms is unaffordable and that the sensible approach towards the en-hancement of financial reports is to encourage vol-untary disclosure of intellectual capital information. Keenan and Aggestam (2001) argue that respon-sibility for the prudent investment of intellectual capital resides with corporate governance, and that, depending on the firm’s characteristics and orientation, the governance of publicly-owned firms may need to develop new structures and processes in annual reports for communicating in-formation about the value created for stakeholders through the firm’s intellectual capital. However, as discussed in a later section, the empirical evidence from prior studies is limited, with small sample sizes prohibiting more rigorous statistical analysis and external validity. For example, we know very little about the main determinants of the variation in levels of intellectual capital disclosure in annu-al reports across firms, including the effects of good governance mechanisms.
This paper examines the influence of corporate governance factors on intellectual capital disclo-sure, and the subcategories comprising it, using various disclosure measures. We hypothesise that significant relationships exist between intellectual capital disclosure in annual reports and board com-position, role duality, ownership concentration, audit committee size and frequency of audit
com-Accounting and Business Research,Vol. 38. No. 2. pp. 137-159. 2008 137
Intellectual capital disclosure and corporate
governance structure in UK firms
Jing Li, Richard Pike and Roszaini Haniffa*
Abstract—This paper investigates the relationship between intellectual capital disclosure and corporate governance variables, controlling for other firm-specific characteristics, for a sample of 100 UK listed firms. Intellectual capi-tal disclosure is measured by a disclosure index score, supported by word count and percentage of word count met-rics to assess the variety, volume and focus of intellectual capital disclosure respectively. The independent variables comprise various forms of corporate governance structure: board composition, ownership structure, audit commit-tee size and frequency of audit commitcommit-tee meetings, and CEO role duality. Results of the analysis based on the three measures of intellectual capital disclosure indicate significant association with all the governance factors except for role duality. The influence of corporate governance mechanisms on human, structural and relational capital disclo-sure, based on all three metrics, is also explored.
Keywords: intellectual capital disclosure; corporate governance; content analysis; annual report
*The authors are at the University of Bradford. They wish to thank Musa Mangena, the anonymous reviewers and the editor for their helpful comments.
Correspondence should be addressed to: Professor Richard Pike, University of Bradford, School of Management, Emm Lane, Bradford, UK, BD9 4JL. E-mail: [email protected]
This paper was accepted for publication in March 2008.
mittee meetings, controlling for listing age, firm size and profitability. Using content analysis and regressing the three forms of intellectual capital disclosure measures on the explanatory variables, we find support for all hypotheses with the excep-tion of role duality.
The remainder of this paper is organised as fol-lows: the next section reviews the empirical litera-ture on intellectual capital disclosure. The hypothesis development is outlined in Section 3, followed by the research design in Section 4. Section 5 presents findings on intellectual capital disclosure practices from multiple regression analyses, and examines the working hypotheses. Finally, Section 6 discusses the findings, implica-tions and limitaimplica-tions of the study.
2. Literature on intellectual capital
disclosure studies
Information on intellectual capital is important to stakeholders in their decision-making. Within an agency context, Jensen and Meckling (1976) argue that greater disclosure reduces the uncertainty facing investors and thus reduces a firm’s cost of capital. Managers should therefore be willing to dis-close intellectual capital information in order to en-hance the firm’s value by providing investors with a better assessment of the financial position of the firm and help reduce the volatility of stock returns. Barth et al. (2001) observe that analyst coverage is greater for firms investing more heavily in research and development and advertising, while empirical studies suggest a positive share price impact arises from specific intellectual capital indicators such as research and development (R&D) expenditure (Amir and Lev, 1996), capitalisation of software de-velopment expenditure (Aboody and Lev, 1998), and customer satisfaction (Ittner and Larker, 1998). Gibbins et al. (1990) explore the voluntary dis-closure process giving rise to disdis-closure outputs in response to internal and external stimuli. They argue that a company’s readiness to disclose is a function of its general disclosure position (for ex-ample, an uncritical adherence to information dis-closure norms or to use disdis-closure as opportunity to gain advantage or boost stock price), antecedents (for example, corporate history, corporate strategy, and market factors), structure, and the use of con-sultants and advisors. While corporate governance mechanisms are not specifically identified, they have relevance to all these independent variables, particularly to structure, where governance in-volves the establishing of clear policies.
Abeysekera (2006) observes that the develop-ment of a theoretical framework underlying intel-lectual capital disclosure is in its infancy, with few studies providing a strong theoretical basis for in-terpreting their findings. However, the literature offers a few theoretical perspectives that may help
explain the variation of intellectual capital disclo-sure. These include arguments based on legitima-cy and stakeholders (Abeysekera and Guthrie, 2005), signalling (García-Meca and Martínez, 2005), media agenda setting (Sujan and Abeysekera, 2007), agency (Patelli and Prencipe, 2007), and information asymmetry (Amir and Lev, 1996).
In a review of the current state of financial and external reporting research, Parker (2007) identi-fied intellectual capital accounting as a major area for further research. Most intellectual capital dis-closure studies are cross-sectional and country specific. Examples include studies in Australia (e.g. Guthrie and Petty, 2000; Sujan and Abeysekera, 2007), Ireland (Brennan, 2001), Italy (e.g. Bozzolan et al., 2003), Malaysia (Goh and Lim, 2004), UK (e.g. Williams, 2001), and Canada (Bontis, 2003). Relatively few longitudinal studies have been reported (e.g. Abeysekera and Guthrie, 2005). Some studies focus on specific aspects of intellectual capital disclosure, such as human cap-ital reporting (e.g. Subbarao and Zeghal, 1997), while others conduct international comparative studies (e.g. Vergauwen and van Alem, 2005; Cerbioni and Parbonetti, 2007). Some intellectual capital disclosure studies have looked beyond an-nual reports to examine other communication channels such as analyst presentations (García-Meca et al., 2005).
Most intellectual capital disclosure studies em-ploy content analysis as the research method, but some use questionnaire surveys (e.g. Bontis, 1998). Guthrie and Petty’s (2000) analysis of in-tellectual capital reporting practices suggests that disclosure has been expressed in discursive rather than numerical terms and that little attempt has been made to translate the rhetoric into measures that enable performance of various forms of intel-lectual capital to be evaluated.
Studies have also been conducted to explore in-tellectual capital related issues from the firm’s per-spective. Chaminade and Roberts (2003) investigate the implementation of intellectual cap-ital reporting systems in Norway and Spain. Habersam and Piper (2003) employ case studies to explore the relevance and awareness of intellectu-al capitintellectu-al in hospitintellectu-als. Studies that looked at possi-ble determinants of voluntary intellectual capital disclosure include García-Meca et al. (2005) and Cerbioni and Parbonetti (2007). Based on analyst presentation reports of listed Spanish companies, García-Meca et al. (2005) found significant asso-ciation between intellectual capital disclosure and size and type of disclosure meeting but not owner-ship diffusion, international listing status, industry type and profitability. Based on analysis of European Biotechnology companies over a period of three years, Cerbioni and Parbonetti (2007)
found governance related variables to strongly in-fluence voluntary intellectual capital disclosure.
In the UK, there has been a limited number of in-tellectual capital disclosure studies compared to its European counterparts. Williams (2001) conduct-ed a cross-sectional study of 31 companies while Beattie et al. (2002) undertook a study of 11 com-panies in the food sector. The small sample sizes restrict generalisation and meaningful interpreta-tion of intellectual capital disclosure. Roslender and Fincham (2004) explore intellectual capital awareness among UK firms, and the reasons and motives underlying such interest.
The foregoing discussion suggests that the liter-ature on the determinants of intellectual capital disclosure is limited and inconclusive. Our study builds on the previous literature of intellectual cap-ital disclosure practice within a UK context and examines its relationship with corporate gover-nance structures, listing age, profitability and size.
3. Determinants of intellectual capital
disclosure and development of hypotheses
Corporate governance mechanismsCorporate governance is a framework of legal, institutional, and cultural factors shaping the pat-terns of influence that stakeholders exert on mana-gerial decision-making (Weimer and Pape, 1999). The justification for considering corporate gover-nance is that the board of directors manages infor-mation disclosure in annual reports and therefore constituents of boards may be important. Holland (2006a: 147) found that boards of directors are at the heart of corporate financial communications, having active roles in the disclosure process relat-ed to: (1) the provision of primary information re-garding the corporate value-creation process, and their contribution towards it; (2) the provision of information about themselves in terms of their skills in managing the business; (3) the manner in which they are organised to conduct financial communications; (4) their reputation for disclo-sure honesty; and (5) information about how their own pay and wealth is tied to company fortunes.
Agency theory provides a framework for linking voluntary disclosure behaviour to corporate gover-nance, whereby control mechanisms are designed to reduce the agency problem arising from the sep-aration between ownership and management (Welker, 1995). This argument can be extended to intellectual capital disclosure, whereby manage-ment can determine the level of disclosure and thereby reduce investor uncertainty relating to the impact of intellectual capital on the firm’s value. High intellectual capital disclosure is therefore ex-pected to provide a more intensive monitoring package for a firm to reduce opportunistic behav-iour and information asymmetry.
Adoption of internal control devices, such as audit committees and non-executive directors, and separation of the roles of chairman and chief exec-utive, may enhance monitoring quality in critical decisions about intellectual capital investment and performance (Keenan and Aggestam, 2001). This is likely to reduce the scope for managerial oppor-tunism and reduce benefits from withholding in-formation, and, as a consequence, intellectual capital disclosure in annual reports should be improved.
Board composition – proportion of independent non-executive directors (INED)
The board of directors is an internal control mechanism intended to take decisions on behalf of the shareholders and to ensure that management behaviour is consistent with owners’ interests. Based on resource dependence theory, Haniffa and Cooke (2005) argue for more non-executive direc-tors on the board as they can provide wider ex-pertise, prestige and contacts, and play a key role in influencing disclosure. Extending this argu-ment, and that of Gibbins et al. (1990), to intellec-tual capital, we suggest that the wider expertise and experience of non-executive directors on the board will encourage management to take a dis-closure position beyond a ritualistic, uncritical ad-herence to prescribed norms, to a more proactive position reflecting the value relevance of intellec-tual capital to stakeholders.
Findings from prior voluntary disclosure studies that considered board composition as a possible determinant of voluntary disclosure are mixed; some find that the proportion of non-executive di-rectors is positively related with the board’s abili-ty to influence voluntary disclosure decisions (e.g. Beasley, 1996; Chen and Jaggi, 2000), others find no relationship (Ho and Wong, 2001; Brammer and Pavelin, 2006), and yet others observe a nega-tive relationship (Eng and Mak, 2003; Haniffa and Cooke, 2005). One reason may be that non-execu-tive directors are not necessarily independent. Independent non-executive directors are typically individuals with relevant expertise and profession-al reputations to defend, with no management role or links with the company.1 Cotter and Silvester
Vol. 38 No. 2. 2008 139
1The revised Combined Code (2006) recommends that at
least half of the board, excluding the chairman, should com-prise non-executive directors determined by the board to be independent as defined by criteria in the Code, in order that non-executive directors are able to discharge their responsibil-ities in an objective manner, without interference, bias or favouritism. For example, a director should not have been an employee of the group within the last five years, had a mate-rial business relationship with the company within the last three years, received additional remuneration from the compa-ny apart from a director’s fee, participate in the compacompa-ny’s share option or a performance-related pay scheme, close fam-ily ties with any of the company’s advisers, directors or senior employees, hold cross-directorships or significant links with directors, or served on the board for more than nine years.
(2003) argue that independent non-executive di-rectors are in a better position to monitor executive management. In one of the few studies capturing independent non-executive directors, Patelli and Prencipe (2007) found a positive correlation with the amount of voluntary information disclosed by companies in their annual reports. We also capture independent non-executive directors (INED) and argue that:
H1: There is a positive relationship between the level of intellectual capital disclosure and the proportion of independent non-executive directors to the total number of directors on the board, ceteris paribus.
Role duality (RDUAL)
Another way to examine independence of the board is to consider role duality, a board leadership structure in which the same person undertakes both the roles of chief executive and chairman.2
There is widespread acknowledgement that a dom-inant personality commanding a firm may be detri-mental to the interests of shareholders, and this phenomenon has been found to be associated with poor disclosure (Forker, 1992) and CEO entrench-ment, resulting in ineffective monitoring of mana-gerial opportunistic behaviour (Haniffa and Cooke, 2002). Concentration of decision-making power resulting from role duality could impair the board’s oversight and governance roles, including disclosure policies. Separation of the two roles provides the essential checks and balances on management behaviour (Blackburn, 1994), as rec-ommended in the revised Combined Code (2006).3
Employing similar arguments for role duality as for independent non-executives, we hypothesise that:
H2: There is a negative relationship between the level of intellectual capital disclosure and role duality, ceteris paribus.
Ownership structure – share concentration (SCON)
The power of stakeholders to influence manage-ment is a function of the resources they control that are essential to the corporation (Smith et al., 2005). Ownership structure therefore will influ-ence the level of monitoring and thereby the level of voluntary disclosure (Eng and Mak, 2003). Agency theory argues that with greater ownership diffusion, firms are more likely to experience pres-sure from shareholders for greater disclopres-sure to re-duce agency costs and information asymmetry (Raffournier, 1995). In contrast, firms with close-ly-held ownership are expected to have less infor-mation asymmetry between management and dominant shareholders who typically have access to the information they need and can provide an
active governance system that is difficult for smaller, more passive and less-informed investors (Cormier et al., 2005).4 This is particularly
rele-vant to intellectual capital disclosure because fund managers have access to such information via pri-vate communication channels (Holland, 2006b). Hence, we hypothesise that:
H3: There is a negative relationship between the level of intellectual capital disclosure and concentrated share ownership, ceteris paribus.
Audit committee size (SAC) and frequency of meetings (MAC)
Board monitoring is a function of not only the structure and composition of the board, but also of the board’s subcommittees where much of the im-portant processes and decisions are monitored and taken (Cotter and Silvester, 2003). The role of audit committees has developed over the years to meet the challenges of changing business, social and economic environments. The Smith Report (2003) in the UK identifies the role of audit com-mittees as ensuring that the interests of sharehold-ers are properly protected in relation to financial reporting and internal control. It further recom-mends audit committees to review the significant financial reporting issues and judgments made in connection with the preparation of the company’s financial statements, interim reports, preliminary announcements and related formal statements, such as the operating and financial review and the release of price-sensitive information. As such, audit committees can be expected to have a signif-icant impact on value-relevant information disclo-sure, of which intellectual capital forms a large element in many firms.
Effective audit committees should improve in-ternal control and act as a means of attenuating agency costs (Ho and Wong, 2001), and as a pow-erful monitoring device for improving value-rele-vant intellectual capital disclosure. The presence of an audit committee has been found to be associ-ated with more reliable financial reporting
2Role duality is not common among listed companies since
the majority comply with the recommended code of corporate governance.
3 However, in voluntary disclosure studies, Haniffa and
Cooke (2002) and Ho and Wong (2001) failed to find any re-lationship between the extent of voluntary disclosure and role duality.
4 Prior disclosure studies provide mixed evidence.
Cormier et al. (2005) and Brammer and Pavelin (2006) find significant negative associations between ownership concen-tration and engagement in environmental reporting practices. Patelli and Prencipe (2007) find a positive relationship be-tween share ownership diffusion and voluntary disclosure. However, Eng and Mak (2003) fail to find any significant as-sociation between blockholder ownership and voluntary dis-closure.
(McMullen, 1996), enhanced quality and in-creased disclosure (Ho and Wong, 2001). However, Mangena and Pike (2005) find no rela-tionship between audit committee size and the ex-tent of voluntary disclosure in interim reports. Inactive audit committees are unlikely to monitor management effectively and adequate meeting time should be devoted to the consideration of major issues (Olson, 1999). Price Waterhouse (1993) recommended that audit committees should hold a minimum of three or four meetings a year and special meetings when necessary.
Given the increasing importance of intellectual capital, we expect larger audit committees, meet-ing more frequently, to have greater influence in overseeing intellectual capital disclosure practice. Therefore, our next two hypotheses are as follows:
H4: There is a positive relationship between the level of intellectual capital disclosure and audit committee size, ceteris paribus.
H5: There is a positive relationship between the level of intellectual capital disclosure and frequency of audit committee meetings, ceteris paribus.
Control variables
The length of time a company has been listed on a capital market (AGE) may be relevant in ex-plaining the variation of disclosures. Younger list-ed companies without an establishlist-ed shareholder base are expected to be more reliant on external fund raising than more mature companies (Barnes and Walker, 2006) and have greater need to reduce scepticism and boost investor confidence (Haniffa and Cooke, 2002). Hence, we expect a negative re-lationship between firms’ listing age and level of intellectual capital disclosure. Profitability (ROA) may be the result of continuous investment in in-tellectual capital and firms may engage in higher disclosure of such information to signal the signif-icance of their decision in investing in it for long-term growth in the value of the firm. We therefore expect a positive relationship between profitability and level of intellectual capital disclosure. Large firms are more visible and more likely to meet in-vestors’ demand for information and we expect a positive relationship between size of company (SA) and level of intellectual capital disclosure.
4. Research method
4.1. Sampling designThis study examines intellectual capital disclo-sure in corporate annual reports of UK fully listed companies on the London Stock Exchange (LSE) for financial year-ends between March 2004 and February 2005. Firms in seven industry sectors containing high intellectual capital compa-nies (Pharmaceuticals & Biotechnology, IT,
Telecommunications, Business Services, Media & Publishing, Banking & Insurance, and Food Production & Beverage) were selected.5This
pro-vided us with a population size of 319 companies, from which a sample size of 100 was selected (31%). As the number of companies in each indus-try group is not the same, proportionate stratified sampling was applied (Moser and Kalton, 1996).
4.2. Development of the research instrument Content analysis was used to collect the neces-sary data. An essential element of content analysis is the selection and development of categories into which content units can be classified. Various au-thors (e.g. Sveiby, 1997; Meritum, 2002) suggest that intellectual capital can be grouped into three subcategories: (1) Human capital, for example, staff education, training, experience, knowledge and skills, (2) Structural capital, covering internal structures such as R&D, patents, management processes, and (3) Relational capital, covering ex-ternal relationships such as customer relations, brands and reputation. These forms of intellectual capital can be leveraged to create competitive ad-vantage and value for stakeholders. However, Beattie and Thomson (2007) observe that there is no consensus or precise definition of the con-stituents of such categories, giving rise to difficul-ties for annual report preparers and researchers seeking to quantify intellectual capital disclosure. Habersam and Piper (2003) argue for a compre-hensive representation of intellectual capital, in-cluding metric and non-metric forms, in order to better discern its different dimensions and degrees of transparency. They further suggest a fourth in-tellectual capital category, namely ‘Connectivity Capital’ linking the other three forms.
The categories and items in our research instru-ment were drawn from previous literature on intel-lectual capital definition and classification. The majority of previous intellectual capital disclosure studies have adopted or adapted Sveiby’s (1997) intellectual capital framework, which typically contains 22–25 items (Beattie and Thomson, 2007). The problem with too few coding cate-gories is that it potentially increases the likelihood of random agreement in coding decisions and sub-sequently results in an overestimation of reliabili-ty (Milne and Adler, 1999). Similarly, higher numbers of items in the instrument increase the complexity (Beattie and Thomson, 2007) and may potentially increase coding errors (i.e. reliability) (Milne and Adler, 1999). However, in order to achieve greater variation and better understanding of intellectual capital disclosure, we devised a
Vol. 38 No. 2. 2008 141
5Given the bias towards high intellectual capital industry
sectors, the sample cannot claim to represent the intellectual capital disclosure practice of all LSE listed UK firms.
more detailed checklist covering items relating to the three themes: human capital (HIC), structural capital (SIC) and relational capital (RIC), captur-ing information in the forms of text, numerical and graphical/pictorial. While Guthrie and Petty (2000) highlight the difficulty in seeking to quan-tify the qualitative aspects of intellectual capital, evidence from Habersam and Piper (2003) ques-tions this view. All items in the designed research instrument were considered equally applicable and therefore equally capable of disclosure across all sample firms in all three formats.
The initial draft of the research instrument with 150 items was pilot tested by one researcher, using a sample of annual reports (not included in the final sample). Based on feedback from the pilot test and discussion with two other researchers, the instrument was further modified to ensure that it captured the necessary and desired information for which it was designed. The research instrument was reduced to 61 intellectual capital items in three forms. The operational definitions and cod-ing rules (see Appendix) were defined by one re-searcher and checked and agreed by the other two researchers.
Measurement of dependent variables
Beattie and Thomson (2007) argue that many of the content analysis research methods adopted in prior studies for intellectual capital disclosure measurement lack transparency, specificity, uni-formity and rigour, and that these deficiencies may give rise to misleading evidence. In this study, scoring of the research instrument was performed manually covering the whole annual report.6
The dependent variable, intellectual capital dis-closure, is measured using three different metrics: disclosure index (ICDI) to indicate the variety; word count (ICWC) to represent the volume; and word count as a percentage of annual report total word count (ICWC%) to indicate focus in the an-nual report. Our approach in scoring the items in the research instrument for the purpose of the dis-closure index is essentially dichotomous in that an item scores one if disclosed and zero, if it is not.7
The intellectual capital disclosure index ICDIjfor each company is calculated based on the disclo-sure index score formula used in Haniffa and Cooke (2005) as follows:
where nj= number of items for jthfirm, n j = 183 (i.e. 61 items in three formats), Xij = 1 if ith item disclosed, 0 if ith item not disclosed, so that 0 ≤ ICDIj≤ 1.
The use of a dichotomous procedure in scoring the instrument for the disclosure index can be
crit-icised because it treats disclosure of one item (re-gardless of its form or content) as being equal, and does not indicate how much emphasis is given to a particular content category. To capture the volume of intellectual capital content and to partly over-come the problem of using an index score, this study introduces another form of measure, namely intellectual capital word count (ICWC). Words are the smallest unit of measurement for analysis and can be expected to provide the maximum robust-ness to the study in assessing the quantity of dis-closure (Zeghal and Ahmed, 1990). Using the same research instrument, and taking ‘phrases’, or what Beattie and Thomson (2007) term ‘pieces of information’ as the basis of coding, the number of words relating to each intellectual capital item in the checklist was counted and added together to ar-rive at ICWC for each company. Graphical and pictorial messages were excluded from the word count measure.8
Coding under ‘phrases’ and word count avoids the problem of coding sentences in terms of deci-sions over dominant themes, and the ‘phrases’ re-main meaningful in their own right, while enabling the measuring of the amount of information pro-vided. Coding annual reports into ‘phrases’ is a three-stage process involving: (1) selection of sen-tences containing intellectual capital information; (2) splitting such sentences into ‘phrases’ and se-lecting only those relating to intellectual capital; and (3) coding ‘phrases’ under each relevant item(s) in the research instrument. Where a
6Three coders independently coded the same four annual
reports and Krippendorff’s (1980) alpha was used to test for reliability as it can account for chance agreement among mul-tiple coders. The independent scores were all above the mini-mum 80% threshold for content analysis to be considered reliable (Riffe et al., 2005) and this was achieved after a sec-ond round of independently coding another four annual re-ports. Only one researcher completed the coding for the remaining 92 annual reports. To aid consistency of scoring, the research instrument was completed by one researcher, and to increase reliability of measurement, rescoring was done on a random selection of 10 firms three months after initial analy-sis, which confirmed over 90% consistent identification of content in the annual reports.
7 Many prior intellectual capital disclosure studies have
adopted the dichotomous (0:1) coding scheme in measuring intellectual capital disclosure, which is mainly for examining the presence/absence of intellectual capital items (e.g. Guthrie and Petty, 2000; Brennan, 2001). Some intellectual capital dis-closure studies used weighted coding schemes, which give uneven scores for quantitative and qualitative information (e.g. Bozzolan, et al., 2003; Sujan and Abeysekera, 2007). Consistent with Cooke (1989), items were not weighted be-cause of potential scoring bias and scaling problems.
8Beattie and Thomson (2007) identify the problems with
word count (such as print size, colour, font variations and dis-closures in graphs/pictures format), and propose a measure ad-dressing the differentiation in length and number of sentences used in expressing similar meanings encountered by coding sentences.
‘phrase’ relates to more than one item in the check-list and cannot be split, it is then coded under all the related items and the word count is evenly dis-tributed across all the items coded. An example is shown as follows,
‘The trust and confidence of all our stakeholders, together with our reputation, are among our most valuable assets.’ (AstraZeneca plc 2004 Annual report).
The sentence was split into three ‘phrases’: (1) The trust and confidence of all our stakeholders, (2) together with our reputation, (3) are among our most valuable asset. Phrase 1 was coded under ‘re-lationship with stakeholders’, phrase 2 was coded under ‘company reputation’ and phrase 3 was equally distributed between the two items.
Krippendorff (1980) further notes that words are a preferred measure when it is intended to measure the amount of total space devoted to a topic and to ascertain the importance of that topic. Although word count is not assumed to be representative of the quality of disclosure, it is assumed to be in-dicative of the overall responsiveness by corporate management.9The greater the number of words
re-lated to intellectual capital being disclosed in rela-tion to the total number of words in the annual reports, the greater the emphasis given by man-agement on intellectual capital information. Hence, we introduced a third measure, ICWC%, which is the proportion of intellectual capital word count to the total word count of the whole annual report. This measure captures the intellectual cap-ital focus in the annual report. For example, a firm with a short annual report may have a low ICDI and ICWC but a high ICWC%, conveying to the reader the importance placed by management on intellectual capital information.
Measurement of independent variables
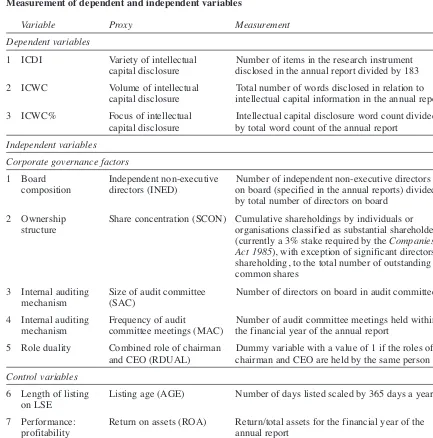
The independent variables are categorised into two groups: corporate governance and control variables. Data are drawn from corporate annual reports and Thomson Research. Table 1 summaris-es the operationalisation of both independent and dependent variables.
4.3. Data analysis
Multiple regression is used to test the relation-ship between intellectual capital disclosure (based on each of the three measures) and the various cor-porate governance and control variables. To iden-tify potential multicollinearity problems, the correlations between independent variables were reviewed and the variance inflation factors (VIF) computed. In addition, tests were conducted for normality, based on skewness and kurtosis and Kolmogorov-Smirnov Lilliefors (for goodness of fit), for all dependent and continuous independent
variables and when normality was a problem, the data was transformed.10An analysis of residuals,
plots of the studentised residuals against predicted values as well as the Q-Q plot were conducted to test for homoscedasticity, linearity and normality assumptions. The regression equation is as follows:
ICD = β0 + β1INEDi+ β2RDUALi + β3SqSCONi+ β4SACi + β5MACi+ β6LnAGEi + β7ROAi+ β8LnSAi+ εi Where,
ICD = Intellectual capital disclosure index (ICDI), log of intellectual capital word count (LnICWC), or intellectu-al capitintellectu-al word count percentage (ICWC%);
INED = Proportion of independent non-exec-utive directors on board (proxy for board composition, %);
RDUAL = 1 if the roles of chairman and CEO are held by the same person; 0 if oth-erwise;
SqSCON = Square root of cumulative sharehold-ing by significant shareholders (i.e. shareholders holding more than 3% of total shares outstanding to total shares outstanding, %);
SAC = Audit committee size (total number of directors on the audit committee) (proxy for internal auditing function); MAC = Frequency of audit committee meet-ings (total number of audit committee meetings held within the year to its fi-nancial year end) (proxy for internal auditing function);
AGE = Log of length of listing on LSE (list-ing age);
ROA = Return on assets (proxy for firm per-formance: profitability);
LnSA = Log of sales (proxy for firm size);
β = parameters;
εi = error term; and
i = the ith observation.
Vol. 38 No. 2. 2008 143
9This assumption is based on the belief that management
has editorial control of content when a large number of de-mands for inclusion of information are likely to exist. Annual reports are time-consuming and costly to produce, and man-agement must rationalise the competing demands for space. As a result space must be allocated on the basis of some per-ception of the importance of information to report users.
10The standard tests for skewness and kurtosis revealed that
share concentration, listing age and firm size were not nor-mally distributed. Appropriate transformations were conduct-ed to ensure data normality. Listing age and firm size were transformed using logarithmic transformation, whereas square root transformation was more effective for share concentra-tion.
Table 2 presents the correlation and partial cor-relation matrices (controlling for log of sales, a proxy for size).11
It can be seen from both panel A and B of Table 2 that all variables showed significance for at least one intellectual capital disclosure measure. Table 2, Panel A reveals that, with the exception of log of firm size, independent variable associations are all below 0.30. The VIFs for each independent vari-able (shown in Tvari-able 6) are all less than 2, sug-gesting that multicollinearity is not a problem.12
Panel B of Table 2 reveals no multicollinearity among explanatory variables after controlling for size. It can also be seen from Panel B of Table 2 that board composition (INED) shows significant association with all measures of intellectual capital disclosure. Size of audit committee (SAC),
fre-quency of audit committee meetings (MAC), and share concentration (SqSCON), show highly sig-nificant (1% and 5% levels) association with ICDI and log of ICWC, but not with ICWC%. Return on assets (ROA) and log of listing age (LnAGE) show significant correlation with ICDI and ICWC% re-spectively, at the 5% level.
Table 1
Measurement of dependent and independent variables
Variable Proxy Measurement Dependent variables
1 ICDI Variety of intellectual Number of items in the research instrument
capital disclosure disclosed in the annual report divided by 183
2 ICWC Volume of intellectual Total number of words disclosed in relation to
capital disclosure intellectual capital information in the annual report
3 ICWC% Focus of intellectual Intellectual capital disclosure word count divided
capital disclosure by total word count of the annual report
Independent variables Corporate governance factors
1 Board Independent non-executive Number of independent non-executive directors
composition directors (INED) on board (specified in the annual reports) divided
by total number of directors on board
2 Ownership Share concentration (SCON) Cumulative shareholdings by individuals or
structure organisations classified as substantial shareholders
(currently a 3% stake required by the Companies Act 1985), with exception of significant directors’ shareholding, to the total number of outstanding common shares
3 Internal auditing Size of audit committee Number of directors on board in audit committee
mechanism (SAC)
4 Internal auditing Frequency of audit Number of audit committee meetings held within
mechanism committee meetings (MAC) the financial year of the annual report
5 Role duality Combined role of chairman Dummy variable with a value of 1 if the roles of
and CEO (RDUAL) chairman and CEO are held by the same person
Control variables
6 Length of listing Listing age (AGE) Number of days listed scaled by 365 days a year
on LSE
7 Performance: Return on assets (ROA) Return/total assets for the financial year of the
profitability annual report
8 Firm size Sales (SA) Sales revenue of financial year
11Due to the significant effect of size on disclosure, the
par-tial correlation (controlling for size) was considered to be more appropriate for identifying the marginal effects of other factors that were significantly correlated to level of intellectu-al capitintellectu-al disclosure.
12Previous authors suggest multicollinearity becomes a
se-rious problem where correlations exceed 0.8 or VIFs exceed 10 (Haniffa and Cooke, 2005). Further, the condition indexes, using eigenvalues of the independent variables correlation ma-trix, were also acceptable with all being below 20.
V
ol
. 38 N
o. 2. 2008
145
Table 2
Correlation and partial correlation (controlling for size effect – sales as a proxy) matrices
Panel A Correlation between dependent and independent variables
ICDI LnICWC ICWC% INED SAC MAC SqSCON LnAGE ROA LnSA
ICDI 1.000
LnICWC 0.856*** 1.000
ICWC% 0.500*** 0.565*** 1.000
INED 0.340*** 0.411*** 0.24** 1.000
SAC 0.511*** 0.585*** 0.175* 0.234** 1.000
MAC 0.498*** 0.528*** 0.151 0.185* 0.283*** 1.000
SqSCON –0.442*** –0.443*** –0.22** –0.173* –0.167* –0.179* 1.000
LnAGE 0.119 0.163 –0.164 0.121 0.265*** 0.137 –0.118 1.000
ROA 0.205** 0.146 0.101 –0.023 0.089 0.071 –0.134 0.216** 1.000
LnSA 0.704*** 0.693*** 0.104 0.206** 0.485*** 0.510*** –0.399*** 0.287*** 0.082 1.000
Panel B Partial correlation between dependent and independent variables controlling for size effect
ICDI 1.000
LnICWC 0.719*** 1.000
ICWC% 0.603*** 0.688*** 1.000
INED 0.281*** 0.380*** 0.225** 1.000
SAC 0.273*** 0.394*** 0.143 0.157 1.000
MAC 0.228** 0.281*** 0.114 0.095 0.047 1.000
SqSCON –0.248** –0.253** –0.196* –0.101 0.033 0.031 1.000
LnAGE –0.122 –0.052 –0.204** 0.066 0.15 –0.012 –0.004 1.000
ROA 0.208** 0.123 0.093 –0.041 0.056 0.034 –0.111 0.201** 1.000
*** = significant at .01 level, ** = significant at .05 level, * = significant at .10 level
5. Results
5.1. Descriptive analysis of intellectual capital disclosure
Table 3 presents the results of the descriptive analysis of intellectual capital disclosure by each of the 61 items in the checklist under three cate-gories in various formats. The most frequently dis-closed human capital items in text form are number of employees, employee motivation, work-related competence, and other employee fea-tures. Other commonly disclosed human capital items include employee relationship, entrepreneur-ial spirit, development and training, work-related knowledge, employee age, equality, relation, skills, and commitment. Human capital items least disclosed are vocational qualifications, employee productivity and flexibility. In all three formats, the most disclosed structural capital items are busi-ness process, technology, R&D, management phi-losophy, overall infrastructure and distribution network. The strategic importance of customer and supply chain relationships in intellectual capital disclosure is evidenced by the most disclosed items being customers, relationship with suppliers and stakeholders, market presence, customer rela-tionships and market leadership, with over 90% of sampled firms having disclosures of such items.
5.2. Descriptive statistics
Descriptive statistics of each measure of intel-lectual capital disclosure, at both overall and sub-category levels, and the independent variables for the sample companies are shown in Table 4.
The mean index (ICDI) is 0.36 with slight varia-tion in the variety of human, structural and rela-tional capital disclosure, and the mean aggregate word count (ICWC) is 10,488 words, accounting for 26.3% of the overall annual report word count (ICWC%). ICDI ranges from 0.16 to 0.56; ICWC ranges from 1,234 to 51,430 words and ICWC% ranges from 8.9% to 42.6%.13
The rankings of means for human, structural and relational capital disclosure change according to the disclosure measure employed. Structural capi-tal ranks highest (37%) for the disclosure index score, relational capital ranks highest in terms of word count, while structural capital and relational capital are joint highest for focus, each forming 9% of the total annual report word count. In all cases, human capital is in third place, although not far behind the other two. The relational-structural-human ranking for word count (38%, 34% and 28% of total intellectual capital respectively) is consistent with findings from prior intellectual capital disclosure studies (e.g. Guthrie and Petty,
2000; Bozzolan et al., 2003; Goh and Lim, 2004; Vandemaele et al., 2005), demonstrating systemat-ic differences in the level of reporting on intellec-tual capital elements. If firms focus on the disclosure of those intellectual capital elements that are most value and stakeholder relevant (Vergauwen et al., 2007), relational capital would seem to be most important in this regard.
The means of corporate governance variables for sample firms indicate that less than half of the board in our sample consists of independent non-executive directors (INED). The mean for the cu-mulative significant shareholdings (excluding significant directors’ shareholding) is 30%. The majority (86%) have three or more directors in the audit committee, suggesting compliance with rec-ommended best practice. In addition, the median for the audit committee meeting frequency is four times per year, with 83% of sample companies meeting three or more times during the financial year, in line with the Price Waterhouse (1993) rec-ommendation.
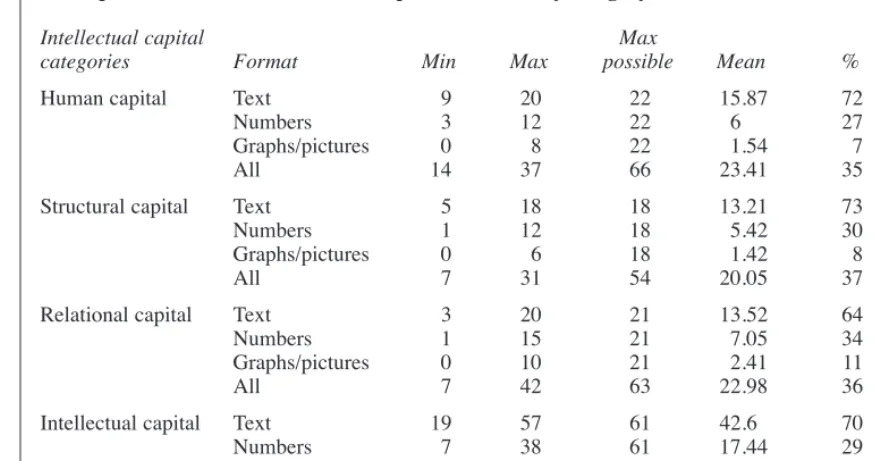
The results for intellectual capital disclosure by the three formats (text, number, graph/picture) are shown in Table 5. It can be seen that human, struc-tural and relational capitals are disclosed in all three forms in the sample annual reports. Only for structural capital in text form do we observe all possible items disclosed. On average, 43 (70%) of the 61 intellectual capital items in the research in-strument have text disclosures. This falls to 29% disclosure in numerical form, and 8% in graph/ picture form, although one firm had one-third of its intellectual capital disclosure in graph/picture form.
Our results confirm that intellectual capital dis-closures are still mainly in text form, in line with previous studies (e.g. Guthrie and Petty, 2000; Brennan, 2001). The extensive use of numerical information in intellectual capital disclosure iden-tified in the study is encouraging, supporting the finding of Sujan and Abeysekera (2007).
5.3. Regression results
Table 6 summarises the multiple regression re-sults for all three intellectual capital disclosure measures.
The first panel reports the multiple regression re-sults for the ICDI model, producing an adjusted R2
of 62%. With the exception of role duality (RDUAL), all corporate governance factors exam-ined are significant: size of audit committee (SAC) at the 1% level, and board composition (INED), frequency of audit committee meetings (MAC) and square root of share concentration (SqSCON) at the 5% level. Firm size (LnSA) is significant at the 1% level. Results also show positive relation-ship between ROA and ICDI, while log of listing age (LnAGE) is negatively associated, both
signif-13 Given that previous studies have adopted different
re-search instruments, it is not possible to make meaningful com-parison.
V
ol
. 38 N
o. 2. 2008
147
Table 3
Number of companies disclosing items in the checklist under three formats14
Av. Av. Av.
Human capital T N GP WC Relational capital T N GP WC Structural capital T N GP WC
Number of employees 100 99 9 101 Customers 99 82 48 965 Intellectual property 58 38 5 215
Employee age 67 95 0 19 Market presence 92 71 26 382 Process 100 78 21 605
Employee diversity 44 13 3 18 Customer relationships 90 47 15 295 Management philosophy 100 21 14 422
Employee equality 92 1 0 79 Customer acquisition 78 42 6 116 Corporate culture 58 1 2 32
Employee relationship 99 45 6 307 Customer retention 65 25 4 45 Organisation flexibility 40 0 0 17
Employee education 51 0 0 15 Customer training & education 17 1 1 9 Organisation structure 89 43 9 455
Skills/know-how 92 14 5 114 Customer involvement 18 2 1 7 Organisation learning 33 0 0 26
Employee work-related 100 53 0 417 Company image/reputation 65 6 12 46 Research & development 94 63 11 382 competences
Employee work-related 91 24 0 142 Company awards 39 2 13 47 Innovation 71 15 15 108
knowledge
Employee attitudes/behaviour 72 15 15 63 Public relation 69 63 11 165 Technology 98 46 21 220
Employee commitments 88 59 0 114 Diffusion & networking 47 12 3 47 Financial dealings 100 80 5 386
Employee motivation 100 100 12 605 Brands 69 19 18 153 Customer support function 53 21 3 68
Employee productivity 17 5 0 3 Distribution channels 50 20 5 76 Knowledge-based 69 14 0 65
infrastructure
Employee training 78 9 1 45 Relationship with suppliers 96 81 2 116 Quality management & 82 13 7 87 improvement
Vocational qualifications 10 2 0 3 Business collaboration 78 49 14 212 Accreditation (certificate) 51 7 4 57 Employee development 95 24 4 404 Business agreements 59 34 5 198 Overall infrastructure/capability 97 62 13 272
Employee flexibility 24 9 0 8 Favourite contract 64 45 17 237 Networking 63 4 0 23
Entrepreneurial spirit 96 8 1 125 Research collaboration 22 6 0 26 Distribution network 65 36 12 111
Employee capabilities 74 2 1 31 Marketing 50 21 9 73
Employee teamwork 51 3 9 22 Relationship with stakeholders 94 42 23 623
Employee involvement 46 19 3 34 Market leadership 91 35 8 154
with community
Other employee features 100 2 85 276
14T, N, and GP represents the number of firms providing disclosure in text, numbers and graphs/pictures respectively; and Av. WC represents the average number of words disclosed by the
sample firms.
148
A
CCO
U
N
T
IN
G
A
N
D
BU
S
IN
E
S
S
RE
S
E
A
RCH
Table 4
Descriptive statistics for dependent and independent variables (untransformed)
z-test z-test K–S
Mean Median Min Max SD Skewness Kurtosis Lilliefors15
Dependent variables
ICDI 0.36 0.36 0.16 0.56 0.08 0.90 –0.99 0.08
ICWC 10488 8551 1234 51430 8901.2 9.46 12.87 0.19*
ICWC% 0.263 0.259 0.089 0.426 0.072 0.79 –1.06 0.05
HICDI 0.355 0.348 0.212 0.561 0.073 1.50 –0.31 0.07
SICDI 0.371 0.370 0.130 0.574 0.092 0.07 –0.89 0.07
RICDI 0.365 0.349 0.111 0.667 0.122 0.79 –1.14 0.08
HICWC 2945 2558 545 8507 1598.2 3.43 0.98 0.12*
SICWC 3551 2526 466 23648 3467.6 13.32 28.83 0.19*
RICWC 3992 2689 223 29993 4634.6 11.99 23.27 0.24*
HICWC% 0.083 0.080 0.033 0.174 0.026 2.28 0.61 0.08
SICWC% 0.090 0.084 0.026 0.281 0.039 7.27 11.32 0.12*
RICWC% 0.090 0.083 0.020 0.266 0.047 3.42 2.03 0.09
Independent variables
Corporate governance factors
Board composition (%) (INED) 0.47 0.50 0.18 0.75 0.13 –0.11 –0.93 0.09
Ownership concentration (%) (SCON) 29.63 26.05 016 79.2 19.55 2.19 –1.43 0.12*
Audit committee size (number) (SAC) 3.46 3 1 7 1.06 – – –
Audit committee meeting (number) (MAC) 3.70 4 1 9 1.41 – – –
Role duality (RDUAL) 0.09 0 0 1 0.29 – – –
Firm-specific factor
Listing age (AGE) (years) 17.15 10.69 0.45 71.87 16.71 5.99 2.58 0.19*
Profitability (ROA) (%) 4.38 3.66 –9.53 18.67 5.79 0.03 0.54 0.09
Firm size (SA) £m 4036.7 383.1 0.0017 39792.2 8782.4 11.15 13.76 0.35*
15* significant at the 1% level.
16Two companies reported that they had not been notified in accordance with sections 198 to 208 of the Companies Act 1985 of any member who had a notifiable interest (≥3%) in the
share capital of the company. One company only has one significant shareholder, who sits on the board of directors, hence has no significant outside shareholding.
17The company is an active trading company focusing on research and development. Although there were no sales recorded during 2004 financial year, contracts were signed.
Vol. 38 No. 2. 2008 149
Table 5
Descriptive statistics for intellectual capital disclosure by category under three formats
Intellectual capital Max
categories Format Min Max possible Mean % SD
Human capital Text 9 20 22 15.87 72 2.44
Numbers 3 12 22 6 27 2.11
Graphs/pictures 0 8 22 1.54 7 1.33
All 14 37 66 23.41 35 4.82
Structural capital Text 5 18 18 13.21 73 2.49
Numbers 1 12 18 5.42 30 2.30
Graphs/pictures 0 6 18 1.42 8 1.49
All 7 31 54 20.05 37 4.99
Relational capital Text 3 20 21 13.52 64 3.33
Numbers 1 15 21 7.05 34 3.35
Graphs/pictures 0 10 21 2.41 11 2.43
All 7 42 63 22.98 36 7.67
Intellectual capital Text 19 57 61 42.6 70 7.07
Numbers 7 38 61 17.44 29 6.95
Graphs/pictures 0 20 61 4.91 8 5.00
All 29 103 183 66.44 36 15.52
icant at the 5% level.
The second panel reveals that the log of ICWC (LnICWC) regression model, with an adjusted R2
of 67%, yields even stronger associations than the ICDI model. Results show highly significant (1% level) relationships between LnICWC and four of the five corporate governance factors examined, i.e. INED, SAC, MAC and SqSCON. However, unlike the ICDI model, ROA and LnAGE are not significant. LnSA is still significant at the 1% level.
The explanatory power of the ICWC% model is weaker (adjusted R2 of 11.2%), as shown in the
third panel. INED and LnAGE show significant associations at the 5% level, with SqSCON show-ing a weak relationship (10% level). All other cor-porate governance factors are insignificant, but in the direction predicted. Neither LnSA nor ROA is related to ICWC%.
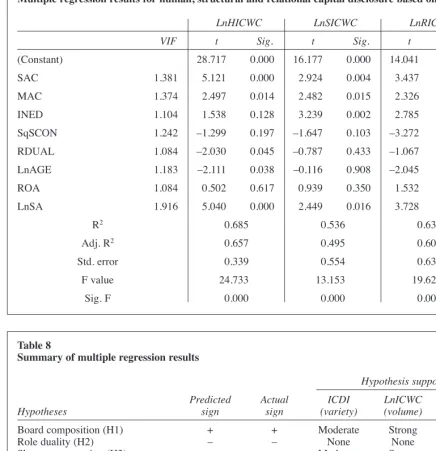
Table 7 presents a summary of multiple regres-sion results for each of the three intellectual capi-tal subcategories based on the word count metric: LnHICWC (log of human capital word count); LnSICWC (log of structural capital word count); and LnRICWC (log of relational capital word count).18
We observe that the two audit committee vari-ables (SAC and MAC) are significantly associated with all three intellectual capital subcategories, confirming our hypothesis of the role these com-mittees play in influencing the level of intellectual
capital disclosure in its various forms. In addition, relational capital disclosures are significantly as-sociated with INED and SqSCON; structural capi-tal disclosures are significantly associated with INED, while human capital disclosures are associ-ated with RDUAL, all in the direction hypothe-sised.
5.4. Examination of hypotheses
Table 8 summarises the associations between the independent variables and intellectual capital dis-closure measures, namely, variety (ICDI), volume (ICWC) and focus (ICWC%).
Board composition was expected to be one of the major corporate governance determinants for intellectual capital disclosure. The significant pos-itive results of all three measures of intellectual capital disclosure, especially for variety (5% level) and volume (1% level), support our hypothesis (H1) that the greater the presence of independent non-executive directors on the board, the greater the intellectual capital disclosure. Detailed analy-sis at item level (not included) reveals that firms with more independent non-executive directors disclose significantly more human capital items (e.g. employee relations and work-related compe-tence, but not diversity or equality), structural cap-ital items (e.g. management philosophy, corporate culture, innovation, knowledge-based infrastruc-ture, and quality management and improvement), and relational capital items (e.g. market presence, relationships with suppliers, business agreements, and marketing issues). They offer support to argu-ments based on both agency and resource depend-ence theories.
18The ICDI models for each of the three intellectual capital
subcategories reveals broadly similar associations and are not therefore presented.
150
A
CCO
U
N
T
IN
G
A
N
D
BU
S
IN
E
S
S
RE
S
E
A
RCH
Table 6
Multiple regression results for ICDI, LnICWC and ICWC%
ICDI LnICWC ICWC%
Unstandardised Standardised Unstandardised Standardised Unstandardised Standardised coefficients coefficients coefficients coefficients coefficients coefficients
Std. Std. Std.
VIF B error Beta t Sig. B error Beta t Sig. B error Beta t Sig.
(Constant) 0.181 0.034 5.402 0.000 7.155 0.275 26.053 0.000 0.234 0.045 5.254 0.000
SAC 1.381 0.016 0.006 0.205 2.805 0.006 0.200 0.047 0.291 4.275 0.000 0.011 0.008 0.162 1.460 0.148
MAC 1.374 0.009 0.004 0.156 2.142 0.035 0.101 0.035 0.195 2.883 0.005 0.005 0.006 0.098 0.882 0.380
INED 1.104 0.106 0.043 0.160 2.456 0.016 1.225 0.354 0.211 3.465 0.001 0.115 0.057 0.200 2.010 0.047
SqSCON 1.242 –0.007 0.003 –0.162 –2.343 0.021 –0.063 0.024 –0.170 –2.633 0.010 –0.007 0.004 –0.180 –1.702 0.092
RDUAL 1.084 –0.013 0.019 –0.045 –0.702 0.484 –0.229 0.152 –0.090 –1.501 0.137 –0.010 0.025 –0.040 –0.407 0.685
LnAGE 1.183 –0.012 0.005 –0.155 –2.295 0.024 –0.064 0.041 –0.098 –1.552 0.124 –0.017 0.007 –0.268 –2.602 0.011
ROA 1.084 0.002 0.001 0.149 2.309 0.023 0.009 0.008 0.071 1.171 0.245 0.002 0.001 0.119 1.212 0.229
LnSA 1.916 0.015 0.003 0.451 5.245 0.000 0.105 0.024 0.347 4.340 0.000 –0.002 0.004 –0.077 –0.590 0.556
R2 0.649 0.696 0.184
Adj. R2 0.618 0.669 0.112
Std. error 0.051 0.418 0.068
F value 21.033 26.005 2.568
Sig. F 0.000 0.000 0.014
Role duality was not found to influence intellec-tual capital disclosure and our hypothesis (H2) was rejected. Share ownership concentration showed significant negative associations with all three measures of intellectual capital disclosure as hy-pothesised, especially by variety (5% level) and volume (1% level). The finding supports our hy-pothesis (H3) that companies with more concen-trated share ownership are less responsive to investors’ information costs, since the dominant shareholders typically have regular access to the
information they require and hence there is less pressure for intellectual capital disclosure in annu-al reports. Anannu-alysis at intellectuannu-al capitannu-al subcate-gory level reveals that the impact of block shareholders is mainly on the volume of relational capital disclosure (e.g. customers, market presence and leadership, customer relationship and acquisi-tion, company awards, public relaacquisi-tion, distribution channel, relationship with suppliers and stakehold-ers, business collaboration and marketing).
Audit committee size was found to be positively
Vol. 38 No. 2. 2008 151
Table 7
Multiple regression results for human, structural and relational capital disclosure based on word count
LnHICWC LnSICWC LnRICWC
VIF t Sig. t Sig. t Sig.
(Constant) 28.717 0.000 16.177 0.000 14.041 0.000
SAC 1.381 5.121 0.000 2.924 0.004 3.437 0.001
MAC 1.374 2.497 0.014 2.482 0.015 2.326 0.022
INED 1.104 1.538 0.128 3.239 0.002 2.785 0.007
SqSCON 1.242 –1.299 0.197 –1.647 0.103 –3.272 0.002
RDUAL 1.084 –2.030 0.045 –0.787 0.433 –1.067 0.289
LnAGE 1.183 –2.111 0.038 –0.116 0.908 –2.045 0.044
ROA 1.084 0.502 0.617 0.939 0.350 1.532 0.129
LnSA 1.916 5.040 0.000 2.449 0.016 3.728 0.000
R2 0.685 0.536 0.633
Adj. R2 0.657 0.495 0.601
Std. error 0.339 0.554 0.631
F value 24.733 13.153 19.625
Sig. F 0.000 0.000 0.000
Table 8
Summary of multiple regression results
Hypothesis support
Predicted Actual ICDI LnICWC ICWC % Hypotheses sign sign (variety) (volume) (focus)
Board composition (H1) + + Moderate Strong Moderate
Role duality (H2) – – None None None
Share concentration (H3) – – Moderate Strong Weak
Audit committee size (H4) + + Strong Strong None
Frequency of audit
committee meetings (H5) + + Moderate Strong None
Listing age – – Moderate None Moderate
ROA + + Moderate None None
Sales + + Strong Strong None
Strong = significant at .01 level, Moderate = significant at .05 level, Weak = significant at .10 level
associated with ICDI and LnICWC, supporting our hypothesis (H4) that companies with larger audit committees tend to provide greater intellec-tual capital disclosure in their annual reports. This is in line with the recommendations of the Smith Report (2003) that audit committees have respon-sibility to oversee documents such as the operating and financial review. This document typically has a strong intellectual capital disclosure emphasis. Results support hypothesis (H5) that a positive re-lationship exists between level of intellectual cap-ital disclosure and frequency of audit committee meetings. This suggests that audit committee activity is an important factor in monitoring man-agement behaviour with regard to reducing infor-mation asymmetry through intellectual capital disclosure.
6. Summary and conclusions
Results based on multiple regression models for the three intellectual capital disclosure measures indicate that, with the exception of role duality, all corporate governance variables together with firm size, profitability and listing age are associated with one or more of the intellectual capital disclo-sure meadisclo-sures. This is consistent with Keenan and Aggestam’s (2001) argument, previously untested, that corporate governance impacts on efficient intellectual capital management, including its communication to stakeholders. The significant positive association for board composition pro-vides evidence for independent directors’ function as a monitoring mechanism, which enhances the effectiveness of the board and reduces both agency costs and information asymmetries between prin-cipals and agents. Moreover, their breadth of ex-pertise and knowledge heighten the board’s awareness of the importance of intellectual capital disclosure, especially structural and relational cap-ital. We also find confirmation of our share con-centration, audit committee size and frequency of audit committee meetings hypotheses,
under-pinned by agency theory arguments. Where share ownership is highly concentrated, smaller share-holders’ interests in relation to intellectual capital need to be protected via corporate governance mechanisms, such as greater independence of the board and larger, more active audit committees for better intellectual capital communication.
We argue that, as well as the variety and volume of disclosure, it is meaningful to measure each firm’s disclosure focus (ICWC%) to examine the proportion of annual reports devoted to intellectu-al capitintellectu-al. On average, 26% of annuintellectu-al report dis-closures were devoted to intellectual capital; this focus is not size dependent and is greater where firms have a higher proportion of independent non-executive directors and shareholdings are more widely spread.
Our findings indicate that, in the absence of mandatory disclosure, effective corporate gover-nance mechanisms impact positively on the vari-ety, volume (word count) and format (text, numbers, graphs/pictures) of intellectual capital disclosure. Future research could usefully explore the relationships identified in the study in greater depth through organisational case studies.
There are several limitations in this study. First, the disclosure scoring sheet is self-developed, which causes difficulty for comparison with prior studies. Second, the study focuses only on corpo-rate annual reports and future studies may consid-er othconsid-er media. Third, thconsid-ere will be othconsid-er factors that affect companies’ intellectual capital disclo-sure practices that have not been examined in this study.19Finally, the study has not attempted to
in-clude corporate culture. For example, companies that choose to have good disclosure policies may also choose to operate good corporate governance practices.
References
Abeysekera, I. (2006). ‘The Project of Intellectual Capital
Disclosure: Researching the Research’, Journal of
Intellectual Capital, 7 (1): 61–77.
Abeysekera, I., and Guthrie, J. (2005). ‘An Empirical Investigation of Annual Reporting Trends of Intellectual Capital in Sri Lanka’, Critical Perspectives in Accounting, 16 (3): 151–163.
Aboody, D. and Lev, B. (1998). ‘The Value relevance of Intangibles: The Case of Software Capitalization’, Journal of Accounting Research, 36 (Supplement): 161–191.
Accounting Standards Board (ASB) (2007). A Review
of Narrative Reporting by UK Listed Companies in
2006, FRC. URL: http://www.frc.org.uk/asb/press/
pub1228.html, accessed 15/01/2007.
Amir, E., and Lev, B. (1996). ‘Value-Relevance of Nonfinancial Information: The Wireless Communication Industry’, Journal of Accounting and Economics, 22 (1–3): 3–30.
Barnes, E., and Walker, M. (2006). ‘The Seasoned-Equity Issues of UK Firms: Market Reaction and Issuance
Method Choice’, Journal of Business Finance and
19As with any disclosure study, the problem of endogeneity
may exist where corporate governance variables are them-selves included in intellectual capital disclosure. For example, increasing the number of independent non-executive directors in relation to executive directors could increase the amount of information on current positions held outside the company by directors available for disclosure. However, this is compensat-ed by the expectation of a rcompensat-eduction in the amount of infor-mation about employee relationships (executive directors’ years of service), employee development (career path of exec-utive directors in the company), and management capability (executive directors’ leadership abilities). As shown in Table 7, by breaking intellectual capital disclosure down to its sub-categories, board composition does not have a significant ef-fect on the volume of human capital disclosure, while there are significant effects on the volume of relational and structural capital disclosures. The problem of endogeneity in this study is not considered significant.