An Acoustic Description of Central Vowels in Three
Austronesian Languages of New Ireland
Phil King
2
Contents
Abstract
Abstract
1. Introduction
2. Sursurunga
3. Notsi
4. Tiang
5. Summary
Appendix A: Sursurunga Wordlist
Appendix B: Notsi Wordlist
Appendix C: Tiang Texts
Abstract
Several Austronesian languages in New Ireland (Papua New Guinea) contrast more than one central vowel. Others have vowels with phonemic length. This paper presents duration measurements and formant analyses for central vowels in the languages Sursurunga, Notsi and Tiang, and examines the differences between them. 1
1.
Introduction
This paper examines the acoustic properties of central vowels in the languages Sursurunga, Notsi and Tiang, all spoken in New Ireland Province of Papua New Guinea.
With the exception of Kuot (a non-Austronesian language) and the St. Matthias languages spoken on Emira, Mussau and Tench Islands, all the languages spoken within New Ireland Province in Papua New Guinea are classified as belonging to the New-Ireland / Northwest Solomonic linkage of the Meso-Melanesian cluster within the Oceanic family of languages (Lynch, Ross, and Crowley 2002).
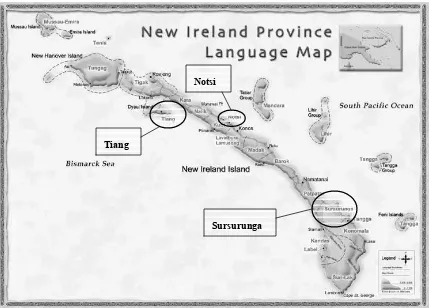
Figure 1 shows the location of language groups within New Ireland Province.
Figure 1: Languages in New Ireland Province2
Although Proto-Oceanic is considered to have only five vowel phonemes (Lynch, Ross, and Crowley 2002:65), it is noticeable that many languages within the New Ireland / Northwest Solomonic linkage have
1
I am very thankful to my friends and associates, whose experience and knowledge in the languages discussed in this paper far exceeds mine.
2
Based on a map produced by SIL PNG, Ukarumpa, Papua New Guinea (Copyright 2003, SIL-PNG), used with permission..
Tiang
Notsi
4
been described as containing at least six mono-moraic vowel phonemes. In several cases this includes a contrast between two or more central vowels.
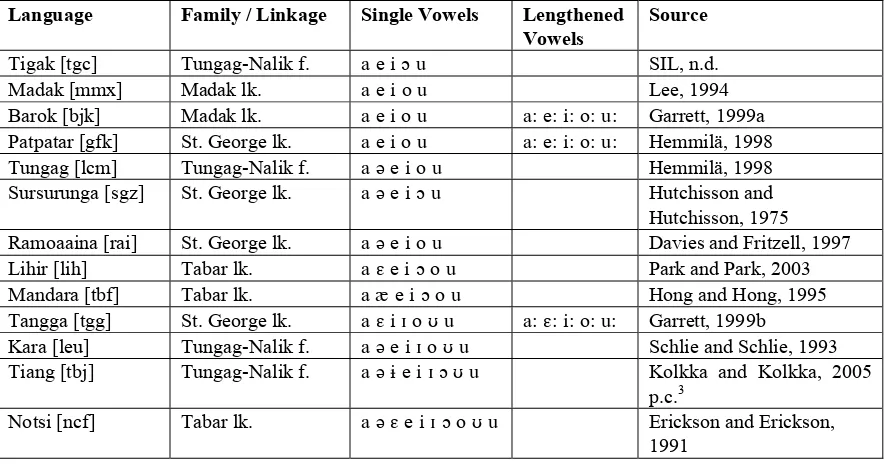
Table 1 shows a summary of the vowel phonemes identified in a number of these languages for which data is available. The classification into families or linkages is taken from Lynch, Ross, and Crowley (2002) with language names and codes taken from the Ethnologue (Gordon 2005). The information is given in order of increasing number of distinct vowel qualities.
Language Family / Linkage Single Vowels Lengthened Vowels
Table 1: Vowels in New Ireland Languages
Of the languages listed here, those that differentiate phonemically between two or more central vowels are: Tungag, Sursurunga, Ramoaaina, Kara, Tiang and Notsi.
The rest of this paper considers three of these languages (Sursurunga, Notsi and Tiang) and presents acoustic data (formant and duration measurements) to clarify the properties of their central vowels.
There are a number of different methodologies available for collecting vowel data and presenting formant information.
The method employed by Peterson and Barney, in their seminal paper on vowel quality in American English (1952), was to record a large number of people saying the vowels under consideration in an identical environment, [hVd]. The formant plots they display then show the variation between speakers for each particular vowel in an identical phonetic environment. This method therefore controls the effects on vowel quality from different environments and allows one to see speaker-to-speaker variation—arising from a variety of factors including idiolectical differences and different sized vocal tracts.
The method I have used, on the other hand, is similar to that of Olson (2001) and controls the variable of speaker variation by eliciting data from only one speaker.4 The phonetic environment for the vowels under consideration is controlled to some degree—only segments preceding the voiceless consonants [p], [t], [k] or [s] were considered5—however the variation in the preceding consonants gives significant variation in
3
The abbreviation p.c. indicates personal communication.
4
I had access to only a limited number of speakers of each language when making and choosing recordings for this paper.
5
the formants recorded for each vowel. The plots in the analysis below therefore reflect the natural variation in quality of a given vowel phoneme from one speaker in different environments.
2. Sursurunga
Sursurunga is within the St. George linkage and is currently spoken by around 3,000 people living in the Namatanai Subdistrict of New Ireland. Hutchisson and Hutchisson (1975) give a phonetic workchart including fourteen different vowel phones. These are analyzed as predictable allophones for the six vowel phonemes / a ə e i ç u /.
In order to investigate the central vowels, [a] and [ə], I gathered a list of 71 monosyllabic words, mostly ending in voiceless consonants, and asked a mother-tongue speaker to read through the words in this list three times (see appendix A). This produced three tokens of each word in a similar context and hence with minimal interference from any features of intonation. Following the methodology of Ladefoged (2003), a redundant item was added to the end of the list to reduce the effects of list intonation.
From this list, five monomorphemic words where chosen for each vowel, in the context CVC1 (where C1 is a voiceless plosive or fricative, [p], [t], [k] or [s]). The selected words are highlighted at the start of the list in appendix A. This produced 15 tokens for each vowel on which to base formant and duration measurements.
The speaker a mother-tongue speaker in his mid fifties.
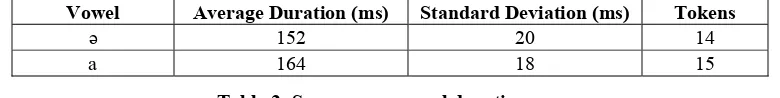
Duration was measured using the PRAAT software for acoustic analysis, measuring the length of the vowel from a spectrogram of each utterance (a screenshot is shown in appendix D). The vowel segment was taken to be the time when the formants were clearly visible, from the end of any plosive burst produced by the preceding consonant and up to the closure of the following stop or start of the following fricative. Table 2 shows the average duration and the standard deviation for the sample.
Vowel Average Duration (ms) Standard Deviation (ms) Tokens
ə 152 20 14
a 164 18 15
Table 2: Sursurunga vowel duration
The more open vowel has a slightly longer average duration, as expected (Lehiste 1970). However, using a two-tailed t-test6 with 27 degrees of freedom, the value of t is 1.61, so this difference in duration is not sufficient to be statistically significant at the 90 percent level.
PRAAT was also used for formant analysis. The formant traces for this speaker with these vowels were generally very clear, so the automatic formant tracker included in this software did a sufficiently accurate job of measuring the formant values. I used a window length of 25ms and took formant lists at the centre of the steady state section of the vowel segment, in order to minimize the effect on the formants from the preceding and following consonants. A screenshot showing the position for measurement and a more detailed methodology for choosing the position to measure formants is given in appendix D. The first and second formants were then plotted using the software JPLOTFORMANTS. This plots the formants for the individual tokens, draws an ellipse around them7 and writes the phonetic symbol at the mean of the sample values. The result is shown in figure 2.
6
This t-test and others throughout the paper are based on the null hypothesis that both samples come from the same distribution and have equal expected means and variances. Thus the expected difference between the sample means is zero. The assumed variance under the null hypothesis is estimated by the pooled variance of both samples.
7
6
Figure 2: Formants of Sursurunga Central Vowels
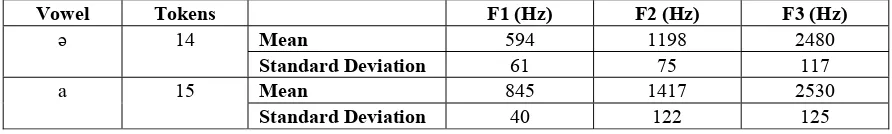
The central vowels form two discrete ellipses. The mean formant values are given in table 3. Using a t-test with 27 degrees of freedom, both the differences in F1 means and in F2 means are statistically significant at beyond the 99.9 percent level (with t values of 13.12 and 5.79 and probabilities of 3.1 * 10-13 and 3.7 * 10-6 respectively).
Vowel Tokens F1 (Hz) F2 (Hz) F3 (Hz)
Mean 594 1198 2480
ə 14
Standard Deviation 61 75 117
Mean 845 1417 2530
a 15
Standard Deviation 40 122 125
Table 3: Mean Formant Values in Sursurunga
3. Notsi
Notsi is spoken by around 1,750 speakers in villages along the central section of New Ireland’s east coast. These villages are surrounded on all sides by Kuot speaking villages, the only non-Austronesian language in New Ireland Province (Chung and Chung 1996). Erickson and Erickson (1991) identify ten vowel phones in their basic phonology description, [a əE e i Iç o U u]. It is still unclear how these should best be described phonologically.
However, the number of minimal pairs between the two central vowels (sometimes marking grammatical distinctions) is so great that there must be a phonemic distinction here. Examples are given in table 4.
[»tələ] ‘here’
[tə»la] ‘there’
[iə] ‘he/she’
[ia] ‘I’
[ƒə] ‘one’
[ƒət] ‘cane’
[ƒat] ‘stone’
Table 4: Minimal Pairs in Notsi
Using the same procedure as for Sursurunga, a list of monosyllabic words was gathered, and a mother-tongue speaker read through the list three times. From these recordings, five examples of each vowel occurring in monomorphemic CVC1 syllables were chosen (where C1 is a voiceless plosive or fricative, [p], [t], [k] or [s]) to give fifteen tokens of each vowel in analogous environments.
The speaker for these recordings was a lady in her mid thirties.
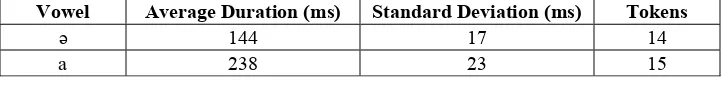
Table 5 shows the averages and standard deviations for the duration measurements of these vowels.
Vowel Average Duration (ms) Standard Deviation (ms) Tokens
ə 144 17 14
a 238 23 15
Table 5: Duration of Notsi Central Vowels
In contrast to Sursurunga, there is a statistically significant difference in these average durations. Using a two-tailed t-test with 27 degrees of freedom the t value is 12.37, making this significant at beyond the 99.9 percent level (the probability is 1.2 * 10-12). The ratio between the average durations is 1:1.65. A comparison of the durations of these vowels in Sursurunga and Notsi is shown in chart 1.
Chart 1: Comparison of Vowel Durations
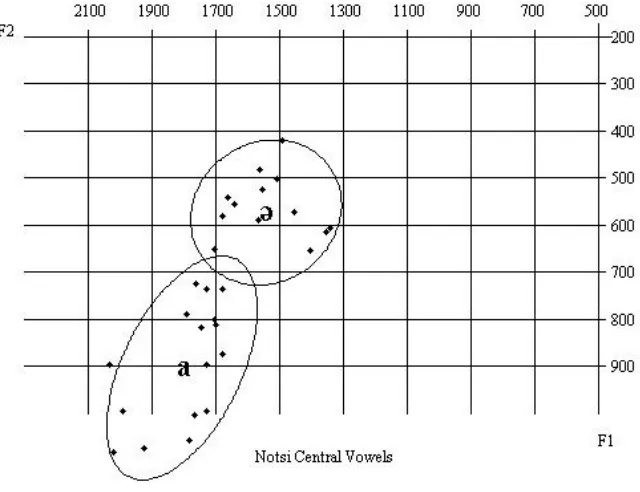
For the formant measurements, PRAAT software was again used with the methodology described earlier. Again, the formants for this speaker on these vowels were clear enough that in most cases the automatic formant tracking capabilities of PRAAT were sufficient to give an accurate reading. Figure 3 shows the first and second formants as displayed using JPLOTFORMANTS.
8
Figure 3: Formants of Notsi Central Vowels
Again, the ellipses are almost totally discrete. As in Sursurunga, the more open central vowel (reflected by a higher F1) also has a higher F2 value, suggesting an articulation more to the “front” of the oral space.
The mean values for the first three formants are given in table 6. Using two-tailed t-tests to compare the mean values of the formants for each vowel, both F1 and F2 show differences that are statistically significant at beyond the 99.9 percent level (the t values are 8.51 and 5.80 respectively). This confirms the hypothesis that these are distinct vowel qualities.
Vowel Tokens F1 (Hz) F2 (Hz) F3 (Hz)
Mean 574 1545 2837
ə 14
Standard Deviation 80 123 139
Mean 905 1808 3051
a 15
Standard Deviation 123 122 192
Table 6: Mean Formant Values in Notsi
Hubbard (1998, cited in Cahill 2002) notes that languages where phonologically lengthened vowels also differ in quality to their standard counterparts tend to have ratios around 1:1.5. By contrast, in languages where lengthened vowels have the same quality as their standard counterparts the ratio is closer to 1:2. Since this pair of Notsi vowels shows a distinction in both length and quality, the ratio of 1:1.65 substantially agrees with Hubbard’s observations.
4. Tiang
The data available to me for Tiang was much more limited than that for either Sursurunga or Notsi, and I am particularly grateful to two mother-tongue speakers for their help and the language data they collected and allowed me to use. In a report on the languages of New Ireland, Lithgow and Claasen (1968) write of Tiang,
Following an Alphabet Design Workshop, Garrett (1999c) identifies nine different phonemic vowels, / a ə
ʌɨ e i ɔʊ u /. More recent study of the language based on a longer period of time living in this area still identifies 9 vowels but reclassifies them as / a əɨ e ɪ i ɔʊ u / (Kolkka and Kolkka 2005 p.c.).8
The selection of phonetic minimal pairs in table 7 supports the hypothesis that there are indeed three phonemically contrasting central vowels.
The acoustic data used for the analysis below was collected by two associates and consists of four vernacular Sunday School books being read by a 49-year-old male speaker. The text of these stories is given in appendix C, using the orthography proposed by the Tiang Language Committee (1999). These texts do not allow useful measurements of vowel duration to be made, since intonation and stress have more effect on the length of any individual vowel than the intrinsic duration of the vowel under consideration. However, the fact that these were read texts, together with the clarity of the reader, meant there was less reduction of vowel quality than in natural speech and enabled useful formant measurements to be taken.
All measurements were taken for vowels preceding a voiceless plosive or fricative, [p], [t], [k] or [s], either in closed syllables or in open syllables followed by a voiceless onset for the next syllable. Where the vowels in unstressed syllables were considered, examples measuring less than 45 milliseconds9 were rejected, in order to avoid basing formant measurements on very short vowels that might also be subject to neutralization of quality.
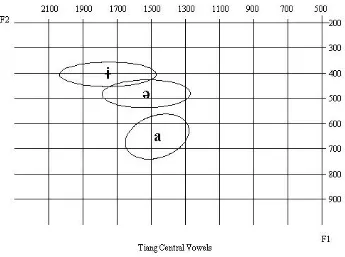
With these restrictions on the segments that were analyzed, the four texts yielded some 22 suitable tokens of the highest vowel, 59 tokens of the mid-open vowel and 42 tokens of the most open vowel. The ratio between the numbers of tokens for each vowel reflects the relative frequency of these phonemes in the texts. Figure 4 shows the formant measurements for these tokens as calculated by PRAAT (using the same methodology as before) and displayed using JPLOTFORMANTS. Each point represents one token and the phonetic symbol gives the phoneme as classified by Kolkka and Kolkka. Figure 5 represents the same data, but only displaying the mean values and ellipses to show the distribution of the tokens.
8 Presumably the correspondence between the two analyses (with Garrett’s analysis given first) is: [ʌ] becomes [ə], [ə] becomes [ɨ] and [ɨ] becomes [ɪ].
9
10
Figure 4: All Central Vowel Tokens in Tiang
Figure 5: Mean Formant Values of Tiang Central Vowels
The mean values and standard deviations for the first three formants of each of the Tiang central vowels are
Table 8: Mean Formant Values in Tiang
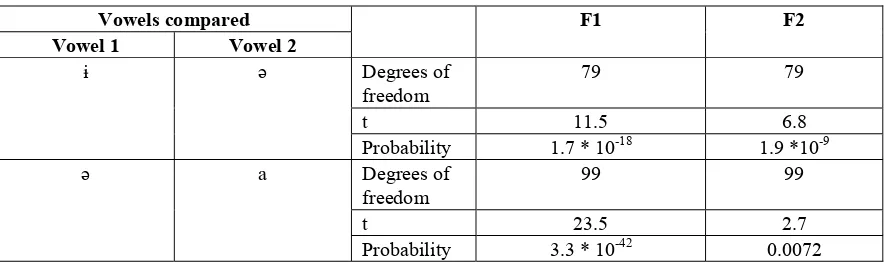
Using these results, table 9 shows the statistical significance of the differences in mean formant values, using a two-tailed t-test.
Table 9: Results of Statistical Tests on Tiang Vowels
These figures show that for [ɨ] and [ə], the differences between both F1 and F2 are statistically significant at beyond the 99.9 percent level. For [ə] and [a], the difference in F2 is significant only at the 99 percent level, but the difference in F1 is significant at beyond the 99.9 percent level. This is not surprising because it is primarily the perceived “height” of these two vowels that distinguishes them.
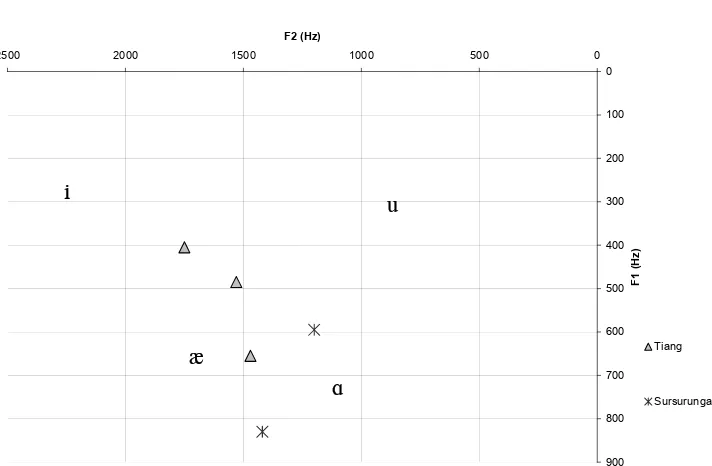
Figure 6 shows the mean formant values in Sursurunga and Tiang on the same chart. The average formants for the most peripheral English vowels from male speakers of American English (as recorded by Peterson and Barney 1952) are given for comparison.
12
Figure 6: Comparison of Vowels in Sursurunga, Tiang and US English
5. Summary
It is not possible to draw many firm conclusions from the data presented in this description, due to the limited amount of data that has been used. In particular, results only show the vowels of one speaker from each language.
However, there are some useful observations that can be made.
1. Of the two central vowels in Sursurunga, the one with a lower average F1 also has a lower average F2. This corresponds with the auditory perception that this mid-open central vowel is further “back” than the more open central vowel in Sursurunga, and also than the standard central vowel
[ə] in American English. Recognizing this difference is important in order to sound natural when native English speakers learn to speak Sursurunga.
2. The similarity in the IPA symbols used for central vowels in Notsi and Sursurunga masks an important phonetic difference. Although the relationship between the quality of the central vowels in both languages is similar, the relationship between lengths is markedly different. In Sursurunga the lengths differ only in ways that would be expected between these two vowels, one of which is more open than the other. In Notsi there is a significant difference, with a length ratio around 1:1.65. A length system of this kind (where quality changes in the longer vowel) has not been reported in any of the other languages of New Ireland, but still it may be best to describe Notsi as a language with phonemic length rather than just with two central vowels of differing quality.
3. Evidence presented here supports the hypothesis that Tiang has three distinct central vowel phonemes. Again, there is no other New Ireland language for which this has been suggested.
Appendix A: Sursurunga Wordlist
14
Appendix B: Notsi Wordlist
The table below gives the word list elicited from a lady in her mid thirties. The words in bold are those used for formant analysis. The Notsi words are given in a trial, mostly phonemic, orthography, in which the longer and more tense vowels are represented by repeated graphemes and <x> represents a voiced velar fricative.
muut ‘broken’ baai ‘cover something’
les ‘lime powder’ bobo ‘fish species’
kup ‘sea cucumber’ kiikii ‘kingfisher’
Appendix C: Tiang Texts
The four texts below were used for analysis of central vowels in Tiang. The orthography used is the one developed by the Tiang Language Development Committee, 1999, with the graphemes <a>, <á> and <â> representing the phonemes [a], [ə], and [ɨ] respectively. The segments included in the analysis are
Text 3: Atitopong Iná Kurâng, Atitopong Pátiná Sáká 1:20–2:25
16
Text 4: Atitopong Iná Mâlmâlâvâkán Sat, Atitopong Pátiná Sáká 3
Sáká ian á tuâi ká sang siná ten mot ká jâi nán, “Á sa bul wâi ná Pásángán ká tibonten imiai po imiai ik
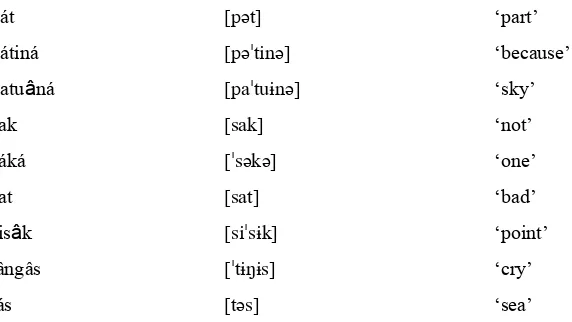
Phonetic transcriptions and glosses of the highlighted words for which glosses are available are given in table 10.10 As yet there is no written morphological analysis of the language, so it is not possible to include morpheme breaks in this data.
pát [pət] ‘part’
pátiná [pəˈtinə] ‘because’
patuâná [paˈtuɨnə] ‘sky’
sak [sak] ‘not’
sáká [ˈsəkə] ‘one’
sat [sat] ‘bad’
sisâk [siˈsɨk] ‘point’
tângâs [ˈtɨŋɨs] ‘cry’
tás [təs] ‘sea’
18
Appendix D: PRAAT Screenshots
Figure 7: Screenshot showing method for measuring formants
Figure 7 shows the screen on PRAAT that was used for measuring formants. The word displayed is the first token of the word [bət] ‘heaven’ in Sursurunga. The dashed vertical line shows the position in the middle of the vowel at which the formant reading was taken. The dots in the centre show the outcome of PRAAT’s automatic formant tracking. The window displayed top right shows the listing of five formants from the automatic tracking at the cursor position.
Many of the vowel segments in consideration did not have such clear and steady formant tracks as this example. In these cases I chose the position to measure the formants based on the following criteria:
1. If a portion of the vowel showed a ‘steady state’ in the formant tracks (for at least 15 milliseconds), I took the formant reading from the centre of the steady state. Sometimes this was towards the end of the vowel segment, if the formants (particularly F2) were initially influenced by the preceding consonant, or at the beginning if there was influence on the formants from the following consonant. At other times, when the F2 value was influenced by both preceding and following segments, the steady state section was towards the middle of the vowel segment.
2. If there was no steady state portion of the vowel, but F2 either steadily increased or steadily decreased throughout the vowel segment, then I took the formant readings at the midpoint of the vowel segment.
Figure 8 gives a display from PRAAT (of the same token) showing how duration measurements of vowels were taken. The vowel segment was treated as beginning after the burst on any preceding stop, and the end was taken at the closure for the following stop or end of voicing at the beginning of a following fricative. This section of the vowel was selected and the length of the selection read from the bottom of the screen. Duration was recorded to the nearest millisecond.
20
References
Cahill, Mike. 2002. Measuring Duration with Speech Analyzer. Unpublished ms.
Chung, Chul-Hwa and Kyung-Ja Chung. 1996. Kuot Grammar Essentials. Datapapers on Papua New Guinea Languages, 42, 1–75.
Condra, E. 1991. Patpatar Phonology Essentials. Ukarumpa: SIL, unpublished ms.
Davies, R., and L. Fritzell. 1997. Ramoaaina Phonology Essentials. Ukarumpa Papua New Guinea: SIL, unpublished ms.
Erickson, L., and L Erickson. 1990. An Organized Phonology Data of the Nochi Language of East Coast Central New Ireland. Ukarumpa, Papua New Guinea: SIL, unpublished ms.
Garrett, G. 1999a. Barok Orthography Workshop Report. Ukarumpa, Papua New Guinea: SIL, unpublished ms.
Garrett, G. 1999b. Tangga Orthography Workshop Report. Ukarumpa, Papua New Guinea: SIL, unpublished ms.
Garrett, G. 1999c. Tiang. Ukarumpa, Papua New Guinea: SIL, unpublished ms.
Gordon, Raymond G., ed. 2005. Ethnologue: Languages of the World. Fifteenth edition. Dallas, Tex.: SIL International.
Hemmilä, R., ed. 1998. Orthography and Phonology Database: Islands and Momase Region. Datapapers on Papua New Guinea Languages, 43.
Hong, S., and H. Hong. 1995. Orthography and Phonology Description of the Mandara Language.
Ukarumpa, Papua New Guinea: SIL, unpublished ms.
Hubbard, Kathleen. 1998. Quantity or quality? Characteristics & typology of vowel length. Paper presented at LSA meeting, New York City.
Hutchisson, D., and S. Hutchisson. 1975. Sursurunga Phonology. Workpapers in Papua New Guinea Languages, 13, 163–202.
JPLOTFORMANTS, developed by Roger Billersley-Mosley, and available for download at <http://www.linguistics.ucla.edu/people/grads/billerey/PlotFrog.htm.>
Ladefoged, P. 2003. Phonetic Data Analysis: An Introduction to Fieldwork and Instrumental Techniques. Oxford: Blackwell Publishing.
Lee, R. 1994. Organised Phonology Data of the Madak Language. Ukarumpa, Papua New Guinea: SIL, unpublished ms.
Lehiste, I. 1970. Suprasegmentals. Cambridge, MA: MIT Press.
Lithgow, D., and O. Claasen. 1968. Languages of the New Ireland District. Port Moresby: Department of Information and Extension Services.
Lynch, J., M. Ross, and T. Crowley. 2002. The Oceanic Languages. Richmond: Curzon Press.
Olson, K. 2001.The Phonology and Morphology of Mono. University of Chicago: PhD Dissertation.
Park, M., and S. Park. 2003. Organized Phonology Data of the Lihir Language. Ukarumpa, Papua New Guinea: SIL, unpublished ms.
Peterson, G. E., and H. E. Barney. 1952. Control methods used in a study of vowels. Journal of the Acoustical Society of America, 24, 175–184.
PRAAT v.4.2.05, from <www.praat.org.>
SIL, n.d. Organised Phonology Data of the Tigak Language. Ukarumpa, Papua New Guinea: SIL, unpublished ms.