Journal of Chemical and Pharmaceutical Research, 2015, 7(9S):70-75
Research Article
ISSN : 0975-7384
CODEN(USA) : JCPRC5
The effect of the calcinations temperature during synthesis of
TiO
2-Fe
3O
4-bentonite as photocatalyst material
Emma Savitri
*, Restu Kartiko Widi and Arief Budhyantoro
Department of Chemical Engineering, University of Surabaya, TG building 5th floor, Raya Kalirungkut, Surabaya, Indonesia
_____________________________________________________________________________________________
ABSTRACT
The TiO2-Fe3O4 supported bentonite has been synthesized. The syntheses of the TiO2-Fe3O4 based photocatalyst have been carried out by sol-gel method. The bentonite used for porous support was obtained from Pacitan, Indonesia. The mol ratio of Ti and Fe in this experiment was 1:1. The syntheses of the photocatalyst material were followed by calcinations. This experiment was focused on the effect of temperature calcinations toward Ti and Fe crystal phase, which was affected to the capability of the materials in photocatalysis of phenol degradation. The variation of the calcinations temperature was 500, 600 and 700oC. The physicochemical properties of TiO2-Fe3O4 bentonite samples were characterized by X-ray diffraction. Photocatalytic activity of the materials was evaluated by phenol photodegradation using UV light. The calcinations temperature was significantly influenced in the forming of anatase phase of TiO2 which was affected in the catalytic activity.
Keywords: bentonite; calcination; TiO2-Fe3O4; phenol degradation; photocatalyst
_____________________________________________________________________________________________
INTRODUCTION
In this research, TiO2/Fe3O4 photocatalyst were supported by bentonite. TiO2/Fe3O4-bentonite photocatalytic material were prepared by sol gel method. The photocatalysts material were characterized by X-ray powder difraction (XRD). The photocatalytic activity of photocatalysts was evaluated by photocatalytic degradation of phenol compounds. The effect of calcination temperature on the photocatalytic activity of the TiO2/Fe3O4-Bentonite were also discused.
EXPERIMENTAL SECTION
The selected metal salts, ammonium hydroxide, tetra methyl ammmonium hydroxe and ethanol were purchased from Sigma-Aldrich. Bentonite was obtained from Pacitan, Indonesia and size particle reduced up to 200 mesh. Nitrogen and Oxigen gases were purchased from Samator, Indonesia.
Preparation of Ti Colloid
TiCl4 was mixed with ethanol : H2O in the specified composition in the flask and added NH4OH up to pH about 7. The mixture was stirred to obtain white mixture.
Preparation of magnetite colloid
FeCl3, FeCl2 and NH4OH were mixed and placed on the flask. The N2 gas was flowed into the mixture for a specified periods and then the solid was filtered and added by TMAOH in the presence of stirrer
Preparation of bentonite suspension
Ti, Fe colloid and bentonite suspension were mixed in the reflux flask. The mixture was stirred and heated up to keep temperature about 50 ° C for spesified periods. Then the mixture was filtered, washed with ethanol : H2O mixture and dried in the oven. Dried material was size reduced up to 140 mesh.
Calcination procedure
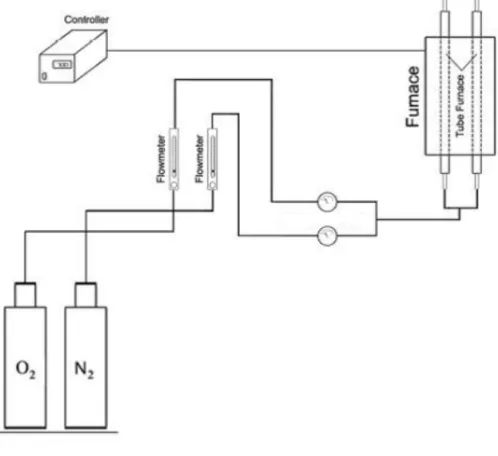
A spesified mass of photocatalyst was fed into the calcination tube and heated up in the calcination furnace. The condition was set up at specified calcination temperature and time. N2 and O2 gas was flowed alternately for specified rate.
Figure 1. The Calcination Equipment
Photocatalyst material characterization
Photocatalytic activity test material against degradation of phenol
The specified mass of photocatalyst material was added to the phenol solution with a certain concentration. The solution was exposed under UV light and sunlight for certain periods. After process, the solid was filtered and the filtrate was adjusted to the pH 7.9 ± 0.1 with the addition of phosphate buffer solution. It was also added by aminoantipirin and potassium ferisianida. The samples were analyzed by spektrofotometer at 510 nm wavelength.
RESULTS AND DISCUSSION
The characterization of TiO2/Fe3O4-Bentonite was conducted by X-Rays Diffraction. The analysis was conducted to observe the influence of the calcination temperature on the anatase phase (TiO2) and magnetite phase (Fe3O4) on the bentonite as support.
The effect of calcination temperature on the anatase phase (TiO2) and magnetite phase (Fe3O4) on bentonite
as support
Generally, anatase phase appears to be more dominant on the temperature calcination 500 ºC to 600 ºC and otherwise, at 700 ° C the rutile phase of TiO2 appear to be more dominant because high temperature changes the crystal phase (anatase phase into rutile phase).
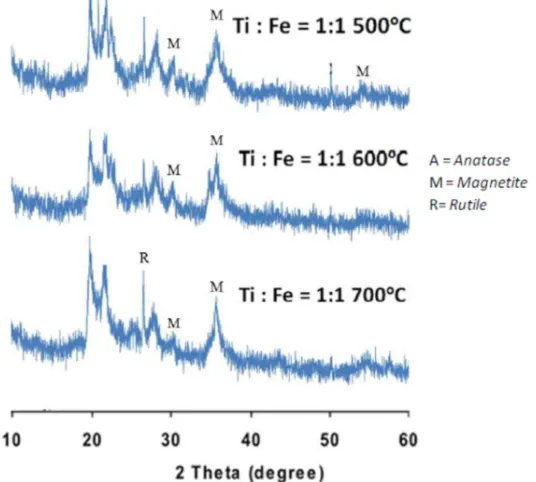
Figure 2. The XRD analysis at ration Ti : Fe = 1 : 1 at various calcination temperature
Table 1. The Intensity of Diffraction Peak of Photocatalyst at ratio Ti : Fe = 1 : 1
2θ
Intensity of Diffraction Peak (%)
500 ºC 600 ºC 700 ºC
Anatase Magnetite Anatase Magnetite Anatase Magnetite Rutile
27.446 (R) 33.05
30.105 (M) 26.35 28.45 12.67
35.451 (M) 47.44 68.14 58.72
The Figure 2 and Table 1 showed the XRD analysis of photocatalyst material at ratio of Ti: Fe = 1: 1 The dominant phase of material was magnetite. It is caused the calcination process tend to form iron oxide and titanium oxide. The iron oxide was more easily to react rather than titanium dioxide. Moreover, it might be the anatase phase that was formed on calcination temperatures at 500 and 600 ºC was amorphous region. It was difficult to detect the amorphous phase on the XRD analysis. But at the calcination temperature at 700 ºC rutile phase began to form.
At high temperature, the stability of rutile structure is higher than anatase phase. The O atoms tended to bond to Ti creating the rutile phase. This is consistent with the theory that state high temperature might change the crystalline phase of TiO2 from anatase phase into rutile phase. From the table 1, it can be seen that for the ratio of Ti: Fe = 1: 1 and calcination temperature of 600 ºC, the intensity of the diffraction peak reached 68.14 % for magnetite phase. This was the greatest intensity of magnetite phase rather than other.
Figure 3. The XRD analysis at ratio Ti : Fe = 2 : 1 at various calcination temperature
Table 2. The Intensity of Diffraction Peak of Photocatalyst at ratio Ti : Fe = 2 : 1
2θ
Intensity of Diffraction Peak (%)
500 ºC 600 ºC 700 ºC
Anatase Magnetite Anatase Magnetite Anatase Magnetite Rutile
25.281 (A) 27.46 42.08
27.446 (R) 40.84
30.105 (M) 25.29 13.95 11.75
35.451 (M) 72.51 52.88 38.87
43.123 (M) 9.52
and magnetite phase. Both of them were responsible for decomposing the phenolic compound. However, for the ratio of Ti: Fe = 2 : 1 at the calcination temperature 700 ° C, the rutile phase also appeared on the material. Increasing rutile phase on the crystal will reduce the number of anastase phase. It affected on the activity of photocatalysis. The activity photocatalyst will be lower.
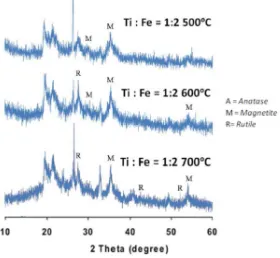
Figure 4 and Table 3 showed that the dominant phase on the photocatalyst material was rutile and magnetite phase. At this condition the magnetite phase had the highest value on magnetite phase. It might be caused the amount of Fe was the highest compared other ratio.
Figure 4. The XRD analysis at ratio Ti : Fe = 1 : 2 at various calcination temperature
Beside magnetite phase, the rutile phase was also dominant at the calcination temperature 600 and 700 ºC. It is due to the stability of rutile structure was high at higher temperature.
The atoms O were bonded to Ti to form titanium dioxide in the form of rutile phase. Acording to Figure 4 and Table 3, it can stated that the ratio of Ti : Fe = 1 : 2 at calcination temperature 600 ºC gave relatively better material than it on other condition. The percentage of magnetite phase of material at the calcination temperature of 600 ºC was 60.55%.
2θ
Intensity of Diffraction Peak (%)
500 ºC 600 ºC 700 ºC
Anatase Magnetite Anatase Magnetite Rutile Anatase Magnetite Rutile
27.446 (R) 51.97 31.52
30.105 (M) 3.21 14.94
35.451 (M) 12.66 60.55 35.67
41 (R) 10.19
The Performance of Photocatalyst Materials on Degradation Phenolic Compound
The analysis of the relation between the characterization of material and the photocatalyst ability of Ti / Fe-bentonite composite has been already conducted as shown on Table 4.
Table 4 The Performance of Photocatalyst Material on Degradation Phenolic Compound
Ratio higher conversion occured when the degradation process used the photocatalyst at 600 ºC and ratio of Ti: Fe = 2 : 1. This is in line with the characterization results using X-ray diffraction, where the ratio of Ti : Fe = 2 : 1 gave the anatase and magnetite phase. Anatase and magnetite phase play a role to decompose the phenolic compound. Anatase phase is the main phase to decompose the phenolic compound. The photocatalytic activity of the anatase phase is higher than that of the magnetite phase. While the ratio of Ti : Fe = 1: 2 and Ti : Fe = 1 : 1, the dominant phase was only magnetitenya phase and anatase phase is not formed, it affected on lowering decomposition ability of photocatalyst material.
CONCLUSION
The conclusions of the research were
1.The ratio of Ti:Fe 1:1 and 1:2 gave photocatalyst material which have magnetite phase more dominant than other phase, Otherwise anatase phase was formed on higher ration of Ti : Fe (2:1)
2.At 500 ºC, photocatalyst had magnetite phase as dominant phase. At 600 ºC, the dominant phase was anatase and magnetite, other wise at 700 ºC, magnetite and rutile phase were created. On this study, 600 º C of calcication temperature gave better material than other condition
3.The higher conversion was conducted on Ti:Fe 2 :1 at 600 ºC calcination Temperature for 60 min UV exposed. The conversion of phenol reached as 16.085 %
Acknowledgements
The authors are thankful for the financial support of the Ministry of Research Technology and Higher Education Republic Indonesia Directorate General of Higher Education of Indonesia through Hibah Penelitian Unggulan Perguruan Tinggi 2015.
REFERENCES
[1]T.J.L. Yan; N.Long; X.C. Shi; D.H. Wang; Z.H.Li; X.X. Wang, Environ. Sci. Technol., 2010, 1380 – 1385 [2]J.G. Yu; L.J. Zhang, B.Chen, Y.R Su; J.Phys. Chem, 2007, 10582 – 10589
[3]Y.H. Zheng; C.Q.Chen; Y.Y. Zhan; X.Y. Lin; Q.Zheng; K.Wei; J.F. Zhu.; J. Phys. Chem. C, 2008, 10773 – 10777
[4]H. Tang; J.C.Chang; Y.Y. Shan; S.T. Lee; J.Phys.Chem. B, 2008, 4016 – 4021
[5]Z.H. When; G. Wang, W. Lu; Q. Wang; Q. Zhang; J.H. Li; Cryst. Growth Des., 2007, 1722 -1725
[6]R.Y. Hong, S.Z. Zhang, G.Q. Di; H.Z. Li; Y.Zheng, J.Ding, D.G. Wei; Mater. Res. Bull., 2008, 2457 - 2468 [7]C.K.S.J. Doh; S.G. Lee; S.J. Lee; H.Y. Kim; Appl. Catal. A, 2007, 127 – 133
[8]X. Wang, P.Hu, Y.F. Li; L.J.Yu, J. Phys. Chem. C, 2007, 6706 - 6712
[9]S. Moribe; T.Ikoma, K.Akiyama, Q.W. Zhang, F.saito, S.T. Kubota, Chem. Phys. Lett., 2007, 4 - 6 [10] J.Lin, J.Lin, Y.F. Zhu, Inorg. Chem., 2007, 8372 - 8378