J. Iran. Chem. Soc., Vol. 7, Suppl., July 2010, pp. S154-S160.
JOURNAL OF THE
Iranian
Chemical Society
Synthesis of TiO
2Nano Powder by the Sol-Gel Method and Its Use as a Photocatalyst
A. Karami
Inorganic Chemistry Research Group, Sharif Institute of Technology, 79, Ghasemi st., Sadeghi st., Azadi ave., P.O. Box 13445-686, Tehran, Iran
(Received 25 December 2008, Accepted 4 April 2010)
In this work the titanium dioxide powder was prepared by the optimized and simple Sol-Gel method and then characterized. The gelling pH was set to values of 3 (TiO2-A), 7 (TiO2-N) and 9 (TiO2-B) to observe the effect on the properties of the material. In these three cases nanoparticulated materials were obtained with particle sizes between 10nm and 20nm. The larger surface areas were obtained at pH 3, which is several times larger than the others. Furthermore, with the gelling condition pH 3, it was possible to synthesize pure anatase phase titania. Some preliminary results on the test of the photocatalytic activity of the synthesized materials in the reduction of nitric oxide are presented. Based on these results the nanoparticle TiO2, which was prepared in acidic pH 3 with the pure anatase phase and the lowest particle size has the highest reactivity for the photocatalytic reduction of nitric oxide.
Keywords: Titanium dioxide, Sol-gel method, Photocatalyst, Nanoparticles
INTRODUCTION
Since Gleiter's report [1] on nano-materials, more attention has been given to the research of nano-materials. Compared with traditional materials, nano-phase materials have unusual chemical, mechanical, optical, electrical and magnetic properties [2].
Titanium dioxide has attracted great attention in the fields of environmental purification, solar energy cells, photocatalysts, gas sensors, photoelectrodes and electronic devices.
Catalytic applications of titanium dioxide have been studied for decades regarding the elimination of environmental pollutants and, more recently, for photocatalytic processes concerning the degradation of pollutants in air, water and soil [3-10].
*Corresponding author. E-mail: [email protected]
For instance, Mirkhani and his co-workers in the university of Isfahan investigated the photocatalytic degradation of Azo dyes that were catalyzed by an Ag doped TiO2 photocatalyst [11]. The degradation of dyestuff wastewater using visible light in the presence of a novel nano TiO2 catalyst doped with an upconversion luminescence agentis considered as well[12]. Some investigators studied the enhanced photocatalytic degradation of 4-chlorophenol by Zr4+ doped nano TiO2 [13].
There are many methods for preparing nano particles of TiO2 sol-gel method [14], ball milling [15], chemical vapour deposition [16] and microemulsion [17].
Karami
nanoparticles have shown higher photocatalytic activity than rutile TiO2 [19].
N.Venkatachalam et al synthesized nano TiO2 via the sol-gel method using titanium (IV) isopropoxide as the precursor. The sample showed higher photocatalytic activity for the degradation of bisphenol than commercial TiO2 [20]. Some investigators prepared alkaline earth metal doped nano TiO2 and studied the photocatalytic degradation of 4-Chlorophenol with the synthesized nano TiO2 [21]. The nano-sized TiO2 photocatalysts were prepared by sol- gel and ultrasonic-assisted sol-gel methods using two different sources of ultrasonicators i.e. a bath type and a tip type. The samples prepared with the ultrasonic-assisted method showed significantly better degradation of 4-Chlorophenol than the others [22].
In this work the results on the characterization of the physical properties of sol-gel synthesized TiO2 are presented. The effects of the gelling pH on the crystalline phase, particle size and preliminary results of the photocatalytic reduction of nitric oxide are also presented.
EXPERIMENTAL
Titanium dioxide nanoparticles were prepared by the sol-gel method with 10ml titanium alkoxide, as the raw material, mixed with 40ml 2-propanol in a dry atmosphere. This mixture was then added dropwise into another mixture
consisting of 10ml water and 10ml 2-propanol. In this step, to investigate the effect of pH upon the samples properties, hydrochloric acid or ammonium hydroxide was added. With this addition, the acidity-alkalinity of the gel was adjusted to the values pH 9 (TiO2-B), pH 3 (TiO2-A) and pH 7 (TiO2-N); in addition, P25 Degussa titanium dioxide was employed as the reference material (TiO2-R). A yellowish transparent gel was formed after 1h stirring. The obtained gel was then dried at 105°C for several hours until it turned into a yellow block crystal. Calcination of the synthesized materials was carried out in air at 500°C for six hours in a Fischer Scientific furnace. Specific surface areas (BET measurements) were determined using Micromeritics ASAP-2000 apparatus based on N2 adsorbtion. The prepared samples were analyzed by using an XRD Rigaka D/MAX-rA powder diffractometer with a nickel-filtered Cu Kα radiation source or a Shimadzu XRD-6000 Xray diffractometer with a nickel-filtered Cu Kα radiation source. The phase structure and crystallite size of TiO2 were determined from the X-ray diffraction patterns.
For TEM imaging with a JEM-1200EX TEM, the TiO2 particles prepared by calcining were dispersed in anhydrous ethanol by an ultrasonic process and a drop of the suspension was placed onto a carbon coated copper grid. The excess liquid was removed using a paper wick and the deposit was dried in air prior to imaging. The size and morphology of TiO2 particles were obtained from the TEM micrograph.
The surface composition and chemical state of the film sample
Table 1. Crystalline phase, specific surface areas, pore volume, average particle sizes, relative OH intensity (XPS), energy band gap and photocatalytic activity of the studied materials.
Synthesis of TiO2 Nano Powder by the Sol-Gel Method and Its Use as a Photocatalyst
were examined by a VG ESCALAB MKII XPS, using a monochromatic aluminium X-ray source. The pressure was maintained at 6.3 × 10⁻⁵Pa. The binding energies were calibrated with respect to the signal for adventitious carbon (binding energy, 284.6eV). Quantitative analysis was carried out using the sensitivity factors supplied with the instrument. Diffuse reflectance spectroscopy measurements in the UV-visible region were employed to determine the band gap energy of the samples.
The test for photocatalytic activity in the reduction of nitric oxide was performed by FTIR measurements in a Bruker IFS 66v/S spectrometer employing a home made 20cm length gas cell with a fixed volume. All the reported values are an average of four determinations. Blank determinations were carried out wherever necessary and corrections were made if required.
SEM, BET, TEM,XRD, DRIFTS and test of photocatalytic activity were determined in the Research Institute of the Petroleum Industry. Other tests were conducted in the Materials and Energy Research Center.
RESULTS AND DISCUSSIONS
The obtained values for the specific surface area and pore volume of the synthesized materials, as well as the reference material are summarized in table 1. As can be seen in this table, the achieved specific surface area was almost 50% higher than that of the reference material (TiO2-R) in the case of an acid preparation (TiO2-A).
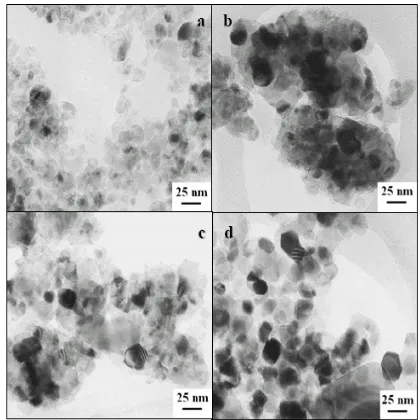
On the other hand, samples TiO2-N and TiO2-B have surface areas that are also smaller than that of TiO2-R. The TEM of the four samples are shown in figure 1, from which it can be seen that sample TiO2-A has the smallest particle sizes; it has well defined granules like the reference sample. Furthermore, samples TiO2-N and TiO2-B look like agglomerates of small particles, slightly bigger than those of the acid sample. Despite this agglomeration, it can be observed that these samples have smaller particle sizes than the reference sample. Average particle sizes are presented in table 1. As shown, the nano particle titanium dioxide has been successfully synthesized, with average particle sizes smaller or equal to 20nm.
Fig. 1. TEM photographs of the studied samples; a) TiO2-R; b) TiO2-A;c) TiO2-N; d) TiO2-B. Reference bar corresponds to 25nm.
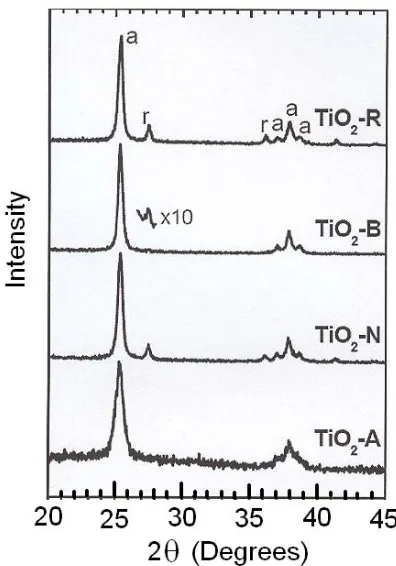
Figure 2 shows the x-ray diffraction (XRD) patterns of the four samples in the 2θ range from 20 to 45 degrees. In this range, four diffraction peaks of the anatase phase of titania and two peaks of its rutile phase can be observed; these peaks are labelled “a” and “r”, respectively. The XRD results show that the acid preparation consists of pure anatase phase; unlike the reference material, which consists of a mixture of anatase and rutile structures. Like the reference material, the neutral preparation consists of a mixture of anatase and rutile phases. Furthermore, the material prepared at pH 9 also seems to be pure anatase as its diffraction pattern barely shows evidence of the rutile phase. However, a ten time’s magnification of the most intense peak of the rutile phase, inserted in figure 2, proves the presence of rutile titanium dioxide in this sample. These results indicate that the titanium dioxide was synthesized in the pure anatase phase by adjusting the gelling pH.
Karami
from the oxygen 1s and titanium 2p orbitals. The two peaks of titanium 2p (1/2,3/2) orbitals correspond to the titanium dioxide chemical environment. It as evident that the Ti2P XPS peak was sharp and strong, indicating that the Ti element existed mainly as the chemical state Ti+4 on the basis of the principle and instrument handbook [23].
However, the high peak of oxygen, 1s, also corresponds to oxygen in the TiO2 crystal lattice. Furthermore, there is a Small shoulder at the left side of the titanium dioxide’s oxygen 1s peak; this shoulder is related with hydroxyls bounded to titanium dioxide[24-26]. The differences on the intensity ratio of this shoulder to the principal peak of the different samples gives an estimate of the amount of hydroxyl species relative to each other. The O(1s) intensity ratio values of samples TiO2 -A, TiO2-N and TiO2-B shown in table 1, indicate a larger amount of hydroxyls in the acidic preparation of titanium dioxide. These active surface hydroxyl groups can increase the differences on the intensity ratio of this shoulder to the principal peak of the different samples giving an estimate of the amount of hydroxyl species relative to each other. The O(1s) intensity ratio values of samples TiO2-A, TiO2-N and TiO2-B are shown in table 1, showing a larger amount of hydroxyls in the acidic preparation of titanium dioxide. These active surface hydroxyl groups can increase the surface energy of the nanoparticles and become stable by easily combining with other atoms or groups. This may possibly result in lots of hydroxyl and adsorbed oxygen present at the surface of the nanoparticle. The surface oxygen deficiencies can act as capture centres for the photo-excited electrons, to efficiently hinder the recombination of electrons and holes. The surface hydroxyl groups can play an important role in the photocatalytic actions because the photo-induced holes can attack the surface hydroxyl and yield surface bound OH radicals with high oxidation capability.
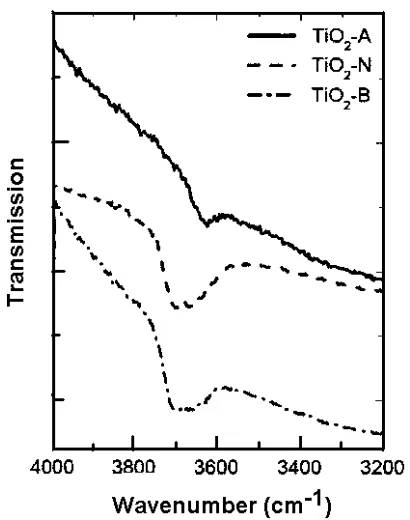
The DRIFTS spectra of the synthesized materials are shown in figure 4. Some differences are observed between the three samples frequency position and intensity. The Hydroxyls band of the acid prepared sample is around 3620cm-1, while in the case of neutral and basic preparation it appears as an extra band, which is around 3700cm-1.
Furthermore, the intensity of the hydroxyl band in the case of the neutral and basic preparations is smaller than in the case
of the acid preparation. This is in agreement with the results obtained in the analysis of the XPS measurements.
This relative determination of the amount of hydroxyls is relevant because it has been reported to play an important role in the photocatalytic processes [26].
Diffuse reflectance measurements in the UV-visible region allowed us to determine the band gap energy of the samples. The spectral dependence of the absorption coefficient (α) of a material is given by the spectral dependence of the absorbance (α ~ A). Besides, if we assume a direct band gap of both crystalline phases of titanium dioxide [27] , we can express the absorption coefficient with the following formula α hv ∝ (hv − Eg)1/2 as a function of the band gap energy (Eg) and the energy of the incident photon (hv). Therefore, the band gap energy can be determined by extrapolation to the energy axis of the linear interval in a plot (α hv)2
Synthesis of TiO2 Nano Powder by the Sol-Gel Method and Its Use as a Photocatalyst
vs. hv. The band gap energy values obtained in this way for the reference and synthesized materials are summarized in table 1, which shows that the band gap energy of the studied materials keep the following order Eg(R) < Eg(A) = Eg(N) <Eg(B). This order in the energy band gap values does not keep a relation with the reactivity observed for the set of samples. It means that despite TiO2-A and TiO2-N having the same band gap energy values (3.37 eV), the TiO2-A reduced NO with a yield of 100% while the yield of TiO2-N is only 25%.
Fig. 3. XPS measurements of samples TiO2-A and TiO2-N in the regions of Ti(2p) and O(1s) orbitals.
In fact the degradation of NO is an electron transport reaction. It means that when the energy is presented as a photon and exceeds the band gap, the electron leaves the valence band and goes to the conduction band. In this step surface hydroxyls attract electrons and use for the degradation
of NO. These surface groups have a main role rather than band gap. As can be seen from table 1 TiO2-A with the highest intensity of hydroxyls has the maximum yield (100%) in photocatalytic reaction.
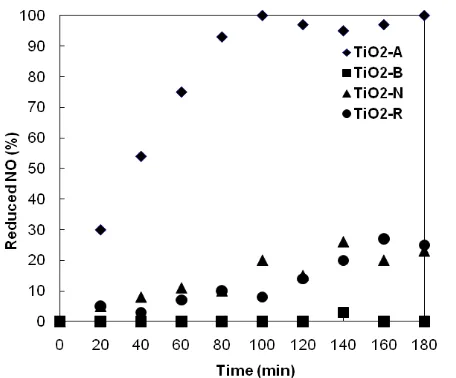
The test for photocatalytic activity carried out for nitric oxide reduction was monitored for 180 minutes (3 hours) and is shown in figure 5. It shows the decomposition percentage of the nitric oxide loaded into the reaction cell as a function of illumination time. As can be observed in this figure, titanium dioxide with a
Fig. 4. Infrared transmission spectra obtained from DRIFTS measurements, in the region of the absorption band of hydroxyl species.
Karami
Fig. 5. Profile of the percent of nitric oxide reduced monitored during 180 minutes of light exposure for photocatalytic evaluation.
Furthermore, sample TiO2-B is clearly ineffective for decomposition of NO during the monitored time interval. No conclusive evidence for energy band gap or hydroxyl content influence on the photocatalytic reactivity was found. The higher reactivity seems to be mostly related to the pure anatase phase of the sample and, second, with the nanometric size of the particles. These two properties have been previously pointed out as important factors for photocatalytic reactions by other authors[28,29]. Further work is under way to study the more detailed photocatalytic activity of the synthesized materials.
CONCLUSION
The nanoparticulated titanium dioxide with particle sizes between 12nm and 20nm have been successfully synthesized. Pure anatase titanium dioxide was also obtained by adjusting the gelling pH to a value of pH 3. This pH condition also leads to a surface area of 80m2/g, which is 50% higher than that of the commercial sample material. The test for photocatalytic activity showed that our synthesized materials have similar and even better photocatalytic reactivity than the reference material employed.
REFERENCES
[1] R. Birrnlyer, H. Gleiter, H.P. Klein, Phy. Lett. A 102 (1984) 365.
[2] H. Gleiter, Prog. Mater. Sci. 33 (1989) 223.
[3] P. Wauthoz, M. Ruwet, T. Machej, P. Grange, Appl. Catal. 69 (1999) 149.
[4] J. Zhang, T. Ayusawa, M. Minagawa, K. Kinugawa, H. Yamashita, M. Matsuoka, M. Anpo, J. Catal. 198 (2001)1.
[5] D.S. Bhatkhande, V.G. Pangarkar, A.A.C.M. Beenackers, J. Chem. Technol. Biot. 77 (2002) 102. [6] S. Malato, J. Blanco, A. Vidal, D. Alarcon, M.I.
Maldonado, J. Caceres, W. Gernjak, Solar Energy. 75 (2003) 329.
[7] N.L. Stock, J. Peller, K. Vinodgopal, P.V. Kamat, Environ. Sci. Technol. 34 (2000) 1747.
[8] L.B. Khalil, M.W. Rophael, W.E. Mourad, Appl. Catal. B. Environ. 36 (2002)125.
[9] M.M. Higarashi, W.E. Jardim, Catal. Today 76, (2002) 201.
[10] J. Zhao, X.D. Yang, Building and Environ. 38 (2003) 645.
[11] V. Mirkhani et al, J. Iran Chem. Soc. 6 (2009) 578 [12] J. Wang et al, J. Photochem.Photobio A: Chem. 180
(2006) 189.
[13] N. Venkatachalam et al, J. Mol. Cata A: Chem. 266 (2007) 158.
[14] A.S. Attar et al, Template-based Growth of TiO2 Nanorods by Sol-gel Process, First International Congress on Nanoscience and Nanotechnology, Tehran (Iran), 18-20 December 2006.
[15] N. Babaei et al, Preparation of TiO2/Al Nanocomposite Powders via the Ball milling, First International Congress on Nanoscience and Nanotechnology, Tehran (Iran), 18-20 December 2006.
[16] S.R. Ahmadi, N.Taghavinia, Tio2 Nanostructured Films on Mica and Glass Using Chemical Vapor Deposition, First International Congress on Nanoscience and Nanotechnology, Tehran (Iran), 18-20 December 18-2006.
Synthesis of TiO2 Nano Powder by the Sol-Gel Method and Its Use as a Photocatalyst
Microemulsion Method and Used for Oxygen Sensor, First International Congress on Nanoscience and Nanotechnology, Tehran (Iran), 18-20 December 2006. [18] H.D. Jang, S.K. Kim, S.J. Kim, J. Nanopart. Res. 3
(2001) 141.
[19] Scaflani, L. Palmisano, M. Schiavello, J. Phys. Chem. 94 (1990) 829.
[20] N. Venkatachalam, M. Palanichamy and V. Murugesan, J. Mol. Catal A. 273 (2007) 177.
[21] N. Venkatachalam, M. Palanichamy and V. Murugesan, Mat. Chem .Phys. 104 (2007) 454.
[22] B. Neppolian, Wang. H. Jung. Ultra. Sonochem. 15 (2008) 649.
[23] N.M. Rahman, K.M. Krishna, T. Soga, T. Jimbo, M. Umeno, J. Phys. Chem. Solids 60 (1999) 201–210. [24] Y.F. Gao, Y. Masuda, Z.F. Peng, T. Yonezawa, K.
Koumoto, J. Mater. Chem.13 (2003) 608.
[25] J.C. Yu, L.Z. Zhang, Z. Zheng, J.C. Zhao, Chem. Mater.15 (2003) 2280.
[26] L.Q. Jing, X.J. Sun, W.M. Cai, Z.L. Xu, Y.G. Du, H.G. Fu, J. Phys. Chem. Solids 64 (2003) 615.
[27] S.D. Mo, W.Y. Ching, Phys. Rev. B 51 (1995)13023. [28] L. Cao, Z. Gao, S.L. Suib, T.N. Obee, S.O. Hay, J.D.
Freihaut, J. Catal. 196 (2000) 253.