*Corresponding author: [email protected]
J.Food Pharm.Sci. 2 (2014) 79-82
Research Article
Simultaneous Determination Of Metamizole, Thiamin And Pyridoxin In
Multicomponent Tablet by RP-HPLC
Chusnul Chotimah
1,3, Sudjadi
1, Sugeng Riyanto
1and Abdul Rohman
1,2*1Department of Pharmaceutical Chemistry, Faculty of Pharmacy, Universitas Gadjah Mada, Yogyakarta 55281, Indonesia. 2Centre of Research for Fiqh Science and Technology (CFIRST), Universiti Teknologi Malaysia, Skudai, Malaysia.
3The National Agency of Drug and Food Control, district of Yogyakarta, Indonesia.
ARTICLE INFO ABSTRACT
Received 08/08/2014 Received in revised form 07/09/2014
Accepted15/09/2014 Available online 1/10/2014
The aim of the study was to develop and validate high performance liquid chromatography (HPLC) assay for the simultaneous determination of Metamizole, Thiamine and Pyridoxin in multicomponent tablet dosage form. The experimental procedure involved reversed-phase-HPLC with a Atlantis T3 C18 column μm particle size, . )D x mm , P)C
solution-metanol-acetic acid volumetric solution (700: 300 : 4, v/v/v) mobile phase, UV detection at 275 nm. The flow rate of the mobile phase was 1.2 mL/min. The method was validated with respect to specificity, precision, accuracy and linearity. Due to its simplicity and accuracy, the assay method is suitable for routine analysis of multiomponen tablet formulation.
Key words : metamizole, thiamine, pyridoxin, HPLC
1. Introduction
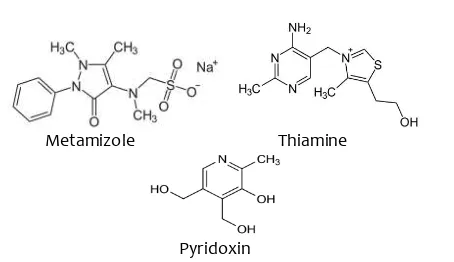
Metamizole (MET), Thiamine (B1) and Pyridoxin (B6)
are active pharmaceutical ingredients frequently combined and widely used to relieve pain complaints caused by neuritis and neuralgia, especially on severe pain (Indonesian Pharmacist Association, 2013). MET is pirazolon derivative having analgesic and antipiretic effects. It is commonly used to relieve acute pain (Zukowski and Kotfis, 2009). Thiamine and Pyridoxin are neurotropic vitamins which play an important role in formation of energy metabolism needed by brain cells. The combination of MET with vitamin B complex (ie. thiamine and pyridoxin) will increase the potential synergistic analgesic effect (Rosales et al., 2006). The chemical structure of MET, B1 and B6 are shown in Fig1.
Some analytical methods have been reported for determination of MET, B1 and B6, either alone or in
combination with other medicines in pharmaceutical products. Several analytical methods for determination MET such as electrochemical and electrophoretic (Basaez et al., 2008), reflectometric (Weinert et al., 2007), spectrophotometry (Salih and Al-Sharook, 2008), HPLC (Altun, 2002)and LC/MS for bioequivalence study
Metamizole Thiamine
Pyridoxin
Fig 1. The chemical structure of Metamizol, Thiamine1 and
Pyridoxin
(Shep et al., 2012). Furthermore several analytical methods of quantification B1 and B6 such as
densitometry and spectrophotometry multivariat (Elzanfaly et al., 2010), capilary zone electrophoresis (Franco et al., 2012), HPLC (Yantih, et al., 2011; USP, 2013) and LC/MS (Chen, et al., 2006). The combination of MET, B1 and B6 is commercially available in tablet dosage form
Chotimah C., Sudjadi, RiyantoS. and Rohman A., J.Food Pharm.Sci (2014), 79-82 80 The objective of this study was to develop and
validate a specific, accurate, precise HPLC method for simultaneous determination MET, B1 and B6 in
multicomponent tablet dosage form.
2. Material and method 2.1. Material
The standards of MET, B1 dan B6 were of reference
standard of Indonesian Pharmacopeia and were obtained from the National Agency of Drug and Food Control, Republic of Indonesia. The chemicals and reagents used were analytical grade. Methanol (HPLC grade, Merck), pentan sulphonic acid sodium salt (Merck), heptan sulphonic acid sodium salt (Merck), acetic acid (Merck) and bi-distillated water (Ikapharmindo) were used to prepare the dilute solution and mobile phase.
The tablet dosage form was obtained from pharmacy in Yogyakarta, labeled to contain 500 mg, 50 mg, 100 mg and 100 µg of MET, B1, B6 and B12 respectively
in each tablet.
2.2. Aparatus
The method development was performed with a LC system consisting of Shimadzu LC 20AD solvent delivery system, a SPD-M20A photo diode array detector and samples were injected with a 7725i Rheodyne injector system with a 20 µL sample loop. The assay were performed with another LC system consisting of Shimadzu LC 20 AD solvent delivery system, SPD 20A
uv/vis detector and SIL A autosampler using μL
sample loop. The detector was set at 275 nm.
Separation was carried out at ambient temperature using an Atlantis T3 C18colomn ( μm, x , mm I.D.,
Waters, Milford, USA). All the calculations of quantitative analysis were performed with external standarization by the measurement of peak area.
2.3. Method
2.3.1.Preparation dilute solution
Dilute solution were 0,5% acetic acid in water
2.3.2.Preparation of mobile phase
Prepare PIC solution by dissolving a mixture of 0.522 g pentane sulphonic acid sodium salt and 0.404 g heptane sulphonic acid sodium salt into bi-destilated water.
A mixture of PIC solution-Methanol-Acetic acid glacial (700:300:4) (v/v/v) was used for mobile phase. The mobile phase were filtered through a 0.45 µm milipore filter before use and degassed in an ultrasonic bath.
2.3.3.Standart stock solution and sample stock solution Standard stock solution composed of a mixture of 400 µg/mL MET, 40 µg/mL B1 and 80 µg/mL B6, while the
stock sample solution made by dissolving the sample in order to obtain the composition of μg/mL MET, 150
μg/mL B1 and μg/mL B6)
2.3.4.Working standart solution
Working standard solution was made by dissolving standard stock solution to obtain μg/mL MET,
μg/mL B1and μg/mL B6. Six replicate of μL injection
were made for system suitability test.
2.3.5.Sample solution preparation
Sample solutions were made by weighing tablets that have been crushed an equivalent to 10 mg MET, 1 mg B1 and 2 mg B6 in 50 mL volumetric flask and dilute
with acetic acid 0.5%. Then, the solution was shaken vigorously for 30 minutes. The solution was filtered using Whatman microfilter Ø 0,45µm, and supernatant was taken. Standart and sample solution were subjected to HPLC measurement as describe above. The concentration of DIP, B1 and B6 in tablet dosage forms
was calculated based on single point calibration. All determinations were performed six times.
3. Result and Discusion
Reference method of this study from NDFC 2001 namely methampiron assay in a mixed multicomponent tablet. Flow rate between 1 mL/min and 1.2 mL/min were studied. A flow rate 1.2 mL/min chosen because it provides good separation in reasonable time. The separation of MET, B1 and B6 shown in figure 2.
3.1. System Suitability Test (SST)
The performance qualification of HPLC was determined with the system suitability to verify system performance under actual running conditions with a well-characterized analyte mixture, column, and mobile phase. The evaluation of SST based on the value of relative standart deviation (RSD) of peak area and retention time, and it performed every time when the analysis was began.
The table 1 showed that RSD of retention time and peak area MET, B1 and B6 were lower than 2%, that means
performance of HPLC is good.
3.2. Specificity
ICH defines specificity as the ability to assess unequivocally the analyte in the presence of components which may be expected to be present.
specificity determination can be done by calculating the resolution and peak purity index values obtained using the PDA detector (Snyder et al., 1997, Ahuja and Dong, 2005).
In this study, the resolution of MET, B1 and B6 were
greater than 2 and peak purity index values were close to 1 as shown at Table 1, thus it can be concluded that the method is specific.
3.3. Precision
Chotimah C., Sudjadi, RiyantoS. and Rohman A., J.Food Pharm.Sci (2014), 79-82 81
ability of the method to analyze samples at the same operational conditions within a short time. Repeatibility should be assed using a minimum 9 determination covering the specified range for the procedure or a minimum of 6 determination at 100% of the test concentration.
Repeatibility test on this study done by determination 5 concentrations on 3 replicates each, and expressed by %RSD. The precision result shown at table 2. RSD concetration of MET, B1 and B6 at each
concentration were lower than 2%, so it can be concluded that the analytical method was precision.
3.4. Accuracy
Accuracy is a parameter to indicate the closeness between the values obtained with the true value, expressed in percent recovery. ICH recommends that the accuracy was done by 9 times assay at 3 different concentrations. In this study the accuracy performed at 5 concentrations by spiking method, namely by adding a certain amount of the standard solution to the sample solution from stock (2.3.3) with a ratio of 3 : 7.
The accuracy result shown at table 2. Recovery of MET, B1 and B6 were in the range of 98-102%, which
means that the method has good accuracy.
Fig 2. Chromatogram of the mixture of pyridoxine (Rt = 4.81), metamizole (Rt = 9.82) and Thiamine (Rt = 14.69). HPLC condition : coloumn: Waters, Atlantis T3, C-18, 150 x 4.6 mm, 5 µm; mobile phase : PIC solution : methanol : Acetic acid (700 : 300 : 4
v/v/v); flow rate : 1.2 mL/minute ; injection volume 20 µL ; detector 275 nm
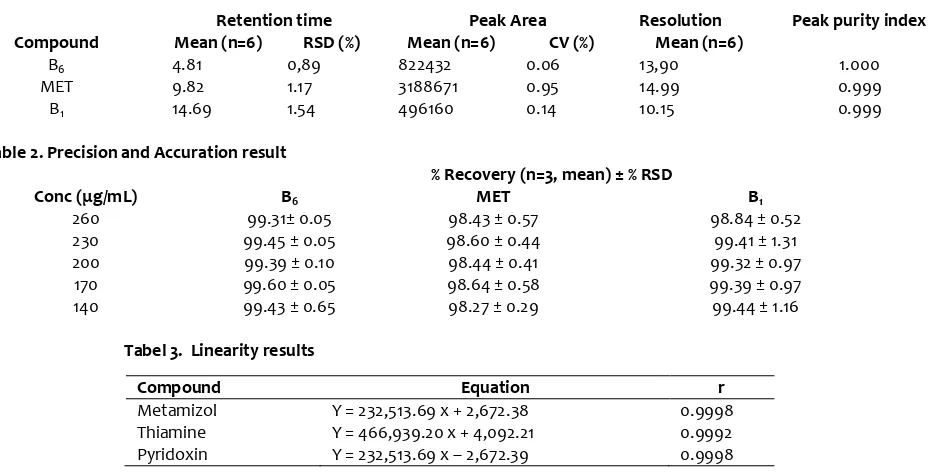
Table 1. performance parameters of Metamizole, Thiamin (B1) and Pyridoxin (B6) in system suitability test
Retention time Peak Area Resolution Peak purity index
Compound Mean (n=6) RSD (%) Mean (n=6) CV (%) Mean (n=6)
B6 4.81 0,89 822432 0.06 13,90 1.000
MET 9.82 1.17 3188671 0.95 14.99 0.999
B1 14.69 1.54 496160 0.14 10.15 0.999
Table 2. Precision and Accuration result
% Recovery (n=3, mean) ± % RSD
Conc μg/mL B6 MET B1
260 99.31± 0.05 98.43 ± 0.57 98.84 ± 0.52
230 99.45 ± 0.05 98.60 ± 0.44 99.41 ± 1.31
200 99.39 ± 0.10 98.44 ± 0.41 99.32 ± 0.97
170 99.60 ± 0.05 98.64 ± 0.58 99.39 ± 0.97
140 99.43 ± 0.65 98.27 ± 0.29 99.44 ± 1.16
Tabel 3. Linearity results
Compound Equation r
Metamizol Y = 232,513.69 x + 2,672.38 0.9998
Thiamine Y = 466,939.20 x + 4,092.21 0.9992
Pyridoxin Y = 232,513.69 x – 2,672.39 0.9998
Table 4. The level of Metamizole (MET), Thiamin (B1) and Pyridoxine (B6)of tablet dosage form obtained by HPLC and by uv
spectrophotometry in combination with PLS
Compound Concentration mg/tab (mean,n=6) ± %RSD
HPLC Uv-PLS
B6 98.96 ± 0.67 98.44 ± 1.66
MET 480.32 ± 0.76 482.15 ± 0.38
Chotimah C., Sudjadi, RiyantoS. and Rohman A., J.Food Pharm.Sci (2014), 79-82 82 3.5. Linearity
Linearity test conducted by injecting 5 series concentrations in the range 70-130% of the target concentration with 3 times replication. The response should be directly proportional to the concentrations of the analytes or proportional by means of a well-defined mathematical calculation.The linearity result shown at table 3.
The linearity result of MET, B1 and B6 showed that
coefficient correlation (r) greater than 0.999, so it can be stated that the method produces peak area that is proportional to the analyte concentration.
3.6. Samples analysis using HPLC
The results of determination MET, B1 and B6 in
tablet dosage form shown in the table 4, and when compared with the result of spectrophotometric method combined multivariate calibration patial least square (PLS) are not significantly different. Thus it can be concluded that both methods can be used to determination MET, B1 and B6 with precision and
accuracy as good.
4. Conclusion
The simultaneous determination of metamizol, thiamine and pyridoxin was performed on a C18 column
of (4.6x150mm) dimension and 5 μm of particle size. A mixture of PIC : Methanol : acetic acid (700 : 300 : 4) (v/v/v) as mobile phase with flow rate of 1.2 mL/minute and monitored at 275 nm. That method was simple, accurate, precise, and could be successfully applied for the analysis of metamizol, thiamine and pyridoxin in multicomponent tablet dosage form.
5. Acknowledgement
The authors thank to Faculty of Pharmacy, Gadjah Mada University for its financial support during this study. The National Agency of Drug and Food Control, district of Yogyakarta, Indonesia was acknowledged for providing uv-vis spectrophotometer and HPLC instrument make this research possible.
References
Ahuja, S. and Dong, M.W. 2005. Handbook of Pharmaceutical Analysis by HPLC. Volume 6. first edition. Elsevier Inc, United Kingdom. pp. 204-205.
Altun, M.L. 2002. HPLC Method for the Analysis of Paracetamol, Caffeine and Dipyrone. Turk. J. Chem. 26: 521-528.
Basaez, L., Peric, I.M, Jara, P.A., Soto, C.A., Contretas, D.R., Aguirre, C., et al. 2008. Electrochemical and electrophoretic study of Sodium metamizole. J. Chilean. Chem. Soc. 53: 1572-1575.
Chen, Z, Chen, B., Yao, S. 2006. High-performance liquid chromatography/electrospray ionization-mass spectrometry for simultaneous determination of
taurine and 10 water-soluble vitamins in multivitamin tablets, Anal. Chim. Acta, 569:169– 175.
Elzanfaly, E.S., Nebsen, M., Ramadan, N.K. 2010. Development and Validation of PCR, PLS and TLC Densitometric Methods for the simultaneous determination of vitamins B1, B6 and B12 in
pharmaceutical formulations. Pak. J. Pharm. Sci. 23: 409-415.
Franco, M, Jasionowska, R, Salvatore E. 2012. Application of CZE Method in Routine Analysis for Determination of B-Complex Vitamins in Pharmaceutical and Veterinary Preparations. Int. J. Anal. Chem. 2012: 1-7.
Indonesian Pharmacist Association (IPA). 2013. Informasi Spesialite Obat Indonesia. PT ISFI Penerbitan, Jakarta. pp 1-56.
International Conference on Harmonisation. 2005. Validation of Analytical Procedures: Text and Methodology.
National of Drug and Food testing Center of Republic Indonesia (NDFC RI) 2001. The Determination of Metampiron in multicomponen tablet dosage forms, code 28/OB/01
Rosales, E.T., Santillan, R.M., Garcia, G.R., Soto, V.G. 2006. Synergistic antiociceptive interaction berween acetaminophen or metamizol and vit B in the formalin test. Drug. Dev. Res., 66: 286. Salih, E.S., Al-Sharook, M.M. 2008. Spectrophotometric
Assay of Dipyrone in Pharmaceutical Preparations Via Oxidative Coupling Reaction with m-Toluidine and Potassium Hexacyanoferrate (III). J.Edu.& Sci. 21 : 36-45.
Shep, D., Ojha, R., Rathod, R., Patel, S., Nivsarkar, M., Maroo, S., Padh, H. 2012. Bioequivalence study of two oral formulations of metamizole 500 g in healthy volunteers. IJPSR. 3(6): 1749-1752.
Snyder, L.R., Kirkland, J.J., and Glajch, J.L. 1997. Practical HPLC Methode Development. 2nd Ed. John Wiley & Sons Inc, New York. pp. 695-702.
United State Pharmacopoeia. 2013. United State Pharmacopoieal Convention, 36th Ed. Inc, Rockvilie. pp. 983-988, 1795-1798.
Weinert, P.L., Pezza, Pezza, H.R. 2007. A Simplified Reflectometric Method for the Rapid Determination of Dipyrone in Pharmaceutical Formulations. J. Braz. Chem. Soc.18: 846-854. Yantih, N., Widowati, D., Wartini, Aryani, T. 2011.
Validation of HPLC method for determination of thiamine hidrochlorida, Riboflavin, Nicotinamide and Pytidoxine hydrochloride in syrup preparation. Can. J. Sci. Industrial Res. 2: 269-278. Zukowski, M., Kotfis, K. 2009. Safety of metamizol and