Prashant Bharadwaj is an assistant professor in the Department of Economics, University of California, San Diego. Leah K. Lakdawala is an assistant professor in the Department of Economics at Michigan State University. The authors thank Achyuta Adhvaryu, Sonia Bhalotra, Julie Cullen, Gordon Dahl, Gordon Hanson, James Fenske, Karthik Muralidharan, and Tavneet Suri for comments. Aprajit Mahajan was instrumental in helping us with the Reproductive and Child Health Surveys from India. The authors are also grateful to Dr. Matangi Bala and Dr. Ram Krishnamoorthi for patiently answering questions related to prenatal care. Karina Litvak provided excellent research assistance. They also thank the China Health and Nutrition Survey, funded by NIH (R01- HD30880, DK056350, and R01- HD38700), and the Carolina Population Center and the Chinese CDC for providing these data. The data used in this article can be ob-tained beginning July 2013 through June 2016 from Prashant Bharadwaj, prbharadwaj@ucsd.edu. Online Appendix tables can be found at dss.ucsd.edu / ~prbharadwaj.
[Submitted June 2011; accepted March 2012]
SSN 022 166X E ISSN 1548 8004 8 2013 2 by the Board of Regents of the University of Wisconsin System
T H E J O U R N A L O F H U M A N R E S O U R C E S • 48 • 1
Discrimination Begins in the Womb
Evidence of Sex- Selective
Prenatal Investments
Prashant Bharadwaj
Leah K. Lakdawala
A B S T R A C T
This paper investigates whether boys receive preferential prenatal treatment in a setting where son preference is present. Using micro health data from India, we highlight sex- selective prenatal investments as a new channel via which parents practice discriminatory behavior. We fi nd that mothers visit antenatal clinics and receive tetanus shots more frequently when pregnant with a boy. Preferential prenatal treatment of males is greater in regions known to have strong son preference and among women whose previous children are female. We address other mechanisms such as selective recall, medical complications that might cause male fetuses to receive greater prenatal care in general, son preference- based fertility stopping rules and biases due to sex- selective abortions. Our calculations suggest that sex- selective prenatal care in maternal tetanus vaccination explains between 2.6–7.2 percent of excess female neonatal mortality in India.
I. Introduction
The Journal of Human Resources 72
resulted in an estimated 30 to 70 million “missing” women in India and China alone. While one might expect economic growth to erode such discrimination, son preference (as evidenced by skewed sex ratios) has been persistent despite high growth rates in these countries (Gupta et al. 2003).
A large literature has tried to explain the skewed gender ratios through postbirth discrimination strategies. Some of the channels examined are (but not limited to) dif-ferential vaccination rates (Oster 2009), allocation of household resources (Pitt and Rosenzweig 1990), breastfeeding behavior (Jayachandran and Kuziemko 2011), and parental time allocation (Barcellos, Carvalho and Lleras- Muney 2010). The papers that do examine sex- based discrimination before birth focus on sex- selective abortions (Pörtner 2010; Meng 2010; Bhalotra and Cochrane 2010). However, an unanswered question in this literature is whether parents invest less in prenatal care when pregnant with a girl, while still carrying the fetus to term.1 Such discrimination can have
size-able consequences as prenatal care is an essential component of the overall health of the child.
Maternal inputs during pregnancy can affect important outcomes such as neonatal survival and birth weight (Gortmaker 1979; Bharadwaj and Eberhard 2010). In India, attending prenatal care is correlated with a 27 percent decrease in the probability of neonatal mortality (NFHS). Tetanus shots taken during pregnancy play a particularly important role in neonatal survival.2 Neonatal tetanus is the leading cause of
neona-tal deaths in India (Zupan and Aahman 2005; Gupta and Keyl 1998) and results in nearly 200,000 neonatal deaths per year in South and Southeast Asia (UNICEF 2000). About 38 percent of child (younger than fi ve years) deaths occur in the neonatal stage; moreover, prenatal care is highly correlated with postnatal care such as breastfeeding and immunizations (NFHS), indicating that discrimination faced in utero persists and perhaps accumulates even after birth. Early childhood health notwithstanding, we also know from previous research that in utero events and childhood endowments affect later life health, IQ and labor market outcomes (Almond and Mazumder 2005; Black, Devereux, and Salvanes 2007; Behrman and Rosenzweig 2004; Almond, Chay, and Lee 2002).
This paper examines whether sex- selective prenatal care occurs in countries of South and Southeast Asia, with an emphasis on India.3 We fi nd signifi cant differences
in women’s prenatal health care choices when they are pregnant with boys relative to when they are pregnant with girls. In India, women are 1.8 percentage points (3 percent over the mean) more likely to attend prenatal care at least twice when pregnant
1. Osmani and Sen (2003) examine fetal health in the context of sex- based discrimination; however, they do so from the channel of maternal health, and do not examine direct discrimination based on the sex of the fetus. 2. Blencowe et al. (2010) summarize decades of research on the importance of tetanus immunization during pregnancy by concluding that there is “clear evidence of the high impact of two doses of tetanus toxoid im-munization given at least four weeks apart on neonatal tetanus.” After examining fi eld studies that use various methods, they estimate that the decrease in tetanus- related neonatal morality due to vaccination is around 94 percent. Other estimates from developing countries range from 70 percent in rural Bangladesh to 88 percent in India (Rahman et al. 1982; Gupta and Keyl 1998).
Bharadwaj and Lakdawala 73
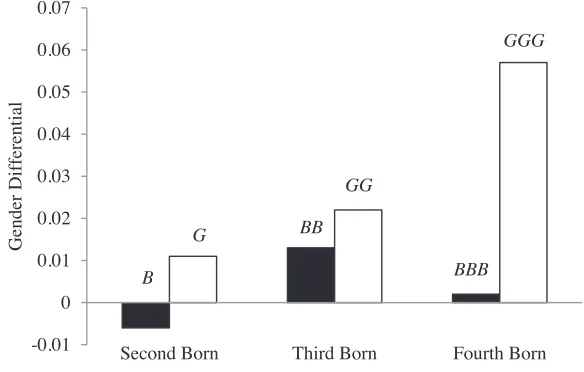
with a boy and receive a signifi cantly greater number of tetanus shots. In northern India, where sex discrimination is known to be more prevalent, women are 4.6 percent more likely to seek prenatal care and 3 percent more likely to receive tetanus shots if they are pregnant with a boy. In the same region, women are 16 percent more likely to deliver their baby in a nonhome environment if pregnant with a boy. We also fi nd that women whose previous children were mainly girls tend to discriminate more when the current fetus is male (see Figure 1). Moreover, for a subset of the Indian data, we
fi nd that prenatal discrimination occurs largely among mothers who report having received an ultrasound during pregnancy. We fi nd similar evidence in other countries of South and Southeast Asia where sex discrimination has been documented. For ex-ample, in China women pregnant with boys are 4.6 percentage points more likely to seek prenatal care. Mothers in Pakistan are 2.6 percentage points more likely to take iron supplements and mothers in Bangladesh attend prenatal care 7 percent more frequently when pregnant with a boy.
Apart from examining a new parental avenue for gender discrimination, we also bring new perspective to the vast literature on parental investments (Rosenzweig and Zhang 2009; Ashenfelter and Rouse 1998; Behrman, Rosenzweig, and Taubman 1994) that examines whether schooling or nutrition- based investments reinforce (or are
af--0.01 0 0.01 0.02 0.03 0.04 0.05 0.06 0.07
Second Born Third Born Fourth Born
Gender Differential
B
G BB
GG
BBB GGG
Figure 1
Gender Differentials in Prenatal Care, by Birth Parity and Sex Composition of Pre-vious Children
The Journal of Human Resources 74
fected by) the distribution of initial endowments. The notion of “initial endowments” is often related to birth weight (Loughran, Datar, and Kilburn 2004) or the residual of a human capital production function (Pitt and Rosenzweig 1990).4 Our paper adds to
the literature on parental investments by showing that initial endowments (even within families) are subject to preferences over gender. Thus, beyond the usual concerns with endogenous endowment formation like maternal behavior, genetic correlations, etc., we propose gender preferences as an additional channel for consideration when examining the impact of initial endowments on short- and long- term outcomes.
A common policy to mitigate sex discrimination is to prohibit health professionals from revealing the sex of the fetus during ultrasound exams, as India did in the mid-1990s. Despite the legal efforts of the government, sex- selective abortions have risen in recent years in India (Arnold, Kishor, and Roy 2002; Bhalotra and Cochrane 2010) and policy has focused on trying to eliminate it entirely; we make the point that even if all policy efforts were diverted to reduce the incidence of sex- selective abortions, an unintended consequence of such efforts could be a rise in differential investments in prenatal care.5 Our calculations suggest preferential treatment in one such investment,
tetanus shots, can explain 2.6–7.2 percent of the excess female neonatal mortality. Hence, if gender equality is a priority, policy must be concerned about the possibility of discriminatory prenatal care leading to long- term differences in the outcomes for men and women.
There are several identifi cation problems that arise in the analysis of sex- based discrimination. The four main problems we address are selective recall (a version of reporting bias in this context), biological characteristics of male fetuses that may drive the need for additional prenatal care, son preference- based fertility stopping rules, and sex- selective abortions. We discuss the problems raised by each and our solution to these issues in great detail in the subsequent section. To the extent we are able to test for potential biases in our data, our results appear to not be driven by these concerns.
II. Methodology and Estimation Issues
Papers examining son preference in the United States have studied the role of gender bias in differences in prenatal care (Dahl and Moretti 2008; Lhila and Simon 2008) using receipt of ultrasound scanning during pregnancy as indication that the parents know the sex of the child. Unfortunately, data on ultrasound receipt is inconsistent across the rounds of the National Fertility and Health Survey (for a select subset of the Indian sample we do have this information; we discuss the use of this data in detail in the results section). However, we rely on the idea that in the absence of son preference- based stopping rules, male- specifi c medical complications, sex- selective abortions or ultrasounds and other methods of sex determination, there should be no systematic reason to fi nd that males receive greater prenatal care. This
4. More recently, Aizer and Cunha (2010) measure initial endowment as scores from the Bailey test admin-istered to 8 month old babies.
Bharadwaj and Lakdawala 75
section describes our basic estimation strategy and outlines the various problems that could hinder inference as well as our attempt to deal with each potential source of bias.
A. Basic Specifi cation
Our strategy is built on the premise that under equal treatment or lack of knowledge of fetal gender, the pregnancy’s eventual gender outcome should not affect prenatal investments. To the best of our knowledge, doctor recommendations regarding basic prenatal investments like iron pills, tetanus shots, or regular prenatal checkups do not vary systematically by the gender of the child. Thus fi nding that antenatal visits, consumption of iron supplements, or tetanus shots are more likely during a pregnancy that results in a male is strong suggestive evidence of discrimination.
The empirical methodology this paper adopts is quite simple. If parents want to discriminate based on the sex of fetus, pregnancies that result in a male child should be pregnancies with greater observed prenatal care along various dimensions. The basic specifi cation we estimate is:
(1) Cihj = βMaleihj + ηXihj + Dj + εihj
where Cihj is the type of prenatal investment for child i in household h in state j such as prenatal care, iron pills, tetanus shots, etc. Maleihj takes the value of one when the child is male. The questions are retrospective, so the woman is asked about type of prenatal care received while pregnant with a given child and then that particular child’s sex is noted (more details concerning the survey data can be found in the next section).
Xihj is a host of control variables that include birth order, age and education of the mother, birth year fi xed effects, household wealth quintile fi xed effects, and a dummy for whether or not the mother resides in an urban area. Dj captures state fi xed effects. If prenatal sex discrimination exists and if males are favored, we should fi nd that β is greater than zero.6 Several important identifi cation issues emerge when following this
approach. We now review each problem and our proposed solutions in detail.
B. Son Preference- Based Fertility Stopping Rules
One potential source of bias in Equation 1 arises due to son preference- based stopping rules. A consequence of son preference- based fertility stopping rules is that the prob-ability the youngest child is male is increasing with the age of the last child, as parents have more time to adjust their total fertility following the birth (Barcellos, Carvalho, and Lleras- Muney 2010). Conditional on family size, this would imply that a family whose most recent birth was female would have weaker son preference even after
6. A related issue is that might vary depending on the sex ratio of the previous children. Due to son preference- based fertility stopping rules, “who” becomes a mother at each birth order is a selected sample. Suppose we restrict the sample to people whose previous children are all girls (conditional on family size).
Cihj = GMaleihj + Xihj + Dj + νihj
The coeffi cient we get on Male in this sample ( G) will likely be different from the coeffi cient on Male if we
were to estimate the above equation for families whose previous births are all male (call this M ). Hence, from Equation 1 should be interpreted as a weighted average of G and M , where the weights depend on the
The Journal of Human Resources 76
controlling for birth order and the existing sex ratio of the child’s siblings. Because the survey questions on prenatal care are asked only for the youngest child of the mother, our results are susceptible to bias due to such a stopping rule. As a robustness check, we employ the methodology developed in Barcellos, Carvalho, and Lleras- Muney (2010).
The main idea behind the Barcellos, Carvalho, and Lleras- Muney (2010) method-ology is to examine families where the last child is “young enough” such that par-ents have not had time to adjust their fertility based on the gender of the most recent birth—for this sample, parents who have just had a girl are similar to parents to have just had a boy, conditional on the sex ratio of the previous children and the number of children. However, the Barcellos, Carvalho, and Lleras- Muney (2010) methodol-ogy relies on the absence of sex- selective abortions. Nevertheless, we employ it as a robustness check and fi nd the estimates to be unchanged; if anything, the “young enough” sample results are slightly larger in magnitude than the overall sample results.
C. Sex- selective Abortions
The potential for sex- selective abortions brings about three additional concerns in our estimation: sample selection bias, reverse causality, and omitted variables bias. These concerns are certainly related, but dealing with each separately provides insight into various estimation techniques we use to account for these issues.
1. Sample Selection
Because we only observe the gender and prenatal care of pregnancies resulting in live births, our sample omits those female fetuses that were terminated before birth. This introduces bias into our estimates if those who abort female fetuses would have given their unborn daughters signifi cantly different levels of prenatal care if forced to take them to term than those who choose to take female fetuses to term. We believe that parents who perform sex- selective abortions are those for whom son preference (and female discrimination) is strongest; if these parents were forced to carry the female fetus to term, it is likely that these girls would receive less prenatal care than those born to parents who prefer to take their female pregnancies to term. Hence, we expect our results to be underestimates of the true extent of gender discrimination in prenatal care.
2. Reverse Causality
Bharadwaj and Lakdawala 77
be positive—when, in fact, prenatal care determines the gender of the children we observe in our sample.
Without information on the exact timing of ultrasound receipt in relation to subse-quent prenatal care (which is not available in the National Family Health Survey or the Reproductive and Child Health Survey), we are unable to isolate the direction of causation between the fi rst prenatal visit and fetal gender. However, we can identify the causal effect of fetal gender on additional prenatal care, conditional on knowing the gender of the child and choosing to take the pregnancy to full- term. If we assume that women who have been to at least one prenatal checkup know the sex of their unborn child, then their decision to pursue additional prenatal care is not subject to the same argument of reverse causality because they make these subsequent decisions after choosing not to abort their unborn child. In practice, we can restrict the estima-tion sample to those women who have gone to at least one prenatal visit (where we assume that they learned the sex of the child) and estimate the following regression:
(2) AdditionalCihj = βMaleihj + ηXihj + Dj + εihj
β now captures the gender differential in prenatal care that occurs after the fi rst checkup and is free of any reverse causality concerns. We can further restrict the sample to those women whose fi rst prenatal checkup occurred after the fi fth month of pregnancy and are thus the most likely to learn the sex of the fetus during the fi rst checkup. Note that this approach does not solve the problem related to sample selec-tion, and the possibility of sex- selective abortions still leads to a potential underesti-mate of the true extent sex- selective prenatal investments.
3. Other Omitted Variables
If we instead interpret the problem of sex- selective abortions as a case in which the propensity to perform selective abortions is an omitted variable in our regressions, we are left with the classic problem of endogeneity: The sex of the child is no longer random and is potentially correlated with εihj. In general, the direction of bias depends on the relationship between factors that infl uence sex- selective abortions and how these factors affect the demand for prenatal care. In our attempt to deal with this type of bias, we control for various factors like wealth and education, which might be im-portant determinants of sex- selective abortions. If abortions are costly, then including a control for family wealth is important, as wealthier families are both more likely to have a male child (by aborting female fetuses)7 and better able to afford prenatal care.8
Apart from wealth and education, we use three additional variables to address the possibility that sex- selective abortions are driving our results. First, the data from the 1998–99 round of the National Family Health Survey (NFHS) allow us to observe the
7. While the daily agricultural wage in India was around 57 rupees / day in 1998–99 (and also in 2000–2001), the cost of an abortion ranges from Rs. 500 (by makeshift midwives) to over Rs. 5000 when performed by a doctor. Because the wealth quintile calculated by DHS is nationally representative, we employ national sampling weights in all regressions that include wealth.
The Journal of Human Resources 78
abortion history of the mother (unfortunately, this information is not available in other rounds of the NFHS). Both types of abortions (induced and spontaneous) are recorded separately in the data. While there are likely to be measurement issues in abortion reporting, these data allows us to consider the “fraction of pregnancies aborted” as a measure for the propensity to sex- selectively abort, the omitted variable of concern. Note that while the fraction of induced abortions positively predicts the likelihood of observing a male birth, the fraction of spontaneous abortions negatively predicts male births (in regressions these are not statistically signifi cant). This is consistent with the notion that spontaneous abortions are biologically more likely to occur for male fetuses than for female fetuses, whereas induced abortions are more likely to refl ect sex- selective abortions. However, if mothers with a high probability of committing sex- selective abortions systematically underreport induced abortions, our results are still somewhat biased. This is certainly a caveat while interpreting these results. The second additional variable we include captures income shocks, proxied by rainfall shocks (measured at the state level and recorded as a 30 percent deviation from the historical mean) in the estimation. If income shocks determine both parents’ ability to control the gender of their child through sex- selective abortion (since abortion is an expensive procedure) and parents’ ability to invest in prenatal care, then controlling for income shocks will help account for this source of omitted variable bias. The fi nal variable we add is the gender of the fi rst- born child. Families where the fi rst- born child is male are less likely to pursue sex- selective abortions since the “need” for a boy is already fi lled (Pörtner 2010). Hence controlling for the gender of the fi rst- born is yet another way to control for the likelihood of sex- selectively aborting in future pregnancies.
If parental preferences over gender composition of children and factors that jointly determine sex- selective abortions and prenatal care are time- invariant, then a mother
fi xed effects specifi cation should be a robust way of countering the endogeneity con-cerns raised above. In some cases we have information on prenatal care for the pre-vious two births of the same woman. In this instance, we can test whether sons receive greater prenatal care using a mother fi xed effects specifi cation. The basic specifi cation in this case is:
(3) Cih = φMaleih + ηXih + Mh + εih
where Cih is the type of prenatal investment for child i born to a mother in household h. Maleih takes the value of one when the child is male, Xih consists of control vari-ables such as dummy varivari-ables for year of birth of the child, birth order, and the exist-ing sex ratio of children. Mih captures mother fi xed effects including time- invariant preferences for gender and prenatal care. If prenatal sex discrimination exists, we should fi nd that φ is greater than zero.
Bharadwaj and Lakdawala 79
rules in the mother effects specifi cations, we can condition on families where the fi rst born is male. Conditional on the gender of the fi rst born (specifi cally the fi rst born being male), subsequent birth outcomes are free from spacing or stopping rule bias.
However, a caveat is that the sample only includes mothers who have given birth
twice in the fi ve years prior to the survey. Hence, there might be some concerns with
drawing conclusions about the general population from this sample. These concerns are discussed in more detail in the results section.
D. Selective Recall
It is possible to fi nd a positive β if mothers are simply more likely to report receiving prenatal care when pregnant with a boy even if actual prenatal care is not gender- biased. If males are indeed preferred, then activities that led to a male birth might be better remembered. A similar issue arises if parents who have boys selectively report more prenatal care due to a social desirability bias towards boys. To counter these potential selective recall and reporting concerns we adopt two approaches. First, we rely on the timing of spread of ultrasound technology. Ultrasound availability in India is well documented. There are reports in India that the fi rst ultrasound clinic was opened in the Punjab in 1979 (Washington Post, May 2006), but widespread use of ultrasound was not achieved until the mid to late 1990s (Miller 2001; Bhalotra and Co-chrane 2010).9 The advent of ultrasounds, in particular portable sonogram machines,
has made sex determination less risky, easier to access, and less expensive (about $12 each, according to The Economist, March 2010). Anecdotal evidence suggests that even rural areas are visited by itinerant doctors who carry ultrasound machines from town to town, offering sex determination without offi cial prenatal care (New York
Times, May 2001).10 Thus, to tackle to issues of selective recall and reporting, we
estimate Equation 1 using the NFHS survey conducted in 1992, before ultrasounds spread to many regions in India. If mothers are no more likely to remember or report prenatal care when they deliver boys than when they deliver girls, we expect to fi nd that β is small and statistically insignifi cant for this sample.
A second approach is to exploit the timing of prenatal care. Sex determination is typically possible in the third or fourth month of pregnancy. In the absence of selective recall / reporting, we should fi nd that prenatal care taken early in the pregnancy before sex determination is possible does not systematically differ for female versus male fetuses. Thus, we would expect β to be small and statistically indistinguishable from zero for prenatal investments made during the fi rst four months of gestation.
Finally, if the social desirability bias for boys is stronger for some families, we would expect that these unobserved traits are constant within families. In this case, the
9. Prior to ultrasounds, sex determination was accomplished primarily through the use of amniocentesis, a more invasive procedure involving the removal of amniotic fl uid through a needle inserted into the maternal abdomen. For an excellent review on the timing of ultrasound technology spread, see Bhalotra and Cochrane (2010).
The Journal of Human Resources 80
mother fi xed effects specifi cation we employ should mitigate any remaining concerns with bias arising from selective reporting.
E. Medical Complications
It is possible that male fetuses simply require more prenatal care than female fetuses. Hence, a concern could be that medical reasons rather than gender discrimination drive parents to give more prenatal care to male fetuses than female fetuses. We at-tempt to rule out this alternate explanation by examining data on pregnancy complica-tions. The NFHS and RCH (Reproductive and Child Health Surveys) collect detailed data on pregnancy complications such as fatigue, night blindness, excessive bleeding, et cetera. Our concern would be mitigated if pregnancies that result in a male birth are not associated with signifi cantly more complications than those resulting in a female birth.
III. Data
The data on pregnancies and prenatal investments used in this paper come from a wide array of sources that vary by country. The Indian sample is cre-ated using the 1998–99 and 2005–2006 rounds of the National Family Health Survey (NFHS). In addition, we use two rounds of the Reproductive and Child Health (RCH) surveys from India to replicate our basic results.11 The RCH is a much larger database;
however, we do not use it as the basis for our main results for two important reasons. First, the use of the 1992 NFHS is important in establishing that our results are not seen at a time when ultrasound use was not as prevalent—the RCH only has data starting in 1998. Second, the RCH does not appear to collect information on wealth quintiles which is an important control variable in this case as wealthier people are perhaps more likely to obtain sex- selective abortions. Regardless, we use the RCH to show that our results are not simply an artifact of using the NFHS.
The Bangladeshi sample draws from four waves of the Demographic and Health Survey (DHS), including the 1996–97, 1999–2000, 2004, and 2007 rounds. The Chi-nese data come from the China Health and Nutrition Survey (CHNS), an ongoing project that collects panel data from nine provinces. For this paper, we use the 1991, 1993, 1997, 2000, 2004, and 2006 rounds. Additional robustness checks use samples drawn from other DHS rounds in Pakistan (2006–2007), Ghana (1993, 1998, 2003, 2008), Sri Lanka (1987) and Thailand (1987). The NFHS, RCH, and all DHS rounds are comprised of nationally representative samples with respect to each country. Ap-pendix Table A1 displays general descriptions of all samples used in this paper.
Although the data in the paper are collected from many different sources, the method of constructing the estimation samples is very similar across all countries. Within each country we use the sample of ever- married women generally between the ages of 15 and 49. Information is collected retrospectively about the pregnancy history of each woman, including detailed prenatal investment data from the most recent
Bharadwaj and Lakdawala 81
nancy previous to the survey. In the 1998 round of the NFHS, mothers report informa-tion about their two most recent pregnancies, allowing for the construcinforma-tion of a panel data set suitable for fi xed effects estimation (see previous section). We collect basic information such as age and educational attainment about mothers and wealth quintile of the family, as well as geographical data about their place of residence, which is used to generate the spatial fi xed- effects included in all subsequent regressions. Summary statistics for mother characteristics are presented in Appendix Table A2 for India (not shown for the remaining countries). Average educational attainment is generally low but displays considerable variation across countries. In India, the average mother in the sample is 28 years old and has completed only primary school.
With the exception of the fi xed effects specifi cations, we restrict our attention to the most recent birth previous to the survey. In order to obtain the most accurate informa-tion, we consider only those births that have occurred in the fi ve- year span leading up to the survey round. Appendix Table A2 indicates that about 55 percent of pregnancies are male in India. In countries with low or no son preference (Ghana, Sri Lanka, and Thailand), male pregnancies occur only 51 percent to 52 percent of the time; however, in countries with stronger son preference (China, Bangladesh, Pakistan), the ratio is generally higher, with 56 percent of Chinese pregnancies resulting in a live birth be-ing male.12 We focus our attention on the following measures of prenatal investments,
although not all variables are available for all rounds in all countries: prenatal care and the number of visits, tetanus shots received, iron supplements taken during pregnancy, and whether the mother chose to deliver her child in a health facility or at home. Ap-pendix Table A2 displays the summary statistics for these outcomes of interest and means of dependent variables are presented in each table. Prenatal care and receipt of tetanus shots is fairly common, occurring in about 72 percent and 78 percent of pregnancies in India, respectively. However, Indian women choose to give birth in a nonhome facility for only 35 percent of pregnancies. Online Appendix Table A1 details the loss in number of observations due to missing control variables or due to lack of questions appearing in certain surveys.
IV. Results
Table 1 estimates the simple specifi cation as in Equation 1 with se-quential addition of variables in Columns 1–5 using “at least two prenatal visits” as the dependent variable. We examine other dependent variables in subsequent tables. Since we rely on this dependent variable to deal with the possibility of sex- selective abortion via reverse causality (we do not have the timing of other variables for ex-ample), this is our main outcome variable of choice. The coeffi cient on male drops from 0.024 to 0.018 when all control variables are added. While this difference is not statistically signifi cant, it is important to note that mother’s characteristics and household wealth might be correlated with omitted variables like the propensity to sex- selectively abort, while also infl uencing the outcome variable. This is one reason
T
Prenatal Investments and Gender of the Child
Dependent Variable: Mother Attends at Least Two Prenatal Checkup during Pregnancy (1=Yes, 0=No)
No
Male 0.024*** 0.025*** 0.023*** 0.020*** 0.018*** 0.029*** 0.021** 0.530** 0.117* (0.007) (0.006) (0.006) (0.006) (0.006) (0.011) (0.008) (0.223) (0.061) Urban 0.167*** 0.149*** 0.096*** 0.044*** 0.076*** 0.041*** 0.792** 0.341***
(0.007) (0.007) (0.007) (0.008) (0.016) (0.011) (0.325) (0.112) Birth order –0.045*** –0.038*** –0.033*** –0.035*** –0.029*** –0.158* –0.153***
(0.002) (0.002) (0.002) (0.004) (0.004) (0.095) (0.025) Existing sex ratio of children –0.030*** –0.026*** –0.023*** –0.010 –0.086** –0.000 –0.062
(0.007) (0.007) (0.007) (0.014) (0.042) (0.259) (0.082) Mother’s age 0.004*** 0.003*** 0.006*** 0.004*** 0.029 0.029***
(0.001) (0.001) (0.001) (0.001) (0.028) (0.009) Mother’s education 0.099*** 0.067*** 0.071*** 0.067*** 0.433*** 0.220***
Bha
ra
dw
aj
a
nd L
akda
w
al
a
83
Family wealth is in second quintile 0.052*** 0.070*** 0.060*** –0.605 0.057 (0.009) (0.019) (0.013) (0.411) (0.083) Family wealth is in third quintile 0.110*** 0.115*** 0.114*** 0.157 0.251***
(0.009) (0.020) (0.014) (0.414) (0.093) Family wealth is in fourth quintile 0.162*** 0.228*** 0.163*** 0.413 0.444***
(0.010) (0.021) (0.016) (0.439) (0.116) Family wealth is in fi fth quintile 0.215*** 0.292*** 0.213*** 0.896* 0.878***
(0.012) (0.025) (0.018) (0.482) (0.195) Constant 0.597*** 0.779*** 1.059*** 0.828*** 0.738*** 0.477*** 0.334*** 3.184*** 2.388***
(0.005) (0.012) (0.174) (0.166) (0.171) (0.058) (0.039) (1.086) (0.300) Mean of dependent variable 0.610 0.610 0.610 0.610 0.610 0.521 0.628 0.959 0.868
State fi xed effects No Yes Yes Yes Yes Yes Yes Yes Yes
Year fi xed effects No Yes Yes Yes Yes Yes Yes Yes Yes
Birth year fi xed effects No No Yes Yes Yes Yes Yes Yes Yes
Dummy variable for each house-hold wealth quintile
No No No No Yes Yes Yes Yes Yes
Observations 32,012 32,012 32,012 32,012 32,012 8,304 14,302 5,171 16,870
R- squared 0.001 0.269 0.294 0.324 0.335 0.314 0.336 — —
Robust standard errors in parentheses *** p<0.01, ** p<0.05, * p<0.1
The Journal of Human Resources 84
why the addition of these control variables infl uences the magnitude of the coeffi cient on male.13
When we restrict the analysis to the northern region of India in Column 6 (Punjab, Haryana, Himachal Pradesh, Uttar Pradesh, and Rajasthan), we see a much larger magnitude of discrimination; mothers pregnant with boys in North Indian states are nearly three percentage points more likely to attend prenatal care at least twice (as op-posed to 1.8 percentage points for the country as a whole). This is consistent with other studies that fi nd more skewed sex ratios in these regions (Jha et al. 2006), suggesting higher levels of son preference as well as greater availability of ultrasound technology (as noted earlier, Punjab was one of the fi rst states to receive this technology).14 We
see slightly larger magnitudes (compared to the full sample) for samples where the previous children of the women are majority female (the children prior to the latest birth), although the differences in magnitudes in this sample relative to those in the full sample are not signifi cant (comparing Columns 7 and 5). If son preference is present, we should fi nd that samples where women previously have had female children should be even more likely to differentially invest if their most recent pregnancy is a boy. For this sample of majority female in the past children of the mother, we fi nd that mothers pregnant with a boy are 2.1 percentage points more likely to attend prenatal care two times or more (also see Figure 1). Hence, for India, we fi nd strong, consistent evidence that women utilize more prenatal care when pregnant with a boy than when they are pregnant with a girl.
Columns 8 and 9 break the sample up by ultrasound receipt. Because receipt of ultrasound is important to understand the results, we examine this in detail in Table 2, along with another prenatal care outcome of tetanus shots. As mentioned earlier, we have ultrasound receipt information for a subset of the Indian sample. While the 2005– 2006 round asks about ultrasound usage during each pregnancy in the past fi ve years, the 1998–99 round only asks about ultrasound usage among the sample of women who had at least one prenatal checkup. Having ultrasound receipt information is critical to our work as ultrasounds are a likely necessity to know the sex of the child. In order to make the samples comparable, we fi rst pool the surveys and restrict the sample to those women who had at least one prenatal checkup. Within this sample, we examine whether mothers pregnant with males and receiving ultrasounds visit prenatal clinics multiple times. Because this sample of women are those who have already attended a prenatal checkup, they are the most likely to pursue additional prenatal care. Ac-cordingly, the high sample means of these outcomes (often as high as 95–98 percent) lead us to believe that an extreme value distribution is more appropriate and thus we employ Logit specifi cations when using this sample.
Table 2 Panel A fi nds that women pregnant with males are more likely to make mul-tiple prenatal visits when an ultrasound is received. They are also more likely to receive a tetanus shot when they report having had an ultrasound, although this is statistically
Bha
Sex- Selective Prenatal Investments in India: Births to Women with and without Ultrasounds (Logit specifi cation)
Full Sample Northern Region Majority Female
At Least Two women who had at least one prenatal check up
Male 0.530** 0.117* 0.170 0.041 0.692** 0.080 0.938** 0.110 0.589* 0.085 0.673** 0.106 (0.223) (0.061) (0.233) (0.080) (0.299) (0.118) (0.396) (0.153) (0.314) (0.094) (0.314) (0.123) Constant 3.184*** 2.388*** 5.517*** 2.292*** 2.226 0.362 5.690*** 1.809** 6.865*** 2.161*** 3.548*** 1.302**
(1.086) (0.300) (1.137) (0.307) (1.441) (0.575) (1.852) (0.822) (1.574) (0.404) (1.364) (0.526)
P- value of the test that the coeffi cient on male is the same in the with and without ultrasound samples
0.074 0.600 0.057 0.051 0.152 0.093
Mean of dependent variable 0.963 0.868 0.974 0.938 0.950 0.844 0.971 0.923 0.964 0.872 0.975 0.941
State fi xed effects Yes Yes Yes Yes Yes Yes Yes Yes Yes Yes Yes Yes
Year fi xed effects Yes Yes Yes Yes Yes Yes Yes Yes Yes Yes Yes Yes
Birth year fi xed effects Yes Yes Yes Yes Yes Yes Yes Yes Yes Yes Yes Yes
Observations 5,171 16,870 5,970 16,891 1,605 3,772 1,542 3,785 2,226 7,522 2,541 7,542
Robust standard errors in parentheses *** p<0.01, ** p<0.05, * p<0.1
T
Sex- Selective Prenatal Investments in India: Births to Women with and without Ultrasounds (Logit specifi cation)
Full Sample Northern Region Majority Female
At Least Two
Male 0.479** 0.036 0.075 0.058 0.675** 0.064 0.729* 0.125 0.351 –0.015 0.376 0.047 (0.213) (0.053) (0.245) (0.058) (0.318) (0.093) (0.401) (0.099) (0.289) (0.082) (0.334) (0.090) Constant 4.500*** 1.292*** 3.055*** 1.887*** 0.937 –1.399*** 3.841** 0.500 4.635*** 0.929** 2.310 1.377**
(1.029) (0.266) (0.996) (0.309) (1.344) (0.411) (1.699) (0.457) (1.129) (0.431) (1.597) (0.554)
P- value of the test that the coeffi cient on male is the same in the with and without ultrasound samples
0.043 0.946 0.065 0.143 0.224 0.093
Mean of dependent variable 0.947 0.555 0.971 0.761 0.944 0.574 0.971 0.685 0.948 0.567 0.970 0.776
State fi xed effects Yes Yes Yes Yes Yes Yes Yes Yes Yes Yes Yes Yes
Year fi xed effects Yes Yes Yes Yes Yes Yes Yes Yes Yes Yes Yes Yes
Birth year fi xed effects Yes Yes Yes Yes Yes Yes Yes Yes Yes Yes Yes Yes
Observations 4,557 13,138 4,759 13,164 1,240 3,035 1,249 3,044 2074 5701 2083 5716
Robust standard errors in parentheses *** p<0.01, ** p<0.05, * p<0.1
Bharadwaj and Lakdawala 87
signifi cant only for the northern region and for the sample whose previous children are mainly female. These results stand in contrast to those for women who do not receive ultrasounds and are therefore unlikely to know the sex of their unborn child. With the exception of tetanus shots in the full sample, women who do not report receiving ultrasounds do not systematically discriminate in favor of male fetuses. The differences in coeffi cients on the male dummy variable in the two samples (those with and without ultrasounds) are statistically signifi cant across all specifi cations, with the exception of tetanus in the full sample and antenatal visits in the majority female sample.
Panel B examines all births in the 2005–2006 survey (because ultrasound informa-tion was asked of everyone, not just mothers who had a prenatal checkup). We use similar outcome measures as Panel A to keep matters consistent, but also because a very large fraction of those who report having had an ultrasound also report having attended prenatal care at least once (98.75 percent). Panel B is also consistent with our results so far, showing that women who receive ultrasounds take differentially better care of their male fetuses (although the results for the sample with majority female are not statistically signifi cant). In the samples of women who did not receive an ultrasound during their pregnancies, we fi nd no evidence of gender discrimination in prenatal care, although the difference in coeffi cients across the ultrasound and non-ultrasound samples is statistically signifi cant only for antenatal checkups in the full and northern samples.
However, there are several important caveats with using the ultrasound data. First, the ultrasound variable is likely to be measured with noise. Given the illegality of sex determination, many women may be reluctant to admit that they have received an ultrasound during their pregnancy. Moreover, as discussed in an earlier section, ultrasound technology has become available even through unoffi cial channels. Women who determine the sex of their baby without having to engage in formal prenatal care may be less likely to recall or report that they have received an ultrasound. For both of these reasons, we might expect the proportion of our sample who actually received ultrasounds to be much higher than the 14 percent and 27 percent reported in the 1998–99 and 2005–2006 rounds of the NFHS, respectively.
Next, we explore whether our results hold when we examine various subsamples to account for behaviors like son preference- based stopping rules, sex- selective abortion, selective recall, and medical complications. Using the same outcome variable as in Table 1 (more than two prenatal checkups), we fi rst examine whether son preference stopping rules might bias our results. As explained in Section II, following Barcel-los, Carvalho, and Lleras- Muney (2010) we restrict the sample to families where the youngest child is less than two years old at the time of the survey to minimize the bias due to families adjusting their fertility after realizing the sex of the child. Column 1 of Table 3 shows that even under this restriction, we see a gender gap in prenatal care outcomes. Under a more severe restriction of examining children younger than one, we still fi nd the presence of a gender gap, and in fact the magnitudes are larger for this subsample (although not statistically different from the magnitudes observed for the larger population). One drawback of this method is that it relies on the assumption of no sex- selective abortions. We can examine these age cutoffs further in samples where we deal with sex- selective abortions and show that our results still hold (Online Appendix Table A8).
T
he
J
ourna
l of H
um
an Re
sourc
es
88
Table 3
Accounting for Stopping Rules and Reverse Causality Due to Sex- Selective Abortions
Dependent Variable: Mother Attends at Least Two Prenatal Checkups (1=Yes, 0=No)
Children Ages Two Years or Less
(1)
Children Ages One Year or Less
(2)
Conditional on at Least One Visit
(3)
Conditional on at Least One Visit (First
Visit in Final Five Months of Pregnancy)
(4)
Mother Fixed Effects
(5)
Male 0.022*** 0.030*** 0.013** 0.027** 0.029***
(0.008) (0.011) (0.005) (0.011) (0.010)
Mean of dependent variable 0.602 0.597 0.889 0.813 0.593
State fi xed effects Yes Yes Yes Yes Yes
Year fi xed effects Yes Yes Yes Yes Yes
birth year fi xed effects Yes Yes Yes Yes Yes
Dummy variable for each household wealth quintile
Yes Yes Yes Yes Yes
Observations 18,058 9,247 22,983 7,547 2,692
R- squared 0.337 0.338 0.091 0.082 0.017
Robust standard errors in parentheses *** p<0.01, ** p<0.05, * p<0.1
Bharadwaj and Lakdawala 89
There are two main issues when examining sex- selective abortions in this context. First, to deal with the possibility of reverse causality, we look for a gender gap in prenatal care after an initial visit to prenatal care is completed. If mothers learn the sex of their child during the fi rst prenatal visit and choose to abort female fetuses, then we would fi nd a mechanical correlation between prenatal care visits (particularly in the case of greater than two prenatal care visits) and sex of the child due to sex- selective abortions, rather than due to sex- selective prenatal care. Column 3 of Table 3 shows that even in this sample (in which reverse causation is highly unlikely) there remains a sizable gender gap in prenatal care undertaken after the fi rst visit. Moreover, when we take an even more conservative approach by restricting the sample to women who make their fi rst prenatal visit in the fi nal fi ve months of pregnancy (for whom the as-sumption of discovering the sex of the child during the fi rst visit is most credible), we
fi nd that there remains a high degree of gender discrimination in prenatal care.15 If we
consider the coeffi cient on male from Table 1 Column 5 to include a “sex- selective abortion” effect and a “gender- discrimination effect,” then the results from Table 3, Column 3 likely refl ects just the discrimination effect. Unfortunately, the results from Table 3, Column 3 and 4 do not provide a clear direction regarding the sign of the bias due to sex- selective abortion. The larger point however, is that these results are not entirely different from the results for the main sample. Hence, it would appear that reverse causality is not a big concern here.
If we consider the factors or characteristics correlated with sex- selective abortions to be time- invariant, then a mother fi xed effects approach is another way of dealing with omitted variables bias (see Section II for a discussion on this). Table 3, Column 5 estimates the fi xed effects specifi cation in Equation 3 for India where we have data on the previous two births of the mothers. We fi nd similarly consistent results with this specifi cation. Even within families, mothers appear to make more investments when pregnant with a boy as opposed to a girl. Compared with the estimates of Table 1, the
fi xed effects estimates are slightly larger in magnitude, although the samples are not the same (the mother fi xed effects sample contains mothers who gave birth twice in the
fi ve years prior to the survey in 1998). For the same sample, however, OLS estimates yield similar results suggesting the role of mother level unobservables to be quite small. Mothers are 2.9 percentage points more likely to visit prenatal care at least twice when pregnant with a boy. An issue with the mother fi xed effects estimates is that spac-ing might be endogenous and is precisely time- varyspac-ing. Thus, the mother fi xed effects results might still be biased. To account for endogenous spacing issues, we conducted tests where we restricted the sample to mothers where the fi rst born was male and our results hold even for this sample (results not shown, available upon request).
An important caveat here is that the sample size is quite small. Moreover, the sample consists of mothers who gave birth twice in the fi ve years prior to the survey and have children of differing gender. Hence, we urge some caution while extrapolating these results to the general population.16
We also use three additional control variables to examine the possibility of sex-
15. We also show that the results hold when we change the outcome variable to “at least three prenatal visits” or “at least four prenatal visits”, et cetera. (Online Appendix Table 9).
The Journal of Human Resources 90
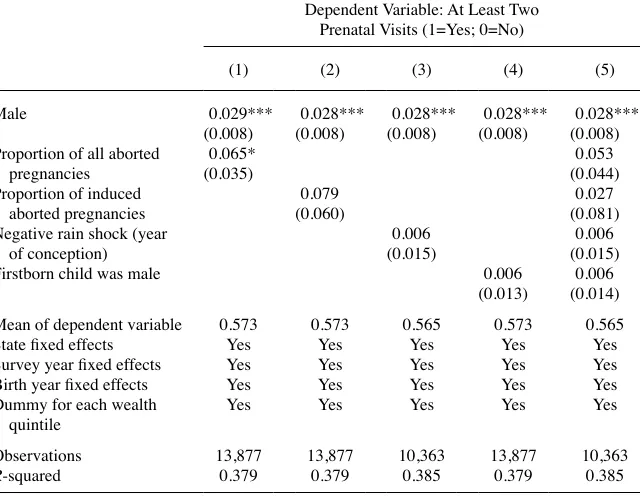
selective abortions driving our results. These controls are the fraction of pregnancies ending in an abortion, rainfall shocks and gender of the fi rst born child. Table 4 shows the results for outcome variable of at least two prenatal visits as in the previous tables. Columns 1 through 5 show that the addition of these controls does not alter the main
fi ndings.17 The data used for this table only uses the 1998–99 survey round as
ques-tions related to aborques-tions were not asked in subsequent rounds of the NFHS.
In Table 5, we examine whether our results suffer from recall bias. If mothers
examine an even smaller sample. For consistency, including this variable does not change the import of our results. However, for some of the outcome variables examined, we lose precision of the estimates. 17. We examine other prenatal care outcomes with these additional control variables in Appendix Table A2.
Table 4
Accounting for Sex- selective Abortions
Dependent Variable: At Least Two Prenatal Visits (1=Yes; 0=No)
(1) (2) (3) (4) (5)
Male 0.029*** 0.028*** 0.028*** 0.028*** 0.028***
(0.008) (0.008) (0.008) (0.008) (0.008) Proportion of all aborted
pregnancies
0.065* 0.053
(0.035) (0.044)
Proportion of induced aborted pregnancies
0.079 0.027
(0.060) (0.081)
Negative rain shock (year of conception)
0.006 0.006
(0.015) (0.015)
Firstborn child was male 0.006 0.006
(0.013) (0.014)
Mean of dependent variable 0.573 0.573 0.565 0.573 0.565
State fi xed effects Yes Yes Yes Yes Yes
Survey year fi xed effects Yes Yes Yes Yes Yes
Birth year fi xed effects Yes Yes Yes Yes Yes
Dummy for each wealth quintile
Yes Yes Yes Yes Yes
Observations 13,877 13,877 10,363 13,877 10,363
R- squared 0.379 0.379 0.385 0.379 0.385
Robust standard errors in parentheses *** p<0.01, ** p<0.05, * p<0.1
Bha
ra
dw
aj
a
nd L
akda
w
al
a
91
Table 5
Sex- Selective Prenatal Investments in India: Pre- ultrasound Period (births in 1992 and earlier)
At Least Two Visits (1=Yes, 0=No)
(1)
Prenatal Care (1=Yes, 0=No)
(2)
Number of Prenatal
Visits (3)
Tetanus Shot (1=Yes, 0=No)
(4)
Number of Tetanus
Shots (5)
Iron Pills (1=Yes, 0=No)
(6)
Nonhome Delivery (1=Yes, 0=No)
(7)
Male 0.003 0.005 0.046 0.008 0.027 0.017** 0.004
(0.008) (0.008) (0.033) (0.008) (0.020) (0.008) (0.006)
Mean of dependent variable
0.549 0.457 2.077 0.598 1.354 0.509 0.189
Observations 16,998 16,970 16,130 16,879 16,919 16,957 16,998
R- squared 0.301 0.279 371 0.263 0.249 0.264 0.311
Robust standard errors in parentheses *** p<0.01, ** p<0.05, * p<0.1
The Journal of Human Resources 92
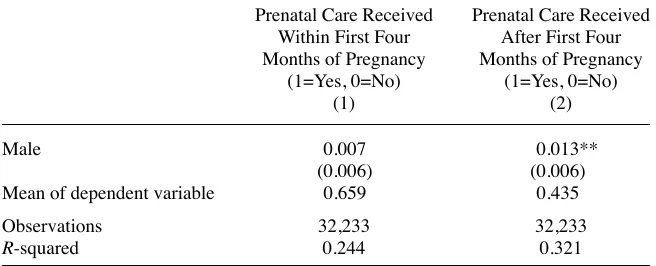
simply report having taken better prenatal care for males due to some sort of recall bias, then results using data from a time when ultrasounds were not widespread should also show males receiving greater prenatal care. For a wide range of prenatal care outcomes, we show that there does not appear to be a gender gap for births occurring between 1987 and 1992. If we test for an overall gender gap in prenatal care using an aggregated measure across all binary outcome measures (following Kling, Liebman, and Katz 2007), we fi nd that males born in 1992 and earlier are 0.004 percentage points less likely to receive any care although this aggregate effect is not statistically signifi cant (p- value 0.677). As mentioned earlier, ultrasound technology appears to have become widespread in the 1990s. Under selective recall, we should fi nd mothers reporting greater prenatal care for male babies even in the absence of ultrasound re-ceipt. Another way to rule out the possibility of selective recall is to examine prenatal care outcomes that occur before fetal gender is detectable. In Table 6 we exploit the timing of the fi rst prenatal checkup and show that there is no gender gap in prenatal care that occurs within the fi rst four months of pregnancy, when the sex of the fetus is unknown. In contrast, there is a large and signifi cant gap in care that takes place in the
fi nal fi ve months of pregnancy. Here we assume that the sex of the fetus is not known during the fi rst four months of pregnancy, however, the fi ndings presented in this table are robust to a range of different timing assumptions. For example, fetal gender does not predict prenatal care within the fi rst two or three months, when it is extremely un-likely that a mother knows the gender of her baby. Thus we believe that the existence
Table 6
Sex- Selective Prenatal Investments in India: Timing of Prenatal Care
Prenatal Care Received Within First Four Months of Pregnancy
(1=Yes, 0=No) (1)
Prenatal Care Received After First Four Months of Pregnancy
(1=Yes, 0=No) (2)
Male 0.007 0.013**
(0.006) (0.006)
Mean of dependent variable 0.659 0.435
Observations 32,233 32,233
R- squared 0.244 0.321
Robust standard errors in parentheses *** p<0.01, ** p<0.05, * p<0.1
Notes: Sample is restricted to most recent birth of ever- married women (ages 15–49) within fi ve years pre-vious to survey. Receiving prenatal care after four months of pregnancy is defi ned as one if women make their fi rst prenatal visit after four months of pregnancy or if they make their fi rst prenatal visit during the
Bharadwaj and Lakdawala 93
of selective recall cannot explain this pattern of discrimination in our results, even within the same pregnancy.18
Finally, we estimate whether being pregnant with a boy leads to more complications during the pregnancy. If carrying a male were more physically taxing than carrying a girl, then we might fi nd that women pregnant with boys are more likely to seek prenatal care for reasons other than gender discrimination. In Table 7 we estimate whether being pregnant with a boy is signifi cantly related to complications during pregnancy in India.19 Except for the category of “night blindness” we do not fi nd any
evidence to support the idea that male fetuses medically require greater prenatal care through increased complications. Moreover, the size of the coeffi cient on night blind-ness is extremely small compared to the average level of night blindblind-ness experienced by mothers in the sample.20
A. Evidence from Other Countries
Since the DHS collects extensive prenatal care data, we can extend our analysis to other countries in South and Southeast Asia.21 We estimate Equation 1 for China,
Bangladesh, and Pakistan. These are countries where son preference and gender dis-crimination has been well established in previous studies (Gupta et al. 2003). We fi nd that the gender bias in prenatal care is not limited to India but is pervasive in Southeast Asian countries with a history of son preference. As part of a larger robustness check, we estimate Equation 1 for Sri Lanka and Thailand where son preference is weak (Arnold, Kishor, and Roy 2002; Hua 2001; Prachuabmoh, Knodel, and Alers 1974). Finally, we investigate whether sex- selective prenatal care is practiced in Ghana, a country with no known son preference (Garg and Morduch 1998).
A caveat while interpreting these results is that, with the exception of China, we were not able to obtain very detailed information on aspects such as access to ultra-sound, or the extent of sex- selective abortion (the Chinese case is well documented in Meng 2010). In the case of Pakistan, while sociological surveys by Zubair et al. (2006) suggest that the extent of sex- selective abortions in Pakistan is quite low, Miller (2001) suggests the opposite. However, both papers suggest rather widespread access and use of ultrasound technology beginning in the mid-1990s for the use of fetal sex
18. While we lack data on the timing of prenatal visits after the fi rst, the outcome for Column 2 of Table 6 is constructed using information on the timing of the fi rst visit and the total number of prenatal visits. See the notes to the table for a detailed description of how this variable is constructed.
19. Appendix Table A6 replicates these estimates using the RCH. The results are very similar.
20. A concern might be that if women carrying male fetuses do need greater prenatal care, then perhaps Table 7 does not refl ect differential complications by male because mothers take greater prenatal care while pregnant with a male. We rule out this possibility by showing that for the sample that does not receive any prenatal care, we fi nd that carrying a male child does not lead to more complications (table not shown, available upon request). The other category that shows up signifi cant in this regression is anemia. However, the sign on this is negative, suggesting that mothers when carrying a male do more things to avoid becom-ing anemic—a common way to do this is to take iron pills. This is consistent with the fi nding that mothers practice greater prenatal care when pregnant with a male.
T
he
J
ourna
l of H
um
an Re
sourc
es
94
Table 7
Gender and Pregnancy Complications in India
Night Blindness (1=Yes, 0=No)
(1)
Blurred Vision (1=Yes, 0=No)
(2)
Convulsions (1=Yes, 0=No)
(3)
Swelling (1=Yes, 0=No)
(4)
Fatigue (1=Yes, 0=No)
(5)
Anemia (1=Yes, 0=No)
(6)
Excessive Bleeding (1=Yes, 0=No)
(7)
Any Complication (1=Yes, 0=No)
(8)
Male 0.009** 0.003 0.002 –0.006 0.006 –0.015** 0.000 0.001
(0.003) (0.004) (0.004) (0.005) (0.005) (0.007) (0.002) (0.005) Mean of dependent
variable
0.117 0.133 0.125 0.250 0.482 0.256 0.039 0.596
Observations 32,225 32,236 32,225 32,237 32,236 13,911 32,217 32,252
R- squared 0.059 0.087 0.058 0.025 0.054 0.059 0.008 0.052
Robust standard errors in parentheses *** p<0.01, ** p<0.05, * p<0.1
Bharadwaj and Lakdawala 95
determination. We were unable to get more detailed information for other countries in our sample.
The fi rst four rows of Table 8 display the results of estimating Equation 1 for coun-tries that are known to have son preference: China, Bangladesh, and Pakistan (both the full sample and the region of Punjab).22 Overall, the results from these samples
exhibit patterns consistent with sex- selective discrimination in prenatal care. In China, women are 4.6 percentage points more likely to get some prenatal care when pregnant with a boy, and visit antenatal clinics nearly 10 percent more frequently (relative to the mean). In Bangladesh, women are 2.8 percentage points more likely to get a tetanus shot when pregnant with a boy. We do not fi nd signifi cant estimates in the decision to seek prenatal care, although we do fi nd that women visit prenatal clinics 7 percent more frequently when pregnant with a boy. In Pakistan, we fi nd that women visit prenatal clinics more often and are 2.6 percentage points more likely to consume iron pills when pregnant with a boy. In Pakistani Punjab, a region with a large number of missing women Gechter (2010), the magnitude of discrimination is even larger for some prenatal outcomes; for example, mothers are 4.8 percentage points more likely to take iron pills. Taken all together, the evidence in Table 8 implies that the practice of sex- selective prenatal investments extends beyond India and is widespread across areas with well documented son preference.
Finally, we estimate Equation 1 for countries with no (or at least lesser) established son preference. The last three rows of Table 8 displays the estimates for Sri Lanka, Thailand, and Ghana. While almost all specifi cations are statistically insignifi cant, what is relevant for us is that the magnitudes are quite small. At a minimum, these coeffi cients are smaller than what we found for countries with known son preference. The estimates in Sri Lanka and Thailand are consistent with lower levels of son prefer-ence and none are statistically signifi cant.
B. Other Outcome Variables and Additional Robustness Checks
In Appendix Tables A3–A5 and Online Appendix Tables A2–A4 we examine whether males are more likely to get at least one prenatal visit, whether they get more prenatal visits (number of prenatal visits), whether mothers are more likely to take a tetanus shot while pregnant with a male, the number of tetanus shots the mother takes while pregnant with a male, and whether the delivery took place at home. The various col-umns in each of the table tackle each of the concerns we listed in Section II. Taken together, the results suggest that males get better prenatal care. If we aggregate the effects across all of the binary measures of prenatal care (tetanus shot receipt, prenatal visit, iron pill use, and delivery in a nonhome facility), we fi nd that males are 1.6 percent more likely to receive care and that this gender gap in the aggregated measure of care is statistically signifi cant (p- value 0.011).23
As mentioned in Section III, we can make use of a larger sample containing
infor-22. Note that not all outcomes are available for China.
T
Sex- Selective Prenatal Care in Other Countries
Dependent Variable
China 0.046* 0.346* na na na na
(0.027) (0.205)
Bangladesh 0.003 0.076** 0.028*** 0.039* na 0.001
(0.009) (0.037) (0.009) (0.021) (0.003)
Pakistan 0.018 0.184* 0.020 0.016 0.026* 0.006
(0.015) (0.100) (0.016) (0.039) (0.015) (0.014)
Pakistan (Punjab region) 0.019 0.268* 0.015 0.014 0.048** 0.026
(0.021) (0.152) (0.023) (0.056) (0.022) (0.020)
Sri Lanka 0.002 na 0.010 na na 0.014
(0.008) (0.016) (0.014)
Thailand 0.005 na 0.020 na na 0.014
(0.017) (0.022) (0.018)
Ghana –0.013** 0.010 0.004 0.003 0.005 0.003
(0.006) (0.078) (0.009) (0.024) (0.010) (0.010)
Robust standard errors in parentheses *** p<0.01, ** p<0.05, * p<0.1
Bharadwaj and Lakdawala 97
mation on prenatal care in the RCH. The RCH, however, is not as rich as the NFHS, and thus in Appendix Table A6 we replicate estimations following the full sample specifi cations in Table 1 Column 5, 6 and 7. Our basic results hold when we use this data set. Online Appendix Table A5 shows the results for complications during pregnancy and its correlation with a male birth using the RCH. Again, it appears that instances where a woman is pregnant with a boy are not more likely to result in more complications.
C. Impact on Excess Female Neonatal Mortality
A question of interest in this context is, “How many more girls would there be under equal treatment of prenatal care?” In this section, we attempt to answer this question by examining the gender differential in maternal tetanus vaccinations rather than gen-eral prenatal care. This is mainly because prenatal care is multidimensional in nature and can vary from facility to facility; this makes it diffi cult to assess the causal role that prenatal care plays in determining infant or child mortality. However, tetanus is a rather specifi c infection to which neonates are particularly susceptible. Moreover, as mentioned earlier, tetanus shots have a large impact on reducing neonatal deaths. We calculate (with some assumptions) the number of girls that would have been saved in the neonatal stage had there been no gender bias in the receipt of tetanus immuniza-tions.
While neonatal deaths occur more frequently among males, this does not mean that there are no “excess” female deaths in the neonatal stage. In our sample for India, the observed neonatal death rate is 2.24 percent for girls. Female neonatal mortality rate in Ghana and Italy is around 1.93 percent. Using the sex ratio in neonatal mortality from these countries (because they are presumed to be free of son preference), we impute a neonatal mortality rate for women in India to be around 1.94 percent.24 Thus excess
female neonatal mortality—the amount that the rate exceeds what we expect under equal treatment—is 0.31 percentage points in India.25
Our estimates from Appendix Table A4 suggest that males are 1.1 percent more likely to receive tetanus shots than females (this is our smallest effect across all specifi cations for India). This implies that for every 100 boys, only 98.9 girls receive tetanus shots. If we take estimates from Rahman et al. (1982), we would believe that babies face a mortality rate that is 3.03 times higher in the neonatal stage if the mother did not receive a tetanus shot. Since 80.3 percent of all mothers pregnant with girls receive tetanus shots, the implied neonatal mortality rate for those whose mothers received the shots is 1.6 percent and 4.85 percent for those whose mothers did not.
This means that had the 1.6 girls that did not receive tetanus shots actually received one, 0.008 more girls would have survived than in the case of differential treatment. Hence, unequal allocation of tetanus shots can explain around 2.58–2.67 percent of
24. Ulizzi and Zonta (2002) fi nd that the sex ratio in neonatal deaths is 0.59. Given that we observe 958 neo-natal deaths among boys in our sample, the natural rate for girls would be 1.94 percent in order to maintain the proper sex ratio. That is, the number of neonatal deaths among girls that we expect in order to yield the sex ratio of 0.59 is given by 958 / (958+x) = 0.590, in other words 665.7 deaths. Since we have 34,239 female births in our sample, this implies a natural or equal treatment neonatal mortality rate of 665.7 / 34,239 = 1.94 percent for girls.