www.elsevier.comrlocaterdsw
Conceptual Note
A review of empirical research on manufacturing flexibility
Robert J. Vokurka
a,), Scott W. O’Leary-Kelly
b,1 aDepartment of Engineering Technology and Industrial Distribution, Dwight Look College of Engineering, Texas A & M UniÕersity,
College Station, TX 77843, USA
b
Computer Information Systems and QuantitatiÕe Analysis Department, Sam M. Walton College of Business Administration,
UniÕersity of Arkansas, FayetteÕille, AR 72701, USA
Received 26 August 1999; accepted 12 November 1999
Abstract
Manufacturing flexibility is widely recognized as a critical component to achieving a competitive advantage in the marketplace. A comprehensive look at the empirical research pertaining to manufacturing flexibility highlights the very fragmented nature of this body of work. We present a comprehensive contingency-based framework for examining the content related issues involving the relationships and variables included in past studies. We also examine several important
Ž .
research designrmethodology issues e.g., sampling, data collection and measurement and propose solutions to some identified problems.q2000 Elsevier Science B.V. All rights reserved.
Keywords: Manufacturing flexibility; Empirical research; Measurement and methodology
1. Introduction
In today’s fast paced environment, characterized by short product life cycles and increasing product variety, manufacturing flexibility is emerging as a key competitive weapon. Manufacturing flexibility reflects the ability of firms to respond to changes in their customers’ needs, as well as to unanticipated changes stemming from competitive pressures. Com-panies are addressing these types of competitive pressures through a variety of improvement pro-grams involving manufacturing flexibility, such as
)Corresponding author. Tel.:q1-409-862-7225; fax:q 1-409-845-4980.
Ž .
E-mail addresses: [email protected] R.J. Vokurka ,
Ž .
[email protected] S.W. O’Leary-Kelly .
1
Tel.:q1-501-575-4035; fax:q1-501-575-7687.
just-in-time manufacturing, mass customization tech-niques, time-based methods of competition, and agile
Ž .
manufacturing. Since Hayes and Wheelwright 1984 first advocated that manufacturing flexibility be one of the primary dimensions of the competitive strat-egy of a business, there has been a substantial growth in the amount of research on this topic. Although there has been a great deal of progress towards the enhancement of the knowledge base concerning manufacturing flexibility, a close examination of past studies reveals the fragmented nature of the overall body of literature.
This paper has two main purposes. First, we will synthesize the growing body of empirical research regarding content-related issues and identify possible avenues for future research in the area of manufac-turing flexibility. We center our discussion around a contingency framework that highlights the
compli-0272-6963r00r$ - see front matterq2000 Elsevier Science B.V. All rights reserved.
Ž .
cated interrelationships that surround manufacturing flexibility. This framework, which identifies four
Ž
exogenous variables strategy, organizational struc-. ture, environmental uncertainty, and technology that moderate the relationship between manufacturing flexibility and performance, is used to structure our review of previous studies and to suggest future research directions.
Second, we examine several important method-ological issues regarding manufacturing flexibility research. An examination of past studies indicates several repeated methodological problems with re-gard to measurement validity and reliability, along with problems involving general design issues. In order to strengthen the validity and generalizability of the findings of future studies, we present several solutions to these methodological and design pitfalls.
2. Content related issues based on past research
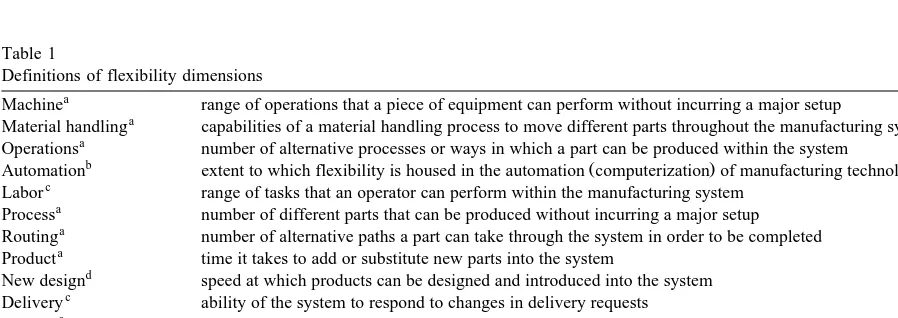
The term manufacturing flexibility does not refer to a single variable, rather manufacturing flexibility refers to a general class of variables. One of the most widely recognized typologies for classifying the dif-ferent dimensions of manufacturing flexibility was
Ž .
developed by Browne et al. 1984 . In their original
framework, they identified eight distinct types of
Ž .
manufacturing flexibility. Sethi and Sethi 1990 en-hanced this framework to include 11 distinct dimen-sions, and as part of this review, we have identified four additional flexibility dimensions: automation, labor, new design, and delivery. The definition and origin for each of the flexibility dimensions is con-tained in Table 1. These will be referenced later as we discuss the published empirical manufacturing flexibility research.
Although research in the area of manufacturing flexibility has progressed in the last several years, our general understanding of the complex relation-ships involving manufacturing flexibility remains fragmented. In order to address this issue, we criti-cally examine previous models and propose a more comprehensive model of our own, one that builds on past research and ties together recent developments in the field.
2.1. PreÕious manufacturing flexibility frameworks
Previous models suggest that manufacturing flexi-bility is dependent on the nature of a firm’s internal
Ž
operations and external environment e.g., Gerwin, . 1987; Slack, 1988; Parthasarthy and Sethi, 1993 . A close examination of past studies reveals that four
Table 1
Definitions of flexibility dimensions
a
Machine range of operations that a piece of equipment can perform without incurring a major setup
a
Material handling capabilities of a material handling process to move different parts throughout the manufacturing system
a
Operations number of alternative processes or ways in which a part can be produced within the system
b Ž .
Automation extent to which flexibility is housed in the automation computerization of manufacturing technologies
c
Labor range of tasks that an operator can perform within the manufacturing system
a
Process number of different parts that can be produced without incurring a major setup
a
Routing number of alternative paths a part can take through the system in order to be completed
a
Product time it takes to add or substitute new parts into the system
d
New design speed at which products can be designed and introduced into the system
c
Delivery ability of the system to respond to changes in delivery requests
a
Volume range of output levels that a firm can economically produce products
a
Expansion ease at which capacity may be added to the system
a
Program length of time the system can operate unattended
a
Production range of products the system can produce without adding new equipment
a
Market ability of the manufacturing system to adapt to changes in the market environment
a
Ž . Ž .
Definitions adapted from Sethi and Sethi 1990 and Gupta and Somers 1992 .
b
Ž .
Definitions adapted from Parthasarthy and Sethi 1993 .
c Ž .
Definitions adapted from Slack 1983 .
d Ž . Ž .
Ž
general areas strategy, environmental factors, orga-.
nizational attributes, and technology comprise the dominant forces influencing manufacturing
flexibil-Ž .
ity. For example, Gerwin 1987 noted that specific sources of environmental uncertainty require the adoption of certain forms of manufacturing flexibil-ity.
One drawback of previous frameworks, however, is that they have addressed relationships in a limited
Ž .
form. For example, Slack 1988 hierarchical model of flexibility depicts manufacturing flexibility as be-ing contbe-ingent on the type of competitive strategies adopted by a firm. His framework implies that differ-ent competitive strategies will require differdiffer-ent forms of manufacturing flexibility in order to improve the firm’s competitive performance. However, this framework omits the contingent relationships involv-ing a firm’s technology, associated environmental factors, as well as its organizational attributes. More recently, the framework proposed by Parthasarthy
Ž .
and Sethi 1993 adopts a much broader view of manufacturing flexibility’s influence on a firm per-formance — that is, it incorporates contingent rela-tionships involving an industry’s technological envi-ronment, as well as its strategic and organizational structural choices. Their framework, however, is lim-ited in that it focuses only on a single dimension of
Ž .
manufacturing flexibility i.e., flexible automation . Other models have focused on the contingent relationship between manufacturing flexibility and
Ž .
environmental factors. Gerwin’s 1993 strategic per-spective model involves the influence of environ-mental uncertainty on manufacturing flexibility. It suggests that a firm’s level of performance is contin-gent on its ability to match the appropriate type of flexibility with the corresponding type of environ-mental uncertainty faced by the firm. Similarly,
Ž .
Suarez et al. 1995 focused on the contingency relationship between market uncertainty and manu-facturing flexibility, depicting firm performance as a logical ‘‘fit’’ between the manufacturing flexibility and the market environment. Although these models address the important relationship between environ-mental uncertainty and manufacturing flexibility, they do not address the other equally important relation-ships involving manufacturing flexibility and busi-ness strategy, organizational attributes, and technol-ogy.
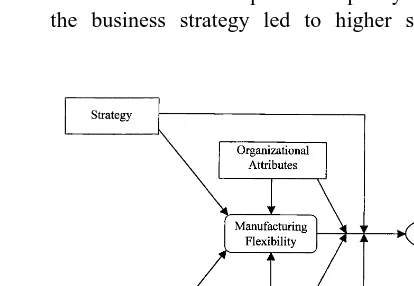
The framework in Fig. 1 brings together the col-lective logic of a growing body of theoretical and empirical research in the area of manufacturing flexi-bility. It is based on a contingency perspective and is governed by two primary principles. The first princi-ple pertains to the forces guiding the four exogenous variables and manufacturing flexibility. This princi-ple maintains that different exogenous variables dic-tate specific responses regarding manufacturing flex-ibility. Although there will be firms that fail to implement the correct form of manufacturing flexi-bility because management is not infallible, this confounding effect will not eliminate detectable rela-tionships among the exogenous variables and manu-facturing flexibility. As will be discussed in the proceeding sections, several studies have found di-rect relationships between the various exogenous variables and different manufacturing flexibility
vari-Ž .
ables. For example, Swamidass and Newell 1987 found that as perceived environmental uncertainty increased, production flexibility increased as well.
The second principle relates to the forces moder-ating the relationship between manufacturing flexi-bility and performance. This principle predicts that those firms able to achieve the appropriate ‘‘fit’’
Ž
between the exogenous variables strategy, organiza-tional attributes, environmental factors and
technol-.
ogy and manufacturing flexibility will exhibit higher levels of performance. For example, Parthasarthy
Ž .
and Sethi 1993 found that a high degree of flexible automation and an emphasis on quality leadership in the business strategy led to higher sales growth
performance, whereas firms emphasizing a quality leadership strategy along with a lower degree of flexible automation experienced lower sales growth performance.
Table 2 summarizes studies that have examined the relationships depicted in Fig. 1. Specifically, it includes studies that examine the relationships be-tween the exogenous variables and manufacturing flexibility, and studies that examine the relationship between manufacturing flexibility and performance. We start by reviewing the relationships between the
exogenous variables and manufacturing flexibility. This is then followed by a review of research that examines the causal relationship between manufac-turing flexibility and performance.
2.2. The impact of exogenousÕariables on
manufac-turing flexibility
2.2.1. EnÕironmental factors
Manufacturing flexibility has been depicted as one of the key factors available to firms to respond
Table 2
Summary of causal empirical studies of manufacturing flexibility
Context of flexibility: DV — flexibility as a dependent variable; IV — flexibility as an independent variable
Study Flexibility Type of exogenous Type of flexibility– Area of performance examined
context variables performance
examined examined relationship
examined
Swamidass and DV, IV Environmental Direct Financial
Ž .
Newell 1987 factors and growth
performance
Fiegenbaum and DV, IV Organizational Moderated Financial
Ž .
Karnani 1991 attributes performance
Ž .
Das et al. 1993 DV Organizational none none
attributes
Parthasarthy and IV Strategy and Moderated Financial
Ž .
Sethi 1993 organizational and growth
attributes performance
Ettlie and Penner- DV Strategy none none
Ž .
Hahn 1994
Ž .
Upton 1995 DV Organizational none none
attributes and technology
Ž .
Ward et al. 1995 DV Environmental Moderated Financial
factors performance
Gupta and DV, IV Strategy Direct Financial
Ž .
Somers 1996 and growth
performance
Safizadeh et al. DV Technology none none
Ž1996.
Suarez et al. DV Organizational none none
Ž1996. attributes and
technology
Boyer et al. DV Organizational Moderated none
Ž1997. attributes and
technology
Ž .
Upton 1997 DV Organizational none none
attributes and technology
Ž .
Vickery et al. 1997 IV none Direct Financial
to the myriad of fast paced changes that take place in their competitive environment. The underlying premise is that the type of manufacturing flexibility adopted by a company is dictated in part by the source of environmental instability it faces or
ex-Ž .
pects to face Beckman, 1990; Gerwin, 1993 . As
Ž .
noted by Beckman 1990, p. 127 , ‘‘it is important that your company understand what types of variabil-ity it is dealing with, as they each may require different types of flexibility on the part of the organi-zation.’’
The competitive environments in which firms compete can be classified according to three general factors: objects, attributes, and perceived uncertainty ŽBourgeois, 1980 . The first factor, the environment. as objects, pertains to the different aspects of a firm’s environment, such as customer demand pat-terns, supplier dependability or the length of product life cycles. The second factor, attributes, consists of three general dimensions: complexity, munificence,
Ž .
and dynamism Dess and Beard, 1984 . Complexity refers to the heterogeneity or ‘‘the number and di-versity of external factors facing an organization’’ ŽBourgeois, 1984 , where as munificence gauges the. supportiveness of an environment in terms of the availability of resources or the ability of the environ-ment to foster the growth of firms within it. Dy-namism pertains to the degree of instability, or the turbulent nature, of the marketplace in which a firm competes. The third factor, perceived uncertainty, is based on management’s perceived inabilityrability to accurately predict future events in their environ-ment.
To date, empirical examinations have considered Ž
only the latter two factors environmental attributes .
and perceived uncertainty . Specifically, Swamidass
Ž .
and Newell 1987 investigated the effects of per-ceived environmental uncertainty on manufacturing flexibility. They found moderate support for the hypothesized relationship that perceived environmen-tal uncertainty would have a positive impact on production flexibility, thus providing some of the earliest support for the link between a firm’s envi-ronment and manufacturing flexibility. In a recent
Ž .
study of Singapore firms, Ward et al. 1995 exam-ined the direct effects on market flexibility with regard to four different environmental variables. Specifically, they examined environmental
dy-namism and three variables that are conceptually related to environmental munificence: business cost, labor availability, and competitive hostility. The re-sults of their study indicated that only environmental
Ž
dynamism i.e., unpredictable changes in the envi-.
ronment was significantly related to market flexibil-ity, providing evidence that different aspects of the environment impact different components of manu-facturing flexibility. Although the results of both studies provide tentative support for the idea that a firm’s environment influences manufacturing flexi-bility, it is surprising to find that only two empirical studies have addressed this issue. Given that manu-facturing flexibility is often identified as one of the primary means for handling the many potentially
Ž
demanding environmental factors Gerwin, 1987, .
1993; Beckman, 1990 , this relationship should be given a high research priority.
The underlying premise of the manufacturing flexibility–environment link is that specific aspects of a firm’s environment influence specific types of manufacturing flexibility. Future researchers should carefully evaluate how they measure both manufac-turing flexibility and the environmental factors. For
Ž .
example, Gerwin 1993 maps out a series of rela-tionships regarding manufacturing flexibility with respect to specific sources of environmental uncer-tainty. Given the specific nature of this relationship, using aggregated flexibility measures may mask the true relationships involving specific forms of manu-facturing flexibility. Likewise, using measures of the environment that are too broad also can mask the links between the different manufacturing flexibility dimensions and specific environmental factors. For
Ž .
example, consider the Swamidass and Newell 1987 study, in which the measure of environmental uncer-tainty was based on several different aspects of the environment, including users of a firm’s products, competition for raw materials, and government regu-lations. This broad measure might explain why, in their study, there was only moderate support for the relationship between production flexibility and envi-ronmental uncertainty.
2.2.2. Organizational attributes
organi-Ž . zation e.g., managerial actions and interactions . Organizational attributes would include, for example, variables involving managerial emphasis and sup-plier involvement, as well as the more traditional design characteristics of a firm such as size, span of control, flatrtall hierarchy, and workforce experi-ence. In accordance with the model in Fig. 1, we propose that a firm’s organizational attributes will impact the types and degree of manufacturing flexi-bility of the firm. Support for this proposition exists across several studies that found that different orga-nizational attributes were significantly related to dif-ferent dimensions of manufacturing flexibility.
For example, there is strong evidence that the size of an organization has a negative impact on volume
Ž
flexibility Fiegenbaum and Karnani, 1991, Das et .
al., 1993 . Other organizational attributes have been Ž studied as well. In two separate studies, Upton 1995,
.
1997 examined several relationships involving prod-uct and prodprod-uction flexibility, respectively. He con-cluded that the degree of managerial emphasis placed on flexibility had a positive effect on both product flexibility and production flexibility. In contrast to the effect of the degree of managerial emphasis,
Ž .
Upton 1995 findings demonstrated that workforce experience had a negative effect on product
flexibil-Ž .
ity as measured by changeover times , whereas it Ž had a positive impact on production flexibility
Up-. Ž .
ton, 1997 . A study by Suarez et al. 1996 examined the effects of several managerial-based policies in-volving the use of lean management practices, sup-plier involvement, and the use of fixed wage scales on new design, volume, and production flexibilities. They found that although supplier involvement was positively associated with all three flexibility vari-ables, the use of lean management practices was positively associated with only production and new design flexibility. They also found that the use of fixed wage scales was positively associated with only volume flexibility.
An important issue with research in this area is that most studies have adopted industry specific
Ž .
measures. For example, Upton 1995 looked at the managerial emphasis placed on quick paper grade changeovers in the paper production process, and he examined plant scale using a measure based on the production paper web speed and lateral distance between the trimmed edges of the paper web. Given
the specific context of these measures, the results are not generalizable to other industries. Therefore, we also should conduct studies that are based on more broadly measured structural attributes, so as to in-crease the generalizability of the results.
2.2.3. Strategy
A firm’s strategy pertains to the collective actions taken by management to support its overall mission. The concept of strategy is hierarchical in nature, occurring at both the functional and business level. Business level strategies represent the dominant ac-tions taken collectively by a firm. Functional level strategies represent the separate actions taken within each function, and are based on the unique resources controlled by each. The business level strategy is implemented by the collective actions of each func-tion.
The link between strategy and manufacturing flex-ibility is well established in the literature. Going
Ž .
back to Hayes and Wheelwright 1979 , their prod-uct-process matrix highlights the fact that the strate-gic choices by a firm, regarding the breadth and volume of the products it markets, will have a direct impact on the requirements surrounding manufactur-ing flexibility. As noted recently, the ‘‘business strategy has direct effects on the adoption of
manu-Ž
facturing flexibility dimensions’’ Gupta and Somers, .
1996 . For example, a company that is pursuing a low-cost strategy would presumably want to focus on economies of scale, in which they utilize long production runs and avoid production changeovers. In turn, this type of business strategy would call for less product flexibility.
One of the earliest empirical studies to examine the relationship between strategy and manufacturing
Ž .
flexibility was by Ettlie and Penner-Hahn 1994 . In their study, they looked at the degree of focus
re-Ž
garding a plant’s manufacturing strategy the degree to which they tended to concentrate on a limited
.
found there was no demonstrated effect of strategy on product flexibility. This lack of a demonstrated relationship may well be due to the multidimensional aspects of both strategy and product flexibility and some of the research design and measurement issues discussed later in this paper.
Ž .
In a large-scale study, Gupta and Somers 1996 Ž examined the impact of a firm’s business strategy as
Ž .
measured by Venkatraman’s 1989 strategy typol-.
ogy on nine separate dimensions of manufacturing flexibility. Given the large number of relationships examined in this study, a full explanation is not possible here; however, their general conclusion was that the effect of business strategy on manufacturing flexibility differs according to the type of business strategy being pursed by the firm.
These studies provide initial support for the exis-tence of a contingency-based relationship between manufacturing flexibility and the strategy adopted by a firm. However, given that there have been only two published studies examining this relationship, it is evident that much more work is needed in order to develop substantive insights. One area especially in need of further examination is the assessment of how the content of a firm’s strategy is linked to the different types of manufacturing flexibility. For ex-ample, which dimensions of manufacturing flexibil-ity are most supportive to firms competing via new product innovation? In order to develop meaningful insights about these types of questions, research must consider multiple industries.
2.2.4. Technology
Technology pertains to the processes used to con-vert inputs into outputs. Empirical research involving manufacturing flexibility has largely ignored the more traditional dimensions of technology, such as its
Ž .
complexity Woodward, 1965 , the degree to which
Ž .
it is routinernonroutine Perrow, 1967 , its
interde-Ž .
pendence Thompson, 1967 , and the degree of
Ž .
work-flow integration Pugh et al., 1969 . Instead, researchers have focused on alternative character-istics such as the scale and age of technology, as well as advanced manufacturing technologies.
Ž .
In two separate studies, Upton 1995, 1997 ex-amined the scale and the age of the technology employed in manufacturing processes and their im-pact on product and production flexibility,
respec-tively. It was found that as the scale of the technol-ogy increased, the degree of production flexibility decreased, whereas there was no significant associa-tion for product flexibility. The age of technology was found to have differing effects on product and production flexibility. Specifically, it was found that
Ž
as the age of the technology increased i.e., older .
equipment there was a decrease in product
flexibil-Ž .
ity Upton, 1995 ; however, the older technology was associated with increased production flexibility ŽUpton, 1997 . Upton’s findings provide evidence. for a contingency-based perspective, which stipulates that the different dimensions of manufacturing flexi-bility are not all equally impacted by different as-pects of technology.
We now turn our attention to the studies involving
Ž .
advanced manufacturing technology AMT . AMT encompasses a broad array of computer-assisted technologies pertaining to design, planning and
pro-Ž
duction systems e.g., computer-aided design, com-puter-aided manufacturing, programmable
automa-. Ž .
tion Dean and Snell, 1991 . Although conventional wisdom has it that increased use of AMT leads to an increase in flexibility, several studies have produced contradictory results. For example, Boyer et al. Ž1997 studied firms across several industries, and. examined both the direct and moderated effects of
Ž
AMT on market flexibility using a composite mea-.
sure involving multiple forms of flexibility . Specifi-cally, they looked at direct effects of AMT, as well as the moderating effects of manufacturing infras-tructure on the relationship between AMT and the market flexibility of a firm. Contrary to conventional wisdom, their results indicated that AMT had neither a direct nor a moderated effect on flexibility.
In a study involving the printed circuit board
Ž .
industry, Suarez et al. 1996 examined the impact of Ž
AMT in the form of programmable automated pro-.
conven-tional wisdom that AMT increases the flexibility of the firm.
Similarly, in studies involving plants in the
fine-Ž .
paper industry, Upton 1995, 1997 examined the Ž
direct effects of AMT also in the form of pro-.
grammable automated production on both product and production flexibility, respectively. Paralleling conventional expectations, he hypothesized that in-creased use of AMT would lead to inin-creased product and production flexibility. However, in both in-stances, the opposite was found. That is, in the first
Ž .
study 1995 he found that increased use of AMT was associated with decreased product flexibility. Similarly, in his 1997 study, increased use of AMT was associated with decreased production flexibility. The results of these studies tend to corroborate anecdotal evidence that the use of AMT does not necessarily correlate with increased manufacturing
Ž .
flexibility Zammuto and O’Connor, 1992 . For
ex-Ž .
ample, Jaikumar 1986 observed that there was very Ž little association between the use of AMT in the
.
form of flexible manufacturing systems and flexibil-ity for plants studied in the United States. He pro-posed that the reason was related to the lack of vision by managers to take advantage of the full potential of these types of technologies. As further evidence, he noted that plants in Japan using similar technology exhibited much greater flexibility across
Ž .
several dimensions Jaikumar, 1986 . Some of the strongest evidence comes from the studies by Upton in which it was found that the degree of managerial emphasis placed on flexibility had a strong associa-tion with the level of flexibility observed across the
Ž .
plant in these studies Upton, 1995, 1997 .
Ž .
Alder 1988 also contends that the lack of associ-ation between manufacturing flexibility and the use of AMT stems from several factors related to man-agement. He suggests that the increased level of complexity associated with AMTs requires a very different set of managerial skills than are necessary for more traditional production technologies. He notes that many managers do not have the level of expertise necessary to take full advantage of the benefits of using AMT. Another possible reason cited is that managers may simply choose not to focus on flexibility as a means for competing in the marketplace. Finally, echoing the observations of
Ž .
Jaikumar 1986 , he noted that US managers tend to
be too conservative in their management of AMT. He cites the continued prevalence of the productrprocess matrix first introduced by Hayes
Ž .
and Wheelwright 1979 , which depicts the produc-tion of customized products using the tradiproduc-tional job shopsrbatch processes. Likewise, the productrpro-cess matrix depicts the assembly linercontinuous flow production processes as being more automated and less flexible and, in turn, more suitable for producing standardized products that involve little customization.
Two recent studies have examined the productrprocess matrix and the effect that AMT has
Ž .
had on this paradigm. Safizadeh et al. 1996 re-ported that a significant proportion of the plants they
Ž .
examined approximately 25% were positioned off-diagonal, that is, these plants ran counter to the traditional patterns identified in Hayes and Wheel-wright’s productrprocess matrix. Safizadeh et al. note that when the off-diagonal continuous flow production facilities adopted AMTs, they were able to economically attain high-volume mass
customiza-Ž
tion traditional continuous flow shops produce stan-.
dardized products in large volumes . In a case-based
Ž .
study, McDermott et al. 1997 examined firms in the US power tool industry. They found that the use of AMTs has greatly eroded the trade-offs depicted in the productrprocess matrix regarding the tradi-tional process choice and flexibility characteristics. They observe that progress involving AMTs has allowed manufacturers to pursue a broader set of production choices than is depicted in the productrprocess matrix, one in which firms are able to simultaneously pursue high-volume efficiency and product flexibility.
Overall, the findings across the studies involving technology present no clear pattern regarding the impact of technology on manufacturing flexibility. Even more troubling is the apparently inconsistent results surrounding the use of AMT. For example, in the studies that examined the specific relationship
Ž
between ATM and flexibility Upton, 1995, 1997; .
flexibil-ity in the context of the processrproduct matrix found that the use of AMT was associated with an increase in manufacturing flexibility.
In exploring the reasons behind these apparent contradictions, two important aspects are worth not-ing. First, it is logical that differences in the basic types of process layouts in which AMT is being
Ž .
utilized e.g., job shop versus continuous flow will affect the overall level of flexibility. For instance, in
Ž .
the study by Safizadeh et al. 1996 , they controlled for differences in process layouts when comparing the level of flexibility across firms. This approach provides a means for controlling for differences in flexibility due to general types of production layouts and, in turn, allows for the isolation of the specific effects due to AMT. Second, given the complex nature of most types of AMT, there may be a significant lag time between adopting AMT and
Ž seeing the benefits of the new technologies Boyer,
.
1999 . The use of a cross-sectional design does not allow us to account for this lag-time effect and can therefore obscure the true relationship between use of AMT and the level of manufacturing flexibility.
Although, these changes to research design may increase the validity of the findings in a study, the very complex nature of the technology encompassing AMT creates a need for a detailed exploration of the relationship between AMT and flexibility. Specifi-cally, what types of managerial processes moderate the effects of AMT on manufacturing flexibility? Also, what components of AMT are linked to spe-cific manufacturing flexibility dimensions? This type of exploration also is critical from a practical point of view, in that many firms seek to enhance only specific dimensions of flexibility. Finally, although recent studies call into question the validity of the productrprocess matrix, more research is needed to resolve this question. Focusing on investigating the potential trade-offs depicted in the productrprocess matrix would not only help resolve this question, it would provide valuable insight for developing a more robust paradigm regarding AMT and manufac-turing flexibility.
2.3. Performance implications of manufacturing flex-ibility
As previously noted, manufacturing flexibility has been widely cited as a means for improving firm
performance, especially for firms competing in very dynamic markets. Although several studies have ex-plored the influence of manufacturing flexibility on organizational performance, two competing models have emerged — those suggesting a direct
relation-Ž
ship versus those advocating a moderated or contin-.
gent relationship. The direct effects model suggests that increased manufacturing flexibility will lead to improved firm performance. On the other hand, the contingency-based model suggests that the perfor-mance–manufacturing flexibility relationship is situ-ational. For example, increasing a firm’s volume flexibility would yield greater performance improve-ments for those firms facing increased demand un-certainty versus those firms in more stable demand environments. Specifically, simply increasing manu-facturing flexibility will not necessarily increase firm performance, rather it will depend on the degree to which manufacturing flexibility complements the firm’s environmental factors, strategy, organizational attributes, and technology.
Ž .
Studies by Swamidass and Newell 1987 , Gupta
Ž . Ž .
and Somers 1996 , and Vickery et al. 1997 exam-ined the direct effect of manufacturing flexibility on
Ž .
performance. In these studies, Vickery et al. 1997 found a significant positive relationship between pro-duction flexibility and financial performance.
Ž .
Swamidass and Newell 1987 also found a signifi-cant positive relationship between production flexi-bility and an aggregated performance measure based on both growth and financial performance. In
con-Ž .
trast, Gupta and Somers 1996 found no significant relationships between their nine flexibility variables and financial performance. They did find, however, several significant relationships between flexibility and growth performance. Specifically, they found that market, routing, and volume flexibility variables were all positively related to growth performance, whereas production flexibility was negatively related to growth performance.
Ž .
In contrast, Fiegenbaum and Karnani 1991 found no direct relationship between volume flexibility and financial performance, rather they found this rela-tionship was moderated by organizational attributes. Specifically, they found that for small size compa-nies, output flexibility was positively related to per-formance, with the opposite being true for large size
Ž .
()
R.J.
Vokurka,
S.W.
O’Leary-Kelly
r
Journal
of
Operations
Management
18
2000
485
–
501
Table 3
Summary of causal empirical studies by manufacturing flexibility variables Flexibility Studies
dimensions Swamidass Fiegenbaum Das et al. Parthasarthy Ettlie and Upton Ward et al. Gupta and Safizadeh Suarez Boyer Upton Vickery
Ž . Ž . Ž . Ž .
and and 1993 and Penner-Hahn 1995 1995 Somers et al. et al. et al. 1997 et al.
Ž . Ž . Ž . Ž . Ž . Ž .
Newell Karnani Sethi 1994 1996 1996 1996 1997 1997
Ž1987. Ž1991. Ž1993.
Machine U
Material handling U
Operations
Automation U
Labor
Process U
Routing U
Product U U
New design U
Delivery
Volume U U U U U
Expansion U
Program U
Production U U U U U U U
found that the relationship between flexible automa-tion and growth in sales was moderated by several business strategy and structure variables. Specifi-cally, they found that business strategies involving scope and speed flexibility, quality, and low cost interacted with flexible automation in their effect on performance. They also found that structural
Ž .
variables skill specialization and use of teams interacted with flexibility to affect performance. In
Ž .
addition, Ward et al. 1995 found that in high performing firms there was a significant positive relationship between labor shortages in the firm’s competitive environment and response time flexibil-ity, but that there was no relationship between the two variables for low performing firms. They also found a stronger positive relationship between envi-ronmental dynamism and response time flexibility in
Ž .
high versus low performing firms.
Given that the two sets of studies involved differ-ent combinations of exogenous and flexibility vari-ables, it is difficult to contrast the results. However, the significant findings in these very differently
ori-Ž
ented studies i.e., contingent versus direct relation-ships between manufacturing flexibility and
perfor-.
mance highlight the need for further examination of these relationships.
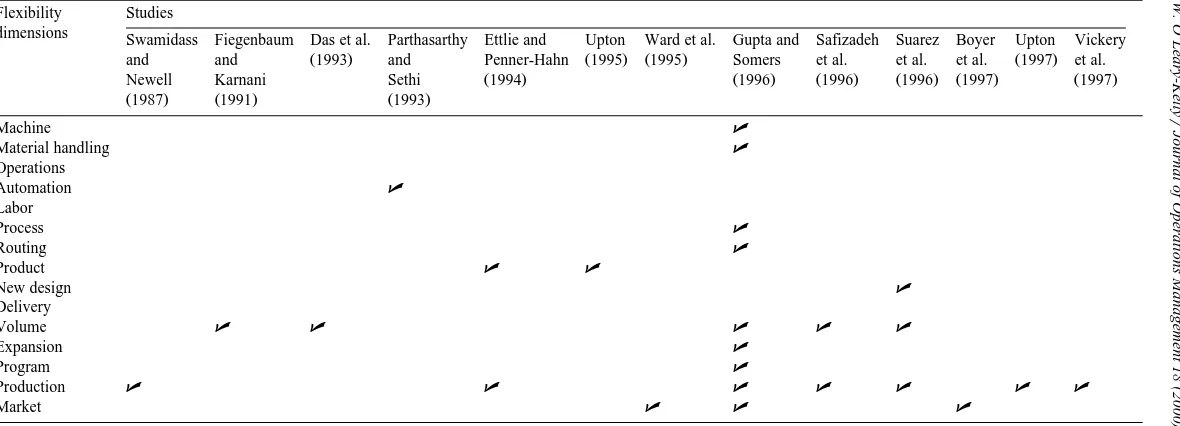
Before moving on to our discussion of design and methodological issues, it is important to note that there is a clear need for more research examining the indirect and direct relationships involving the differ-ent dimensions of manufacturing flexibility. In Table 3, we cross-reference the reviewed studies against the different flexibility dimensions. It should be noted
Ž
that three of the dimensions operations, labor, and .
delivery have not been included in any of the studies and that most studies focus on only a single dimension of flexibility. This is problematic because
Ž
cross-validation of results i.e., findings that are sup-. ported across multiple independent studies is the cornerstone for an establishment of sound theoretical understanding in any field, yet it is notably absent here. The cross-validation of the results of the previ-ous studies should be a major research priority.
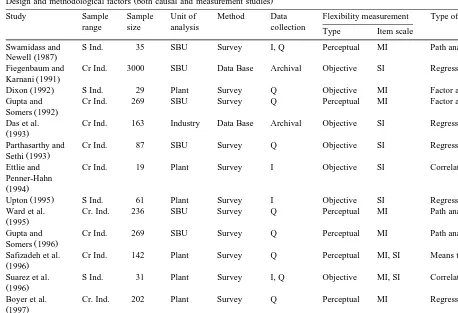
3. Design and methodological issues
Equally important to the advancement of the evolving theory around manufacturing flexibility are
the design and methodological aspects of the re-search. As research progresses, it is important that we recognize existing limitations and focus greater
Ž
attention on increasing research precision construct .
validity, informant bias, unit of analysis and scope Žgeneralizability and statistical powerrsample size .. The discussion in this section considers five Ž . important design and methodological issues: 1 operationalization of the manufacturing flexibility
Ž . Ž .
construct, 2 generalizability of the studies, 3 in-Ž . formant bias associated with data collection, 4 the effects of the different levels of the unit of analysis,
Ž .
and 5 the statistical power issues. Table 4 presents a summary of existing manufacturing flexibility stud-ies on these five issues. In the following sections, we examine each of these issues and provide direction for future studies.
3.1. Construct operationalization
Construct operationalization includes the way in which we define and measure the variables in a study. The operationalization of manufacturing flexi-bility has been identified as ‘‘the single most impor-tant research priority’’ in this area of research ŽGerwin, 1993 . In order to bridge the gap between. theory and empirical observation, it is necessary to develop and establish measures that are both reliable and valid. Here, we examine the implications of two critical factors related to the operationalization of
Ž .
manufacturing flexibility constructs: a the type of Ž .
measures used, and b measurement properties. Several studies have used perceptual measures, which rely on the judgment of the informant to gauge manufacturing flexibility. Given the subjectiv-ity introduced by perceptual measures, there tends to be a substantial risk of increased measurement error
Ž
that can lead to erroneous conclusions Campbell .
and Fiske, 1959 . Other fields of research have ques-tioned the use of perceptual measures. For example, the use of perceptual measures to operationalize firm performance has been criticized in the field of
strate-Ž .
gic management Dess and Robinson, 1984 . How-ever, researchers in this field have responded to these criticisms by investigating the validity of such mea-sures and have found relatively high correlations
Table 4
Ž .
Design and methodological factors both causal and measurement studies
Study Sample Sample Unit of Method Data Flexibility measurement Type of analysis
range size analysis collection Type Item scale
Swamidass and S Ind. 35 SBU Survey I, Q Perceptual MI Path analysis
Ž .
Newell 1987
Fiegenbaum and Cr Ind. 3000 SBU Data Base Archival Objective SI Regression
Ž .
Karnani 1991
Ž .
Dixon 1992 S Ind. 29 Plant Survey Q Objective MI Factor analysis.
Gupta and Cr Ind. 269 SBU Survey Q Perceptual MI Factor analysis
Ž .
Somers 1992
Das et al. Cr Ind. 163 Industry Data Base Archival Objective SI Regression
Ž1993.
Parthasarthy and Cr Ind. 87 SBU Survey Q Objective SI Regression
Ž .
Sethi 1993
Ettlie and Cr Ind. 19 Plant Survey I Objective SI Correlation
Penner-Hahn
Ž1994.
Ž .
Upton 1995 S Ind. 61 Plant Survey I Objective SI Regression
Ward et al. Cr. Ind. 236 SBU Survey Q Perceptual MI Path analysis
Ž1995.
Gupta and Cr Ind. 269 SBU Survey Q Perceptual MI Path analysis
Ž .
Somers 1996
Safizadeh et al. Cr Ind. 142 Plant Survey Q Perceptual MI, SI Means test
Ž1996.
Suarez et al. S Ind. 31 Plant Survey I, Q Objective MI, SI Correlation
Ž1996.
Boyer et al. Cr. Ind. 202 Plant Survey Q Perceptual MI Regression
Ž1997.
Ž .
Upton 1997 S Ind. 54 Plant Survey I, Q Objective MI Regression
Vickery et al. S Ind. 65 SBU Survey I, Q Perceptual SI Regression
Ž1997.
Sample range: S Ind. — single industry, Cr Ind. — cross industry. Unit of analysis: SBU — strategic business unit.
Data collection: I — interview, Q — questionnaire.
Item scales: SI — single item measures, MI — multiple item measures.
.
1987 . Similar efforts are needed to establish the validity of perceptual measures used to gauge manu-facturing flexibility, as this issue has not been ad-dressed.
Extending beyond the question of perceptual mea-sures, several measurement properties have been identified as important for establishing the adequacy of measures: unidimensionality, reliability,
discrimi-Ž
nant and convergent validity Gerbing and Anderson, 1988; Bagozzi et al., 1991; O’Leary-Kelly and
.
Vokurka, 1998 . Although these issues are typically associated with perceptual measures, they also are applicable to many of the objective measures used in
Ž .
the current studies. As noted by Dixon 1992 , many
companies do not collect quantifiable information in exactly the same form as required by researchers
Ž .
and, therefore, ‘‘some judgment is undoubtedly required’’ in reporting data. In addition, for even the most objective data, variances across instruments and inaccuracies in recorded data, which may be com-mon given that they are not recorded by the investi-gator, create measurement problems. A requirement for assessing the measurement properties described
Ž .
mea-sures are appropriate for relatively simple and nar-rowly defined constructs, the different dimensions of manufacturing flexibility are complex in nature, making the appropriateness of single-item measures
Ž .
questionable Venkatraman and Grant, 1986 . Researchers utilizing multiple-item measures should establish that they are unidimensional, that is, the measures are comprised of items that are
associ-Ž
ated with a single construct O’Leary-Kelly and .
Vokurka, 1998 . In addition, scales should be tested Ž
for reliability i.e., the degree to which the measure .
is free of random error . Discriminant validity is yet another important issue that has not been adequately addressed in existing empirical studies. Discriminant validity is an indication that a construct is opera-tionally distinct from other constructs in the study. Given the potential for different dimensions of man-ufacturing flexibility to be interrelated, this is an important issue, especially for studies involving more
Ž
than one dimension of flexibility e.g., Suarez et al., .
1996 . Convergent validity pertains to the agreement that exists between informants of the same construct. Several studies to date have involved multiple infor-mants; however, measurement agreement was not
Ž
assessed in any of these studies e.g., Ettlie and .
Penner-Hahn, 1994 .
3.2. Generalizability of the studies
Generalizability pertains to the inductive charac-teristics of a study, that is, the ability to take the specific finding of a study and draw more wide-rang-ing conclusions about general events. Both the
sam-Ž .
ple range or sample homogeneity and the scope of the measures incorporated into a study can impact the generalizability of the findings. Studies that
in-Ž volve data collected across multiple settings i.e.,
. across industries, across process technologies yield results that are more generalizable than single-setting studies. However, it should be noted that multiple-setting studies introduce the possibility of
confound-Ž .
ing effects e.g., industry effects that can create misleading results. For example, in a study by
Ž .
Fiegenbaum and Karnani 1991 , the relationship between firm size and volume flexibility was shown
Ž to be moderated by different industry settings capital
.
intensity, profitability, and volatility . Few studies,
Ž .
with the exception of Fiegenbaum and Karnani 1991
Ž .
and Das et al. 1993 , have controlled for or exam-ined potential cross-industry effects. Future research that involves the collection of data across multiple settings must address this issue.
Ž
Studies using both perceptual Gupta and Somers,
. Ž .
1992 and objective Dixon, 1992 measures have demonstrated that the individual dimensions of man-ufacturing flexibility are comprised of multiple items. As an example, the construct production flexibility, which was included in several studies, has been measured using several different items, such as vol-ume of part types not requiring a major setup, the number of parts made during a fixed time interval,
Ž
and changeover cost Gupta and Goyal, 1989; Sethi .
and Sethi, 1990 . However, the majority of the causal studies to date have used single-item measures. Con-sequently, the use of single-item measures limits our ability to generalize the results beyond one study, because only very narrow aspects of manufacturing flexibility are captured. To enhance the generalizabil-ity of results, future studies should use multiple-item measures when possible.
3.3. Informant bias
Informant bias relates to the extent to which observations are based on the source of the
informa-Ž .
tion the informant and not the variable being mea-sured. For example, there is evidence that an infor-mant’s position in the firm can systematically affect their responses, thereby creating a biased measure ŽKumar et al., 1993 . Informant bias is usually asso-. ciated with studies involving perceptual measures; however, even for objective measures, judgment can
Ž .
play a role in reporting the data Dixon, 1992 . In Ž
addition, the methods used to collect data i.e., num-ber of informants, structured interviews, or archival
.
data can affect the degree of informant bias. As the degree of informant bias in a measure increases, the overall validity of the measure decreases and can have serious adverse affects on the integrity of the research findings.
because of their particular position in the
organiza-Ž .
tion Phillips and Bagozzi, 1986 . The use of multi-ple informants provides researchers with a means of
Ž
assessing the degree of informant bias O’Leary-.
Kelly and Vokurka, 1998 . To date, most studies have used a single internal informant in the collec-tion of their data.
In addition, several existing studies have used interviews as a means of collecting data. Reports on most of these did not indicate whether the interviews
Ž
were structured or informal. Informal or unstruc-.
tured interviews would tend to rely more heavily on researchers’ interpretations of responses in order to derive measurement values, and thereby increase the potential to introduce their own biases into the study. A way to avoid this would be to use a structured interview, which would increase the uniformity of responses across respondents and possibly lessen the amount of bias in the measurement. Other methods for reducing informant bias include the use of an unbiased outside observer to collect data, the use of
Ž
archival data e.g., COMPUSTAT or governmental .
data , or the use of a combination of multiple data collection methods. These issues should be addressed in order to increase the validity of future research findings.
3.4. Unit of analysis
Many of the studies were conducted at the single
Ž . Ž
business unit SBU level e.g., stand-alone firms, .
autonomous divisions , and two of the studies in-volved basic level manufacturing flexibility variables Ži.e., the individual processes that make up the
pro-.
duction process . The use of a SBU as a unit of analysis raises several important issues. The first issue involves the degree of homogeneity of plant flexibility within a SBU. Several studies at the plant level which involved multiple plants within a com-pany have shown that there is nonuniform flexibility
Ž .
across the plants Upton, 1995 . For studies that measure the flexibility at the SBU level, it should not be assumed that flexibility is constant across differ-ent production processes.
Using the plant as a unit of analysis has its own limitations, specifically the ability to assess the effect of manufacturing flexibility on firm performance Že.g., ROI, profitability, sales growth . This limita-.
tion stems from the complications associated with accurately allocating individual plant contributions to firm level performance measures. An alternative
Ž .
would be to focus on plant level or operational performance measures, such as unit costs, delivery reliability, and defect rates. Analysis of the influence of the different manufacturing flexibility dimensions on operational performance measures would provide valuable insight into their specific contributions and limitations to the organization. Unfortunately, none of the plant level studies, with the exception of
Ž .
Suarez et al. 1996 , addressed these issues.
3.5. The effects of statistical power
Statistical power refers to the probability of reject-ing the null hypothesis when the null is false. In many studies, some of the null hypotheses are not rejected, as was the case with most of the manufac-turing flexibility studies. This can occur for many reasons, such as the theory behind the study is erroneous, the null is correct, or the statistical power
Ž is insufficient to reject the null hypothesis i.e., the
. null is false but the results indicated that it is true .
Ž .
For example, both Ettlie and Penner-Hahn 1994
Ž .
and Suarez et al. 1996 emphasized that they did not find any relationships between different manufactur-ing flexibility dimensions and either cost or quality variables. Although these are noteworthy results, they also could be due to a lack of statistical power in their analyses. Both of these studies were based on small sample sizes, which have been shown to greatly
Ž
reduce the power of analysis Kraemer and Thie-.
mann, 1987 .
None of the empirical studies reviewed here as-sessed the power associated with their statistical analyses and, therefore, the failure to reject the null hypotheses should be interpreted with caution. Until the results of power analyses are regularly reported, it will be difficult to correctly interpret null findings.
4. Discussion
enhance our understanding of this complex phenomenon. Manufacturing flexibility is a multimensional concept, comprised of several distinct di-mensions that can be aggregated in a hierarchical manner. Manufacturing flexibility can provide a competitive advantage if there is a proper fit between exogenous variables such as the competitive environ-ment, strategy, organizational attributes, and technol-ogy. These exogenous factors are thought to impact the type of manufacturing flexibility adopted by a firm. Increasing competition in the marketplace leaves little room for a trial-and-error approach in decision making. So that managers can make more informed decisions, we need to develop a better understanding concerning the requirements placed on manufacturing flexibility by the environmental forces outside the firm, as well as the strategic, organiza-tional, and technological choices adopted within the firm.
In addition to the relationships between manufac-turing flexibility and these exogenous variables, stud-ies that address the interrelationships among the different manufacturing flexibility variables are needed. To date, very little is known about the potential trade-offs or possible synergies that may exist among these variables. Although several studies have suggested a hierarchical structure among the
Ž
manufacturing flexibility variables Browne et al., . 1984; Sethi and Sethi, 1990; Suarez et al., 1996 , no studies have examined this issue. Given the over-whelming number of questions surrounding these issues, in combination with the limited number of studies addressing them to date, there is an enormous challenge to researchers in this area. Managers in industry would benefit greatly from knowledge of these interrelationships, trade-offs, and synergies as they use and build their manufacturing flexibility capability to improve their competitive advantage.
Regarding the relationship between manufacturing flexibility and firm performance, there is conflicting evidence concerning the nature of this relationship.
Ž .
Studies by Swamidass and Newell 1987 , Gupta and
Ž . Ž .
Somers 1996 , and Vickery et al. 1997 provide evidence that manufacturing flexibility directly af-fects performance. It is interesting to note that two of
Ž
the studies involved a single industry Swamidass .
and Newell, 1987; Vickery et al., 1997 , which may account for their similar results. Because they
exam-ined a single industry, there may have been industry-specific attributes regarding the competitive environment that might have been conducive to cer-tain types of manufacturing flexibility. On the other hand, several studies provide evidence that the rela-tionship between manufacturing flexibility and
per-Ž formance is moderated by several variables Fiegen-baum and Karnani, 1991; Parthasarthy and Sethi,
.
1993; Ward et al., 1995 . The discrepancies between Ž
the results of these two sets of studies i.e., those studies reporting a direct relationship versus those
.
studies reporting a moderated relationship highlight the need for more research to resolve the differences. In addition, the effect of industry type should be investigated.
One of the most pressing problems is the develop-ment of a set of valid measures relating to the different dimensions of manufacturing flexibility. Valid measures are a necessary requirement for ade-quate tests of hypotheses about manufacturing flexi-bility. In order to improve research precision and scope, a number of design and methodological issues have been raised. Researchers should focus on the multidimensional aspects of manufacturing flexibil-ity, should make greater use of multi-item measures, and should assess the measurement properties
men-Ž .
tioned earlier e.g., reliability and validity . Re-searchers should enhance generalizability by con-ducting studies across multiple research settings and by utilizing multiple-item constructs that offer a broader operationalization of the flexibility con-structs. Also needed are greater use of multiple
Ž
informants in order to assess and possibly reduce the potential for informant bias and its confounding
.
effects , reporting of the statistical power of analyses Žso that null findings can be correctly interpret , and. careful consideration of the level of analysis used in studies.
5. Conclusion
com-petitive advantage and improved performance. The interrelationships, trade-offs, and synergies between the variables identified in the contingency-based framework presented here should be more thor-oughly examined, so that firms can build their manu-facturing flexibility capability in the most effective manner. At the same time, methodological and de-sign improvements need to be made to strengthen the validity and generalizability of future studies. Ad-dressing these issues will allow a fuller understand-ing of the complex processes surroundunderstand-ing manufac-turing flexibility.
References
Alder, P.S., 1988. Managing flexible automation. California Man-agement Review 30, 34–56.
Bagozzi, R.P., Yi, Y., Phillips, L.W., 1991. Assessing construct validity in organizational research. Administrative Science
Ž .
Quarterly 36 3 , 421–458.
Beckman, S.L., 1990. Manufacturing flexibility: the next source
Ž .
of competitive advantage. In: Moody, P.E. Ed. , Strategic Manufacturing. Dow Jones, Irwin, pp. 107–132.
Bourgeois, L.J., 1980. Strategy and environment: a conceptual
Ž .
integration. Academy of Management Review 5 1 , 25–39. Boyer, K.K., 1999. Evolutionary patterns of flexible automation
and performance: a longitudinal study. Management Science
Ž .
45 6 , 824–842.
Boyer, K.K., Leong, G.K., Ward, P.T., Krajewski, L.J., 1997. Unlocking the potential of advanced manufacturing
technolo-Ž .
gies. Journal of Operations Management 15 4 , 331–347. Browne, J., Dubois, D., Rathmill, K., Sethi, S.P., Stecke, K.E.,
1984. Classification of flexible manufacturing systems. The
Ž .
FMS Magazine 2 2 , 114–117.
Campbell, D.T., Fiske, D.W., 1959. Convergent and discriminant validation by the multitrait-multimethod matrix. Psychological
Ž .
Bulletin 58 2 , 81–105.
Das, B.J., Chappell, W.G., Shughart, W.F., 1993. Demand fluctu-ations and firm heterogeneity. Journal of Industrial Economics
Ž .
41 1 , 51–60.
Dean, J.W., Snell, S.A., 1991. Integrated manufacturing and job
Ž .
design. Academy of Management Journal 34 4 , 776–804. Dess, G.G., Beard, D.W., 1984. Dimensions of organizational task
Ž .
environments. Administrative Science Quarterly 29 1 , 52–73. Dess, G.G., Robinson, R.B. Jr., 1984. Measuring organizational performance in the absence of objective measures: the case of the privately held firm and conglomerate business unit.
Strate-Ž .
gic Management Journal 5 3 , 265–273.
Dixon, J.R., 1992. Measuring manufacturing flexibility: an empir-ical investigation. European Journal of Operational Research
Ž .
60 2 , 131–143.
Ettlie, J.E., Penner-Hahn, J.D., 1994. Flexibility ratios and
manu-Ž .
facturing strategy. Management Science 40 11 , 1444–1454.
Fiegenbaum, A., Karnani, A., 1991. Output flexibility — a com-petitive advantage for small firms. Strategic Management
Ž .
Journal 12 2 , 101–114.
Gerbing, D.W., Anderson, J.C., 1988. An updated paradigm for scale development incorporating unidimensionality and its
as-Ž .
sessment. Journal of Marketing Research 25 2 , 186–192. Gerwin, D., 1987. An agenda for research on the flexibility of
manufacturing processes. International Journal of Operations
Ž .
and Production Management 7 1 , 38–49.
Gerwin, D., 1993. Manufacturing flexibility: a strategic
perspec-Ž .
tive. Management Science 39 4 , 395–410.
Gupta, Y.P., Goyal, S., 1989. Flexibility of manufacturing sys-tems: concepts and measurements. European Journal of
Opera-Ž .
tional Research 43 2 , 119–135.
Gupta, Y.P., Somers, T.M., 1992. The measurement of manufac-turing flexibility. European Journal of Operational Research
Ž .
60 2 , 166–182.
Gupta, Y.P., Somers, T.M., 1996. Business strategy, manufactur-ing flexibility, and organizational performance relationships: a path analysis approach. Production and Operations
Manage-Ž .
ment 5 3 , 204–233.
Hayes, R.H., Wheelwright, S.C., 1979. Link manufacturing
pro-Ž .
cess and product life cycles. Harvard Business Review 57 1 , 133–140.
Hayes, R.H., Wheelwright, S.C., 1984. Restoring our Competitive Edge: Competing Through Manufacturing. Wiley, New York. Jaikumar, R., 1986. Postindustrial manufacturing. Harvard
Busi-Ž .
ness Review 64 6 , 69–76.
Kraemer, H.C., Thiemann, S., 1987. How many subjects? SAGE Publications, Newbury Park.
Kumar, N., Stern, L.W., Anderson, J.C., 1993. Conducting in-terorganizational research using key informants. Academy of
Ž .
Management Journal 36 6 , 1633–1651.
McDermott, C.M., Greis, N.P., Fischer, W.A., 1997. The dimin-ishing utility of the productrprocess matrix. International
Ž .
Journal of Operations and Production Management 17 1 , 65–84.
O’Leary-Kelly, S.W., Vokurka, R.J., 1998. The empirical assess-ment of construct validity. Journal of Operations Manageassess-ment
Ž .
16 4 , 387–405.
Parthasarthy, R., Sethi, S.P., 1993. Relating strategy and structure to flexible automation: a test of fit and performance
implica-Ž .
tions. Strategic Management Journal 14 7 , 529–549. Perrow, C., 1967. A framework for the comparative analysis of
organizations. American Sociological Review 32, 194–208. Phillips, L.W., Bagozzi, R.P., 1986. On measuring organizational
properties of distribution channels: methodological issues in the use of key informants. Research in Marketing 8, 313–369. Pugh, D.S., Hickson, D.J., Hinings, C.R., Turner, C., 1969. The context of organization structures. Administrative Science Quarterly 14, 91–114.
Safizadeh, H.M., Ritzman, L.P., Sharma, D., Wood, C., 1996. An empirical analysis of the product-process matrix. Management
Ž .
Science 42 11 , 1576–1591.
Sethi, A.K., Sethi, S.P., 1990. Flexibility manufacturing: a survey.
Ž .
Slack, N., 1988. Manufacturing systems flexibility — an assess-ment procedure. Computer Integrated Manufacturing Systems
Ž .
1 1 , 25–31.
Suarez, F.F., Cusumano, M.A., Fine, C.H., 1995. An empirical study of flexibility in manufacturing. Sloan Management
Re-Ž .
view 37 1 , 25–32.
Suarez, F.F., Cusumano, M.A., Fine, C.H., 1996. An empirical study of manufacturing flexibility in printed circuit board
Ž .
assembly. Operations Research 44 1 , 223–240.
Swamidass, P.M., Newell, W.T., 1987. Manufacturing strategy, environmental uncertainty and performance: a path analytic
Ž .
model. Management Science 33 4 , 509–524.
Thompson, J., 1967. Organizations in Action. McGraw-Hill, New York.
Upton, D.M., 1995. Flexibility as process mobility: the manage-ment of plant capabilities for quick response manufacturing.
Ž .
Journal of Operations Management 13 3-4 , 205–224. Upton, D.M., 1997. Process range in manufacturing: an empirical
Ž .
study of flexibility. Management Science 43 8 , 1079–1092. Venkatraman, N., 1989. Strategic orientation of business enter-prises: the construct, dimensionality, and measurement.
Man-Ž .
agement Science 35 8 , 942–962.
Venkatraman, N., Grant, J.H., 1986. Construct measurement in organizational research: a critique and proposal. Academy of
Ž .
Management Review 11 1 , 71–87.
Venkatraman, N., Ramanujam, V., 1987. Measurement of busi-ness economic performance: an examination of method
con-Ž .
vergence. Journal of Management 13 1 , 109–122.
Vickery, S.K., Droge, C., Markland, R.E., 1997. Dimensions of¨ manufacturing strength in the furniture industry. Journal of
Ž .
Operations Management 15 4 , 317–330.
Ward, P.T., Duray, R., Leong, G.K., Sum, C., 1995. Business environment, operations strategy, and performance: an empiri-cal study of Singapore manufacturers. Journal of Operations
Ž .
Management 13 2 , 99–115.
Woodward, J., 1965. Industrial organizations: theory and practice. Oxford Univ. Press, London.
Zammuto, R.F., O’Connor, E.J., 1992. Gaining advanced manu-facturing technology benefits: the roles of organization design
Ž .