Miratul Khasanah et al.
* Corresponding author. Tel/Fax : +62-31-5922427 Email address : [email protected]
ENHANCEMENT OF THE SENSITIVITY AND SELECTIVITY OF THE VOLTAMMETRIC
SENSOR FOR URIC ACID USING MOLECULARLY IMPRINTED POLYMER
Miratul Khasanah1,2,*, Mudasir3, Agus Kuncaka3, Eko Sugiharto3, Ganden Supriyanto2, and Siti Wafiroh2
1
Student of Doctoral Program, Department of Chemistry, Faculty of Mathematic and Natural Sciences, Universitas Gadjah Mada
2
Department of Chemistry, Airlangga University
3
Department of Chemistry, Faculty of Mathematics and Natural Sciences, Universitas Gadjah Mada, Sekip Utara, Kotak Pos 21 Bls Yogyakarta, Indonesia 55281
Received August 6, 2010; Accepted September 27, 2010
ABSTRACT
The sensitivity and selectivity of voltammetric sensor for uric acid can be improved by modifying the working electrode using a polymer with a molecular template (molecularly imprinted polymer, MIP). Polymer and MIP was synthesized from methacrylic acid (MAA) as monomer, ethylene glycol dimethacrylic acid (EGDMA) as cross-linker, uric acid (UA) as template and the results were characterized by various methods. The poly-MAA formation was identified by a decrease in the intensity of infrared (IR) spectra at ∼1540 cm-1 (C=C) and an increase at ∼1700 cm-1 (C=O) compared to the IR spectra of the MAA and EGDMA. The SEM analysis showed that the cavity of polymer is small enough (∼ 0.1 µm) and homogeneous. Establishment of MIP was carried out by extracting of the uric acid from the polymer network. The IR spectra of MIP exhibited the decrease in intensity at ∼1700 cm-1 (C=O) compared to the non imprinted polymer (NIP). The data of BET analysis showed that polymer pore size increase slightly from 37.71 Å to 38.02 Å after the extraction process of uric acid from the polymer network. Its may be due to incomplete extraction of uric acid from the polymer network. Modifications of hanging mercury drop electrode using MIP made from MAA, EGDMA, and UA with a mole ratio of 1:3:1 produced a sensitive and selective voltammetric sensor for uric acid. The sensitivity obtained was 16.405 nA L/µg. The presence of ascorbic acid in equal concentration with uric acid decreased the current response of only 0.08%. Compared to HMDE electrode, the sensitivity and selectivity of the HMDE-MIP sensor enhanced about 100 and 700 times, respectively. The detection limit was found to be 5.94 x10⁻¹⁰ M.
Keywords: molecularly imprinted polymer, selectivity, sensitivity, sensor, uric acid
INTRODUCTION
Development of the voltammetric method to analyze uric acid in blood and urine is a very interesting study because determination of uric acid using voltammetric method was interfered by ascorbic acid which is coexisting in blood and urine samples. Using a bare solid electrode such as glassy carbon (GC) or carbon paste (CP), the voltammetric response of uric acid and ascorbic acid tends to occur at close potential and sometimes even overlaping. In addition, the use of bare solid electrodes requires some pretreatments which take a long time before it can be analyzed, and the method could not be used for the analysis of a high acidity solution [1].
Application of a modified solid electrodes for the uric acid analysis have also been carried out, such as the use of gold-modified palladium [2], GC-propionyl choline [3], graphite powder-DNA [4], GC-norepinephrine [5], GC-5-hydroxy tryptophan [6], and GC-CeO2 nanoparticles [7]. Using the modified electrode, the
analysis of uric acid is extremely influenced by the presence of dissolved oxygen resulted from the use of high oxidation potential. Furthermore, the modification of the electrode requires a very complicated procedure, takes a long time and the modified electrode is only able to be used for the analysis of a high concentration of uric acid (mM).
Voltammetric determination of uric acid in urine and serum samples using hanging mercury drop electrode (HMDE) had been studied before. The detection limit obtained was 5.08 µg/L (3.02x10⁻⁸ M) with a sensitivity of 0.1515 nA L/µg [8]. However, the presence of ascorbic acid in equal concentration with uric acid decrease current signal by 63.61% [9].
Miratul Khasanah et al.
al. [11] developed MIP bounded to silica gel as sorbent on solid phase extraction (SPE). Then, the MIP-based SPE was combined with MIP-based sensor and used to determine uric acid using differential pulse cathodic stripping voltammetry (DPCSV). MIP was prepared from melamine and chloranil.
In the recent research the synthesis and characterization of polymers with a molecular template (MIP) have been done. The general principle of molecular imprinting is based on such a process where functional and cross linking monomers are copolymerized in the presence of a target analyte (the imprint molecule) which acts as molecular template. Polymers was made from methacrylic acid (MAA) as monomer, cross-linker ethylene glycol dimethacrylic acid (EGDMA) and initiator 2,2'-azobis isobuthyronitrile (AIBN), while the template was uric acid. Establishment of MIP was carried out by extracting the uric acid from the polymer network. MIP formed was used as materials for coating the hanging mercury drop electrode (HMDE) in order to obtain a sensitive and selective sensor for uric acid determination. With this imprinting system the specific molds will be formed for certain molecules (analyte) so that the analysis of the analyte was not disrupted by the presence of other matrices because the mold will only be appropriate to the species being analyzed.
EXPERIMENTAL SECTION
Materials
Chemicals used were uric acid (UA) (Fluka), methacrylic acid (MAA) and ethylene glycol dimethacrylic acid (EGDMA) (Sigma-Aldrich), 2,2'-azobis isobuthyronitrile (AIBN), dimethylformamide (DMF), chloroform, ethanol, methanol, ascorbic acid (AA), Na-acetate, acetic acid, and ammonium acetate (Merck, Darmstadt, Germany), and high purity N2. The purity of all chemicals is analytical grade (pa). The MAA, EGDMA and AIBN were diluted with chloroform. The stock solution of uric acid 1000 mg/L was prepared by dissolving 0.1000 g uric acid in about 10 mL sodium hydroxide 50% and diluted with ultra high pure (UHP) water until 100 mL in volumetric flask. Working uric acid solutions under 1 mg/L were prepared daily by diluting appropriate working solution. The UHP water was used for preparing other solutions, and their pH were adjusted with the addition of acetate buffer.
Instrumentation
The instrumentations used in this study were 797 Computrace Voltammetry (MVA system-1) which comprises a sample container, stirrer, processor units,
PCs, working electrode HMDE, reference electrode Ag/AgCl and Pt auxiliary electrodes. The other equipments were infrared spectrophotometer (IR) Shimadzu, scanning electron microscopy (SEM), Brunauer Emmet Teller (BET) (Quantachrome, version 2.1), micropipet, pH meters, hot plate and other supporting equipments.
Procedure
Synthesis of the MIP
MIP was prepared by mixing solution of monomer, cross linker (in chloroform), the template and an initiator. In this study, mole of MAA, EGDMA, and uric acid (UA) was controlled at ratio of 1:3:1 (that is the mole ratio that is assumpted at the formation of polymer). The mixture of monomer, cross linker and initiator in the chloroform solvent was heated at 50 °C for three minutes on the hot plate and the uric acid solution was then added. The mixture was heated until a solid polymer formed. The solid polymer crushed to 140 mesh size and washed with chloroform. The uric acid was then extracted from the polymer network by repeatedly washing with 1 M ammonium acetate in ethanol: acetic acid: water = 40:25:35, followed by leaching using acetic acid: ethanol = 1:3 and finally washing with water until free from acetate [12]. The poly-MAA and MIP were heated in the oven at 105 °C for 30 min.
Characterization of MIP
The characterization of polymer and MIP were carried out using infrared spectrophotometer (IR), scanning electron microscopy (SEM) and Brunauer Emmet Teller (BET).
Preparation of the sensor based on MIP
The synthesized MIP was used to modify the HMDE through the electro-coating process. The amount of 20 mg MIP was dissolved in 30 mL DMF, inserted in electrochemical cells and coated to the HMDE for 120 sec in the potential range between +0.4 V and -1.4 V (versus Ag/AgCl). To determine the optimum result, the modified electrode was applied in the analysis of uric acid at pH 5 and the deposition time 120 sec using stripping scan rate of 59.5 mV/sec.
Detection limit (LOD), sensitivity and selectivity of HMDE-MIP sensor
Miratul Khasanah et al.
sensor. The sensor selectivity was studied by the addition of increasing amount of ascorbic acid. The current responses obtained from the analysis of uric acid without and with the addition of ascorbic acid were compared.
RESULT AND DISCUSSION
Synthesis and characterization of MIP
Increasing the selectivity of HMDE was done by modifying the electrode using MIP through the electrocoating process. The polymer was prepared by reacting MAA, EGDMA, and uric acid with mole ratio of 1:3:1. The polymerization reaction is radical reactions. In this research, to assist the formation of polymer, a radical reactions initiator AIBN was added. The reaction
was carried out in chloroform. Initiator AIBN is a highly reactive radical reagent when heated. A very small excessive concentration than required could generate explosion. The obtained polymer was a solid white. Reaction of poly-MAA formation is described in Fig. 1.
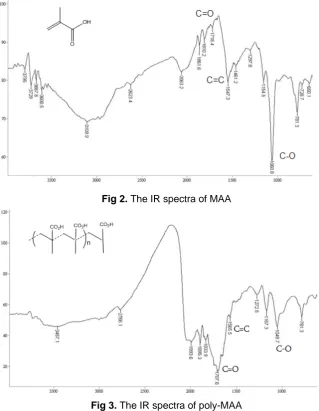
Polymer and MIP were characterized by infrared (IR) spectrophotometry. The IR spectra of MAA and poly-MAA are shown in Fig. 2 and 3, respectively.
Fig 1. Polymerization reaction of poly-MAA
Fig 2. The IR spectra of MAA
Miratul Khasanah et al.
Fig 4. The IR spectra of NIP
Fig 5. The IR spectra of MIP (uric acid has been extracted from the polymer)
Fig 6. Results of the poly-MAA surface analysis using
SEM
The spectra showed that poly-MAA has been formed, marked by the disappearance of IR spectral peak intensity at ∼1540 cm-1 (C=C) and increased intensity at ∼1700 cm-1(C=O). The extraction of uric acid from the polymer chain/ network has also been
conducted. The IR spectra of polymer before (NIP) and after extraction (MIP) of uric acid from polymer network are presented in Fig. 4 and 5, respectively. In the spectra of the NIP, the intensity of the peak at ∼1700 cm-1 is very high, indicating the existence of large number of carbonyl functional groups (C=O) derived from methacrylic acid, EGDMA and uric acid.
Miratul Khasanah et al.
Fig 7. The MIP coating reaction on the HMDE surface
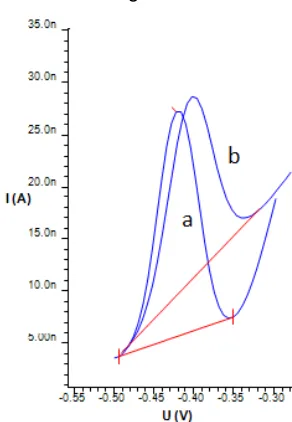
Fig 8. Voltammogram of uric acid (40 µg/L) using (a)
HMDE (Estrip=-0.423 V, i=21.56 nA) and (b) HMDE-MIP (Estrip=-0.417 V, i=13.38 nA)
Fig 9. Calibration curve of uric acid determined by
HMDE-MIP
Coating of MIP to HMDE
MIP that have been synthesized and characterized were dissolved in DMF and then superimposed on HMDE through electrocoating using a potential range from +0.4 V to -1.4 V. Modified electrode was dried by lifting the electrode from the electrochemical cell and flowing the nitrogen gas through for 2 min in the open air. The modified electrode formed was used for the analysis of uric acid standard solution using stripping voltammetry. The voltammogram of uric acid formed
using both HMDE and HMDE-MIP was compared each other.
At a positive potential, no voltammogram of uric acid was obtained, but a voltammogram appeared at the negative potential. The more negative potential the higher current signal produced, but at the negative potential lower than -1.2 V the larger size of HMDE occurred, thus the increase in the current obtained on the stripping step was due to the increasing number of uric acid accumulated at the increasing surface area of electrode. Optimization of MIP coating potential on HMDE surface was done simultaneously with the optimization of uric acid accumulation potential on the HMDE-MIP. The optimum potential for MIP coating and uric acid preconcentration was found to be -1 V (versus Ag/AgCl). Reaction of the polymer coating on the surface of the electrode at negative potential is estimated to proceed according to equation given in Fig. 7.
The peak potential of uric acid obtained from analysis using HMDE-MIP showed no shift as compared to the peak potential using HMDE. However, the voltammogram obtained using the HMDE-MIP has a wider baseline and was not horizontal (sloping) (see Fig. 8).
The results of the MIP coating optimization and uric acid preconcentration showed that the current signal using the HMDE-MIP was smaller than that using bare HMDE (decrease around 38%). Possible reason for the lower signal is due to the existence of polymers attached on the electrode surface, causing the decrease in the mercury electrode surface area.
The sensitivity and detection limit
The sensitivity of the sensor and the detection limit of the method were studied by analyzing uric acid standard solution in the concentration range of 0.2-1.0 µg/L using HMDE-MIP. The result obtained is shown in Fig. 9. A very good linearity of response currents expressed by the regression equation y = 16.405x + 20.169 with correlation coefficient (r) of 0.9963. The sensitivity of the method was found to be 16.405 nA L/µg that is about 100 times higher than that obtained using bare HMDE [9]. The detection limit obtained from this study is 0.094 µg/L (5.60x10⁻¹⁰ M), which is low enough for the analysis of uric acid in the natural sample.
The selectivity of HMDE-MIP sensor
Miratul Khasanah et al.
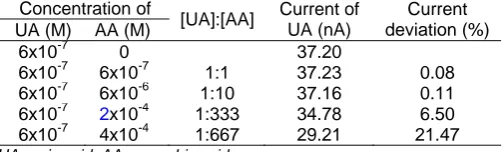
Table 1. Deviation of uric acid current on the ratio of uric
acid and ascorbic acid concentration
Concentration of
samples. Using HMDE, the presence of ascorbic acid in equal concentration with uric acid decreased the current response of 63.61% [9]. The high interference is caused by the competition of uric acid and ascorbic acid diffusion to the mercury electrode surface during the accumulation process. In this study, to determine the selectivity of the uric acid sensor developed by modifying HMDE using MIP technique, the interference of ascorbic acid on determination of the uric acid by the modified sensor has been studied. The influence of ascorbic acid on uric acid determination is shown in Table 1.
Ascorbic acid has not significantly interfered on the uric acid determination using HMDE-MIP. The presence of ascorbic acid in equal concentration with uric acid decreased the current response of only 0.08%. This shows that using the imprinting system, the selectivity of the electrode toward uric acid is about 700 times than using bare HMDE [9]. The cavity formed at the HMDE-MIP only fits with the analyte being analyzed, so the presence of the excess of ascorbic acid relatively does not affect uric acid determination.
CONCLUSION
The successful preparation of poly-MAA was marked by the changes in peak intensity of IR spectra at ∼1700 cm-1 (C=O) and ∼1540 cm-1 (C=C). The SEM characterization shows that the cavity of poly-MAA was relatively small and homogeneous. The BET data showed that the extraction of uric acid from the polymer network was not completely accomplished. However, modification of electrodes with a MIP prepared using mole ratio of MAA, EGDMA and UA of 1:3:1 produces a sensitive and selective sensor for uric acid. The sensitivity obtained using this method was 16.405 nA L/µg. The selectivity of sensor toward uric acid in the presence of ascorbic acid is very high. The presence of ascorbic acid in equal concentration with uric acid decreased the current response of only 0.08%. Compared to HMDE electrode, the sensitivity and selectivity of the HMDE-MIP sensor enhanced about 100 and 700 times, respectively. The detection limit of the
method was found to be 5.94x10⁻¹⁰ M, which is still low enough for the purpose of uric acid determination in natural samples such as blood serum.
ACKNOWLEDGEMENT
The first author would like to acknowledge the Airlangga University for financial support of this research through the Program Hibah Kompetisi and the Riset Strategis Nasional 2009 and for providing any facilities.
REFERENCES
1. John, S.A., 2005, J. Electroanal. Chem., 579, 249– 256.
2. Matos, R.C., Augelli, M.A., Lago, C.L., and Angnes L, 2000, Anal. Chim. Acta, 404, 151–157.
3. Qin Lin, X., and Ping Jin, G., 2005, Electrochim.
Acta, 50, 3210–3216.
4. Luo, J.W., Zhang, M., and Pang, D.W., 2005, Sens.
Actuators B, 106, 358-362.
5. Zare, H.R., Memarzadeh, F., Ardakani, M.M., Namazian, M., and Golabi, S.M., 2005,
Electrochim. Acta, 50, 3495–3502.
6. Lin, X., and Li, Y., 2006, Electrochim. Acta, 51, 5794–5801.
7. Wei, Y., Li, M., Jiao, S., Huang, Q., Wang, G., and Fang, B., 2006, Electrochim. Acta, 52, 766–772. 8. Khasanah, M., Supriyanto, G., Handajani, U.S.,
Fitriana, M., and Asmaningrum, W., 2007, Analysis
of Uric Acid in Urine and Serum with Voltammetry Stripping using Hanging Mercury Drop Electrode,
Proceeding of the ICOWOBAS, Airlangga University, Surabaya, Indonesia, 6-7th August 2007, 307–311.
9. Khasanah, M., Supriyanto, G., Roheni, I., Mudasir, Kuncaka, A., and Sugiharto, E., 2009, The
Influence of Ascorbic Acid on Uric Acid Determination in Serum and Urine with Stripping Voltammetry using Hanging Mercury Drop Electrode, Proceeding of the 2nd International Seminar ICOWOBAS-RAFSS, Universiti Teknologi Malaysia, Johor, Malaysia, 2nd – 4th June 2009, 94– 99.
10. Lakshmi, D., Sharma, P., and Prasad, B.B., 2007,
Biosens. Bioelectron., 22, 3302–3308.
11. Prasad, B.B., Sharma, P.S., and Lakshmi, D., 2007, J. Chromatogr. A, 1173, 18–26.
12. Moral, N.P., and Mayes, A.G., 2004, Anal. Chim.