Full Terms & Conditions of access and use can be found at
http://www.tandfonline.com/action/journalInformation?journalCode=cbie20
Download by: [Universitas Maritim Raja Ali Haji] Date: 18 January 2016, At: 19:59
Bulletin of Indonesian Economic Studies
ISSN: 0007-4918 (Print) 1472-7234 (Online) Journal homepage: http://www.tandfonline.com/loi/cbie20
INDONESIA'S CHANGING ECONOMIC GEOGRAPHY
Hal Hill , Budy P. Resosudarmo & Yogi Vidyattama
To cite this article: Hal Hill , Budy P. Resosudarmo & Yogi Vidyattama (2008) INDONESIA'S CHANGING ECONOMIC GEOGRAPHY, Bulletin of Indonesian Economic Studies, 44:3, 407-435, DOI: 10.1080/00074910802395344
To link to this article: http://dx.doi.org/10.1080/00074910802395344
Published online: 06 Nov 2008.
Submit your article to this journal
Article views: 594
View related articles
ISSN 0007-4918 print/ISSN 1472-7234 online/08/030407-29 © 2008 Indonesia Project ANU DOI: 10.1080/00074910802395344
INDONESIA’S CHANGING ECONOMIC GEOGRAPHY
Hal Hill, Budy P. Resosudarmo and Yogi Vidyattama* Australian National University
Indonesia’s regional socio-economic data base extends over 30 years, so it is now possible to draw conclusions about regional development dynamics since the 1970s. We examine economic growth, inequality, convergence, structural change, demo-graphic dynamics and social indicators over this period. There continues to be great diversity in economic and social outcomes, but growth and social progress have been remarkably even: the poorest regions, located mainly in Eastern Indonesia, have generally performed about as well as the national average. The better per-forming regions include those that are the most ‘connected’ to the global economy. In this respect, Jakarta stands out, growing richer than the rest of the country over time. As expected, confl ict is harmful to economic development. There is no clear
natural resource story: the performance of the resource-rich provinces has varied considerably.
INTRODUCTION
With its 13,000 islands, Indonesia is the world’s largest archipelagic state, and one of the most spatially diverse nations on earth in its resource endowments, population settlements, location of economic activity, ecology and ethnicity. There are about 350 identifi ed ethnic groups. In the early 2000s, per capita regional product in the richest province, East Kalimantan, was around 16 times that in the poorest, Maluku. Poverty incidence ranged from 3.4% of the population in Jakarta to 42% in Papua.
The country’s regional development patterns are therefore of great analytical and policy interest. Indonesia is formally a unitary state, but all national govern-ments have had to deal with major regional development challenges. The coun-try’s international boundaries have changed three times since independence, with the formal entry of Papua (then known as Irian Barat) in 1969, and the entry and later exit of East Timor in 1976 and 1999 respectively. Sub-national boundaries have changed frequently.
While national economic fortunes and policies explain much about local devel-opment outcomes, regional responses to international and domestic events inevita-bly vary. Four examples briefl y illustrate this proposition. First, the 1970s oil boom disproportionately benefi ted the country’s four resource-rich provinces, even though a large part of the windfall gains accrued to the central government (which
* We thank Ross McLeod, Chris Manning, two anonymous referees and seminar partici-pants at the Australian National University for helpful comments on an earlier draft, and Terry Hull for advice on the demographic and social data base.
in turn ‘recycled’ much of it throughout the nation) and to oil companies, both foreign fi rms and the state-owned Pertamina. Second, the major policy reforms of the 1980s resulted in rapid export-oriented industrialisation, concentrated mainly on Java and Bali, and this in turn boosted the economic fortunes of these islands. Third, the economic crisis of 1997–98 particularly affected the modern sector con-struction, fi nance and import-substituting manufacturing industries and, since these are located mainly on Java (particularly Jakarta and West Java), these regions experienced the sharpest decline in economic activity after the crisis. Fourth, the decentralisation program begun in 2001 has transferred considerable fi nancial resources and administrative authority from the centre to the third-level tiers of government—districts (kabupaten) and municipalities (kota). As implementation proceeds, this is likely signifi cantly to alter Indonesia’s economic geography.
While much has been written on various aspects of regional development in Indonesia, there are two reasons to revisit the issue. First, it has only been pos-sible to measure and quantify regional trends accurately since the mid-1970s. Development dynamics are a long-term phenomenon, involving decades rather than years, and we are only now in a position to analyse Indonesia’s regional economic, social and demographic development over three decades. The second motivation has to do with the renaissance of regional economics and regional science in recent years. Traditionally regarded as inhabiting the backwaters of the profession, ‘new economic geography has come of age’ in the words of Neary (2001), especially following the intellectual fusion between international trade and geography articulated by Krugman (1991).
A key insight from this literature concerns the interaction between the inter-national economy and local development patterns. As countries remove regula-tory impediments to the cross-border fl ow of goods, services, capital, technology and people, those regions most connected to the global economy—by dint of loca-tion, infrastructure and enabling institutions—are likely to grow the most quickly. In countries where domestic infrastructure lags, or where there are regulatory bar-riers to domestic commerce, these internationally oriented regions may become in effect enclaves, more connected to the global economy than to the hinterland. As a corollary, to the extent that national economic policies—openness, macro-economic management—are tending to converge around the world, local-level governance and institutions are likely to become increasingly important determi-nants of regional development outcomes.
There are numerous unresolved issues in this new economic geography litera-ture. For example, is the notion of convergence (reduction in disparity over time) as relevant to intra-country development as it is to international comparisons? In turn, are the variables that are presumed to be important determinants of national growth rates also relevant to an understanding of regional (sub-national) growth? Is there empirical support for the Williamson (1965) conjecture of a Kuznets-type relationship between regional inequality and national development?
At a policy level, too, much remains unresolved. A generally accepted notion might be that regional policy is anything that affects the allocation of resources across regions. If this is the case, then regional policy, formally defi ned, is likely to have a relatively minor impact on regional dynamics. For example, of the four key events mentioned above in the Indonesian context, only one—the decentrali-sation program—was an example of explicit regional policy. There are also many
different modalities of regional policy, ranging from formula-driven allocation of fi nancial resources through to specifi c delegations of authority from central governments, and a range of region-specifi c programs such as those targeting so-called by-passed regions.
This paper addresses the following issues, each of which constitutes a section of the paper. First, we provide an overview of Indonesia’s changing regional eco-nomic geography, examining how the location of ecoeco-nomic activity and provin-cial economic rankings have changed since the 1970s. We also consider whether regional price variations affect these conclusions. Next, we investigate patterns of regional economic growth and structural change, examining regional growth dynamics and investigating the inter-relationships between growth, structural change and demographic factors, and between social and economic indicators. The following section examines convergence and inequality, looking both at the relationship between initial incomes and subsequent growth and at the various measures of convergence. These results are compared with convergence estimates for other countries. In the fi nal section we summarise our main fi ndings.
To address these issues, we have assembled a large regional data base from vari-ous series held by Indonesia’s central statistics agency (BPS-Statistics Indonesia). These data are discussed in detail below, but we note here three general points. First, the analysis is conducted at the provincial level and is based on a standard set of 26 provinces. These are the 27 provinces that existed for most of the Soeharto era, excluding East Timor. Since 2000, there has been considerable fragmentation (pemekaran) of provincial boundaries, and so it is necessary to adjust the published data back to the pre-2000 provincial boundaries.1 We have also resisted the tempta-tion to conduct the analysis at the third (kabupaten and kota) administrative level. The data series for third-level units span a shorter time period than those for prov-inces (generally from the late 1980s) and since 2000 the fragmentation of district boundaries has proceeded much more quickly than that of provinces.2
Second, refl ecting data constraints, our story commences in the 1970s, the period when reliable regional socio-economic data became available (Arndt 1973). In the case of demographic and related data, the starting point is the 1971 population census, while the regional accounts effectively commence in 1975.
Third, apart from consolidating the provincial data set back to the pre-2000 boundaries (specifi cally 1998), we have not undertaken further analysis for dif-ferent geographical confi gurations. Like international boundaries, sub-national divisions are often arbitrary constructs, and do not necessarily bear any relation to what may be termed ‘natural economic zones’. In particular, Jakarta is unique in that it is the only province consisting only of a city, with virtually no surrounding rural area. Indeed, ‘Greater Jakarta’ spills over the border into West Java province and, for that reason, it might be useful to amalgamate these two provinces. We have chosen not to do so in this paper, however, not least because the resulting ‘mega province’ would still be unique, albeit in different ways.
1 Thus, for example, ‘West Java’ refers to the currently existing provinces of West Java and Banten, and ‘North Sulawesi’ to North Sulawesi and Gorontalo.
2 For example, between 1997 and 2006, the number of provinces rose from 26 (excluding East Timor) to 33, but the number of third-level governments increased from 341 to more than 456.
INDONESIA’S ECONOMIC GEOGRAPHY: AN OVERVIEW
In this section, we address the following questions. Where are the principal loca-tions of economic activity, and have they changed over time? Which provinces have the highest level of economic welfare and have these rankings changed over time? Are the answers to the latter questions sensitive to the selection of economic welfare measures, and do regional price differentials make a difference?
In the Indonesian context, there are two relevant measures of regional economic activity and three indicators of economic welfare. There is no ‘true’ measure of economic activity and welfare, as each indicator measures a different concept. We therefore examine the three series described below. Each of these measures can be considered a proxy for income, and for the sake of brevity we often use the term ‘income’ in the discussion to refer to one or more of the measures.
The activity measures are gross regional (domestic) product (GRP) and GRP excluding mining, in particular oil and gas. The non-mining GRP measure is fre-quently employed in Indonesia owing to the presence of extractive activities that signifi cantly infl uence measured local economic activity but have much less effect on local economic and social welfare. This difference between the two series arises because a large proportion of the returns to extractive activities accrue to extra-provincial entities, principally the central government and foreign and domes-tically owned mining companies. With the introduction of the decentralisation measures in January 2001, regions now receive a higher proportion of mining rev-enue, and thus the differences between the welfare measures might be expected gradually to narrow over time.3
In principle, the output of any ‘enclave’ activity might be deducted from GRP to provide a better indication of local economic activity and welfare. In practice, the choice is to deduct oil and gas or mining. Other resource-based activities, notably forestry, are substantially more labour intensive and hence have larger local employ-ment and income spin-offs. Some mining activities are also quite labour intensive (e.g. small-scale gold mining), and therefore perhaps do not need to be deducted from GRP. But in practice the distinction is inevitably somewhat arbitrary.
In this paper, we employ GRP and non-mining GRP. The latter is selected in preference to non-oil and gas GRP for two reasons. First, the non-mining GRP series is available for a longer period: it begins in 1975, while the non-oil series begins only in 1983.4 Second, the difference between the non-mining and non-oil series is not large, because oil and gas are the major component of Indonesian mining output, accounting for 68% of mining value added in 2004. The only prov-ince with a very large non-oil mining sector is Papua.
In addition to GRP and non-mining GRP, we use estimates of household con-sumption expenditure (CE) as a measure of economic welfare. The latter are available for a shorter period, since 1983. They are particularly useful for com-puting poverty estimates. CE estimates would not be regarded as superior to
3 Commencing in January 2001, regional governments receive 80%, 15% and 30% of the government’s net returns from timber, gas and oil revenues, respectively. Most of these rev-enues fl ow to kabupaten and kota rather than to provinces. Since 2002, special arrangements
have been in place for the province of Papua, whereby it receives 80%, 70% and 70% of net returns from timber, gas and oil revenues respectively.
4 For simplicity, we henceforth use the phrase ‘non-oil’ to refer to ‘non-oil and gas’.
GRP estimates—by defi nition they exclude personal saving and government con-sumption and saving, which are included in GRP—but rather they provide an additional dimension. This series would be expected to correlate more closely with non- mining GRP than with total GRP.
We present the regional accounts data at three points of time, 1975 (1983 for the CE data), 1990 and 2004. These correspond to important periods in Indonesia’s recent economic history: respectively, the early years of the oil boom; the year in which the major post oil-boom policy reforms were introduced; and the year in which income per capita nationally returned to pre-crisis levels.
Major concentrations of economic activity
It is convenient initially to divide the country into fi ve major island groupings, Java–Bali, Sumatra, Kalimantan, Sulawesi and Eastern Indonesia.5 Java dominates Indonesia’s economy, with its GRP in 2004 contributing almost 60% of the coun-try’s total gross domestic product (GDP), while non-mining GRP and household expenditure constituted 64% and 66% of the respective national totals. Sumatra comes next, with 22%, 20% and 20%. Kalimantan has 9%, 8% and 5%, Sulawesi 4% on all measures, and the eastern provinces around 3% (table 1).
Over time, and regardless of the measure used, there has been a clear shift of economic activity towards Java–Bali, and in particular the national capital, Jakarta. Jakarta generated one-sixth of Indonesian GDP in 2004, double its share in 1975. Jakarta’s share of non-mining GDP has also increased signifi cantly since 1975, though not as fast. The capital accounts for virtually all of the increase in the Java–Bali share of GDP, and for more than 100% of the increase in non-min-ing GDP. That is, the Java–Bali share excludnon-min-ing Jakarta is stable for the total GRP series, while declining slightly for the other two series. In fact, the increase in the capital’s share is under-stated, as some of its growth has spilled over the border to West Java, the only other province in the group with an increased share of GDP. The three big Java provinces—Jakarta, West Java and East Java—account for half of Indonesia’s GDP and a slightly higher share of non-mining GDP.
Sumatra’s share of non-mining GDP and household expenditure has been sta-ble at 20–21%. Its share of total GDP has been declining, owing to the falling share of oil and gas in the national economy, and refl ected in the declining shares for the island’s main producers, Riau and Aceh. The two largest Sumatra economies have been Riau with mining included and North Sumatra in the case of non-mining GRP. Riau is a particularly unusual regional economy, with a large oil enclave, a cash crop economy, a relatively wealthy capital city and a strong export-oriented manufacturing and service economy in the islands adjacent to Singapore.6 Thus, although its share of national GDP has declined since 1975 owing to the oil effects, its share of national non-mining GDP (and household expenditure) has more than doubled since 1990, the fastest increase in the country for this period.
5 There are various defi nitions of ’Eastern Indonesia’, ranging from the grouping used
here (the eastern islands other than Bali, Sulawesi and Kalimantan) to a broader one in-cluding these islands. The current offi cial defi nition comprises Kalimantan, Sulawesi and
all the eastern islands except Bali.
6 The province was sub-divided in 2004, with the offshore islands becoming the province of Riau Islands.
Also of note is the fact that the three southern provinces of Sumatra—South Sumatra, Bengkulu and Lampung—have been slipping. In 2004 their combined share of non-mining GDP was about two-thirds of that in 1975. Evidently, their proximity to stronger economies to their south and north has not had a growth spill-over effect. Lampung in particular is a special case. It was historically seen as a solution to Java’s alleged problems of over-population and poverty, but since the 1970s its economic performance has lagged behind that of Java. In response to its lagging economic and social progress, in the mid-1980s it was no longer desig-nated as an offi cial transmigrant-recipient province, although of course ‘sponta-neous migration’ has continued.
The largest and most dynamic regional economy in Kalimantan is that of East Kalimantan, with its large oil, gas and timber resources. Downstream industrial processing has provided a further boost, while since 2001 the decentralisation program has further enriched kabupaten Kutai Kartanegara, which has the nation’s highest per capita GRP. Both GRP series are however a misleading indicator of the region’s living standards, as indicated by the much lower share of household expenditure. Nevertheless, the latter is growing quickly, rising almost 50% as a proportion of the national total since 1990.
The share of the eight eastern-most provinces in the national economy is grad-ually declining. This generalisation applies to the largest regional economy in the east, South Sulawesi, and to the east’s traditionally most prosperous region, North Sulawesi. The share of Maluku, the site of the country’s most serious reli-gious confl ict, is now less than one-third of its 1975 fi gure. The only exceptions to this picture of declining shares are the two small Sulawesi provinces (Central and Southeast Sulawesi), boosted by in-migration; West Nusa Tenggara, which recently experienced a major mining expansion; and Papua, where household expenditure has risen since 1990, refl ecting the combined effects of the mining boom and special government programs.7
Provincial economic rankings
We examine these rankings with reference to the three measures discussed above. All data are normalised around the national average of 100. There is large varia-tion in inter-provincial income and welfare, and evidence of both continuity and change in these rankings (table 2). In 2004, the gap between the richest and poor-est provinces was very large; its size varies according to which series is used. The ratio of the richest to poorest is 15.9 for per capita GRP (East Kalimantan:Maluku), 14.7 for per capita non-mining GRP (Jakarta:Maluku), and 11.3 for household expenditure (Jakarta:West Nusa Tenggara).
The fi rst three columns indicate how the inclusion of mining infl ates the regional per capita GRP estimates for the resource-rich regions, especially in the earlier years. For example, in the case of Riau, GRP per capita was seven times higher than non-mining GRP in 1975. By 2004, these effects were much smaller. The total GRP series was about 24% higher than the non-mining series in Aceh, 37% higher in Riau (and higher by a similar margin in West Nusa Tenggara owing to its recent mining expansion), 48% higher in East Kalimantan, and 77%
7 In 2002, following the introduction of special autonomy measures, the budget of the Papuan provincial government was three times its 1999/2000 level in nominal terms.
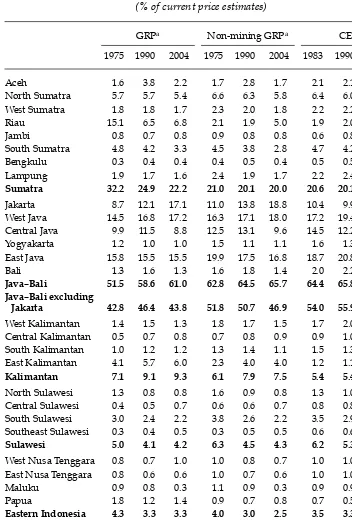
TABLE 1 Provincial GRP, Non-mining GRP and Consumption Expenditure: Shares of National Totals
(% of current price estimates)
GRPa Non-mining GRPa CEb
1975 1990 2004 1975 1990 2004 1983 1990 2004
Aceh 1.6 3.8 2.2 1.7 2.8 1.7 2.1 2.1 0.9
North Sumatra 5.7 5.7 5.4 6.6 6.3 5.8 6.4 6.0 5.4 West Sumatra 1.8 1.8 1.7 2.3 2.0 1.8 2.2 2.2 1.8 Riau 15.1 6.5 6.8 2.1 1.9 5.0 1.9 2.0 5.5 Jambi 0.8 0.7 0.8 0.9 0.8 0.8 0.6 0.8 0.9 South Sumatra 4.8 4.2 3.3 4.5 3.8 2.8 4.7 4.2 3.6 Bengkulu 0.3 0.4 0.4 0.4 0.5 0.4 0.5 0.5 0.4 Lampung 1.9 1.7 1.6 2.4 1.9 1.7 2.2 2.4 1.6
Sumatra 32.2 24.9 22.2 21.0 20.1 20.0 20.6 20.1 20.2
Jakarta 8.7 12.1 17.1 11.0 13.8 18.8 10.4 9.9 16.5 West Java 14.5 16.8 17.2 16.3 17.1 18.0 17.2 19.4 19.0 Central Java 9.9 11.5 8.8 12.5 13.1 9.6 14.5 12.2 10.4 Yogyakarta 1.2 1.0 1.0 1.5 1.1 1.1 1.6 1.3 0.9 East Java 15.8 15.5 15.5 19.9 17.5 16.8 18.7 20.8 19.3
Bali 1.3 1.6 1.3 1.6 1.8 1.4 2.0 2.2 1.3
Java–Bali 51.5 58.6 61.0 62.8 64.5 65.7 64.4 65.8 67.4 Java–Bali excluding
Jakarta 42.8 46.4 43.8 51.8 50.7 46.9 54.0 55.9 51.0
West Kalimantan 1.4 1.5 1.3 1.8 1.7 1.5 1.7 2.0 1.3 Central Kalimantan 0.5 0.7 0.8 0.7 0.8 0.9 0.9 1.0 0.9 South Kalimantan 1.0 1.2 1.2 1.3 1.4 1.1 1.5 1.3 0.9 East Kalimantan 4.1 5.7 6.0 2.3 4.0 4.0 1.2 1.1 1.6
Kalimantan 7.1 9.1 9.3 6.1 7.9 7.5 5.4 5.4 4.6
North Sulawesi 1.3 0.8 0.8 1.6 0.9 0.8 1.3 1.0 0.7 Central Sulawesi 0.4 0.5 0.7 0.6 0.6 0.7 0.8 0.8 0.8 South Sulawesi 3.0 2.4 2.2 3.8 2.6 2.2 3.5 2.9 2.4 Southeast Sulawesi 0.3 0.4 0.5 0.3 0.5 0.5 0.6 0.6 0.5
Sulawesi 5.0 4.1 4.2 6.3 4.5 4.3 6.2 5.3 4.4
West Nusa Tenggara 0.8 0.7 1.0 1.0 0.8 0.7 1.0 1.0 0.7 East Nusa Tenggara 0.8 0.6 0.6 1.0 0.7 0.6 1.0 1.0 0.7 Maluku 0.9 0.8 0.3 1.1 0.9 0.3 0.9 0.9 0.4 Papua 1.8 1.2 1.4 0.9 0.7 0.8 0.7 0.5 1.5
Eastern Indonesia 4.3 3.3 3.3 4.0 3.0 2.5 3.5 3.3 3.3
INDONESIA 100.0 100.0 100.0 100.0 100.0 100.0 100.0 100.0 100.0
(Rp trillion) 11.9 188.3 2,202.9 9.5 165.1 1,996.0 34.0 82.5 1,182.1
a GRP = gross regional product.
b CE = (household) consumption expenditure.
Source: BPS, Regional Income of Provinces in Indonesia by Industrial Origin, various years; Regional Income of Provinces in Indonesia by Expenditure, various years.
higher in Papua. In the fi rst and last of these provinces, non-mining GRP had fallen below the national average.
We therefore develop our main story around the non-mining GRP series, which excludes the enclave mining effects. We identify what may be termed ‘consistently wealthy’ and ‘consistently non-poor’ regions (those close to the national average), ‘very poor’ provinces and those that have experienced a signifi cant change in relative incomes.
‘Consistently wealthy’ provinces
There are two really wealthy provinces, Jakarta and East Kalimantan. By 2004, Jakarta was by far the richest province as measured by non-mining GRP per capita, at about four times the national average and with more than double the wealth of the third richest province (Riau). Jakarta has been becoming relatively richer, especially since 1990. This is notwithstanding fi rst, the 1980s liberalisa-tions, which reduced the regulatory powers of the capital; second, the decentrali-sation of 2001, which transferred resources and funds to the regions; and third, the 1997–98 crisis, which affected Jakarta more severely than any other province apart from West Java (Akita and Alisjah bana 2002).
East Kalimantan’s per capita non-mining GRP is always at least three times the national average, indicating that its economic wealth extends well beyond the mining enclaves. However, its household expenditure suggests that community living standards are much closer to the national average than the GRP data sug-gest. About 60% of East Kalimantan’s non-mining GRP comes from oil and gas processing industries. These are relatively capital-intensive activities, and much of the return on these investments accrues to entities outside the province.
Riau, the third wealthiest province, is generally well above the national aver-ages for both GRP series. Its fortunes declined sharply during the 1980s as the oil boom subsided, resulting in its income and expenditure being close to the national average. However, strong growth in the islands close to Singapore, com-bined with export-oriented cash crops on the mainland, resulted in its being the third richest province in 2004 according to both series.
‘Consistently non-poor’ provinces
A second group of provinces may be termed ‘consistently poor’, with non-mining GRP per capita at least 85% of the national average. This includes the tra-ditionally strongest agricultural exporter, North Sumatra, the frontier province of Central Kalimantan, the country’s two major industrial provinces, West and East Java, the major tourist region of Bali, and West Sumatra, where both agriculture and a range of services are important. Aceh would have belonged in this group until recently, but the protracted confl ict until 2005, combined with the devasta-tion of the 2004 tsunami, has sharply lowered living standards: its 2004 household expenditure was just under half the national average.
‘Very poor’ provinces
At the other extreme are the poor provinces, with a non-mining GRP ratio of about half the national average or less. They are all located in the east. The two Nusa Tenggara provinces are consistently poor, and evidently slipping further behind, from just over half the national average in the non-mining GRP series in 1975 to
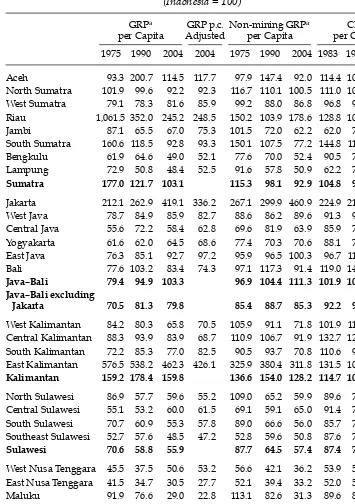
TABLE 2 Provincial GRP, Non-mining GRP and Consumption Expenditure per Capita (Indonesia = 100)
GRPa
per Capita
GRP p.c. Adjusted
Non-mining GRPa
per Capita
CEb
per Capita
1975 1990 2004 2004 1975 1990 2004 1983 1990 2004
Aceh 93.3 200.7 114.5 117.7 97.9 147.4 92.0 114.4 108.9 49.5 North Sumatra 101.9 99.6 92.2 92.3 116.7 110.1 100.5 111.0 104.9 92.3 West Sumatra 79.1 78.3 81.6 85.9 99.2 88.0 86.8 96.8 96.1 87.6 Riau 1,061.5 352.0 245.2 248.5 150.2 103.9 178.6 128.8 106.0 198.0 Jambi 87.1 65.5 67.0 75.3 101.5 72.0 62.2 62.0 72.5 75.9 South Sumatra 160.6 118.5 92.8 93.3 150.1 107.5 77.2 144.8 119.2 100.5 Bengkulu 61.9 64.6 49.0 52.1 77.6 70.0 52.4 90.5 75.7 56.3 Lampung 72.9 50.8 48.4 52.5 91.6 57.8 50.9 62.2 70.2 48.4
Sumatra 177.0 121.7 103.1 115.3 98.1 92.9 104.8 98.4 93.9
Jakarta 212.1 262.9 419.1 336.2 267.1 299.9 460.9 224.9 214.3 403.0 West Java 78.7 84.9 85.9 82.7 88.6 86.2 89.6 91.3 97.7 94.8 Central Java 55.6 72.2 58.4 62.8 69.6 81.9 63.9 85.9 76.7 69.4 Yogyakarta 61.6 62.0 64.5 68.6 77.4 70.3 70.6 88.1 78.2 59.7 East Java 76.3 85.1 92.7 97.2 95.9 96.5 100.3 96.7 114.3 115.2 Bali 77.6 103.2 83.4 74.3 97.1 117.3 91.4 119.0 143.9 82.5
Java–Bali 79.4 94.9 103.3 96.9 104.4 111.3 101.9 106.5 114.2 Java–Bali excluding
Jakarta 70.5 81.3 79.8 85.4 88.7 85.3 92.2 97.8 92.7
West Kalimantan 84.2 80.3 65.8 70.5 105.9 91.1 71.8 101.9 113.0 62.2 Central Kalimantan 88.3 93.9 83.9 68.7 110.9 106.7 91.9 132.7 122.5 86.7 South Kalimantan 72.2 85.3 77.0 82.5 90.5 93.7 70.8 110.6 90.9 59.3 East Kalimantan 576.5 538.2 462.3 426.1 325.9 380.4 311.8 131.5 104.0 123.3
Kalimantan 159.2 178.4 159.8 136.6 154.0 128.2 114.7 106.3 79.2
North Sulawesi 86.9 57.7 59.6 55.2 109.0 65.2 59.9 89.6 75.6 51.9 Central Sulawesi 55.1 53.2 60.0 61.5 69.1 59.1 65.0 91.4 79.9 67.5 South Sulawesi 70.7 60.9 55.3 57.8 89.0 66.6 56.0 85.7 75.3 61.4 Southeast Sulawesi 52.7 57.6 48.5 47.2 52.8 59.6 50.8 87.6 78.6 49.8
Sulawesi 70.6 58.8 55.9 87.7 64.5 57.4 87.4 76.3 59.0
West Nusa Tenggara 45.5 37.5 50.6 53.2 56.6 42.1 36.2 53.9 51.5 35.8 East Nusa Tenggara 41.5 34.7 30.5 27.7 52.1 39.4 33.2 52.0 53.2 38.5 Maluku 91.9 76.6 29.0 22.8 113.1 82.6 31.3 89.6 84.6 38.5 Papua 226.8 126.8 123.5 106.0 111.1 72.8 69.7 84.3 54.0 126.2
Eastern Indonesia 78.1 58.2 54.6 72.5 53.6 40.8 64.1 58.5 54.3
INDONESIA 100.0 100.0 100.0 100.0 100.0 100.0 100.0 100.0 100.0 100.0
(Current Rp ‘000) 91 1,051 10,421 72 922 9,443 216 461 5,592
a GRP = gross regional product; data are based on current prices, except GRP adjusted (adjusted by
relative prices calculated by Nashihin 2007).
b CE = (household) consumption expenditure.
Source: BPS, Regional Income of Provinces in Indonesia by Industrial Origin, various years; Regional Income of Provinces in Indonesia by Expenditure, various years.
33–36% in 2004. Maluku, the most serious case of confl ict since 1998, has fallen sharply over the same period, from above the national average (in non-mining GRP per capita) to one-third of it. Southeast Sulawesi, the poorest province on this island, was about half the national fi gure in all series in 2004.
Provinces ‘slipping behind’
A number of provinces have slipped signifi cantly in their rankings in both the non-mining GRP and the expenditure series for all or part of the period. These are mainly traditional agricultural exporters that have not been able to capitalise on initial advantages. Examples include South Sumatra, Jambi (non-mining GRP only), Bengkulu (all in south-central Sumatra); West and South Kalimantan; North and South Sulawesi; and resource-rich Papua (though its household expenditure rose between 1990 and 2004). A particularly pronounced decline is observable in Lampung, historically seen as the solution to Java’s ‘population problem’. In 2004, its values in all three series were less than half those of Java–Bali. Central Java and Yogyakarta have also slipped in non-mining GRP and household expendi-ture, although not as much as the others in this group. This is such a heterogene-ous group of provinces as to render hazardheterogene-ous any attempt at a common set of explanations. Perhaps the most important observation is that they generally lack a major, internationally oriented engine of growth. We return to this issue shortly.
These inter-provincial rankings shed much light on Indonesian regional dynam-ics. In the fi rst three decades of Indonesian independence, Java was regarded as the country’s most serious development challenge, with the island ‘asphyxiating for want of land’ in the memorable phrase of Keyfi tz (1965: 503). By contrast, in spite of their poorer human and physical infrastructure, the resource-rich regions in the ‘Outer Islands’ were considered to have less poverty and better develop-ment prospects. However, from the 1980s a different picture emerges. The major economic policy reforms increased the relative profi tability of export-oriented manufacturing and related higher-value services, which are located mainly on Java–Bali. Declining commodity prices adversely affected many off-Java regions. Thus, Sumatra’s ranking on all three series declined signifi cantly. It had been overtaken by Java–Bali by 1990 in both non-mining GRP and expenditure, and was below the national average for these series in 1990 and 2004.
Do regional price variations matter?
The relativities in table 2 are measured at current prices and make no allowance for inter-provincial variations in prices. These are known to be large in Indonesia, refl ecting its vast and unusual geography, the limited spread of infrastructure, and barriers to inter-regional commerce. The non-mining GRP and household expenditure series are also interpreted as indicators of relative living standards, and therefore should be adjusted for price differentials.
We lack detailed, time-consistent inter-provincial price data, but Nashihin (2007) provides the most comprehensive set of estimates.8 We use these esti-mates to adjust our 2004 data on total GRP per capita (see the ‘GRP p.c. Adjusted’
8 The fi rst systematic set of regional price estimates was prepared by Arndt and Sundrum
(1975) but, as these are not comparable with the Nashihin (2007) estimates, we are restrict-ed to adjusting the 2004 data. Our defl ators are derived from the regional accounts, and are
column in table 2). As would be expected, the richer and more remote provinces have higher living costs. Thus Jakarta’s relative income in 2004 falls signifi cantly when adjusted for local prices, from 4.2 to 3.4 times national average GRP per capita. East Kalimantan’s falls from 4.6 to 4.3 (and Central Kalimantan’s also falls substantially), while in Papua the fall is from 1.24 to 1.06. Elsewhere, the effects are mixed and not signifi cant. The relative incomes of Central and East Java and Yogyakarta rise somewhat, while some poor remote provinces such as Maluku become even poorer.
The 1975–2004 regional GRP defl ators for each province (available from the authors on request) show that prices have risen more rapidly in Jakarta than in any other province, hence infl ating its relative income in the current price series. Thus, on balance, regional income differentials narrow, but only slightly, except for the special case of Jakarta. It is important to note in any case that the price data are necessarily approximate, and that they refer only to prices in provincial capitals.
GROWTH, STRUCTURAL CHANGE AND SOCIAL CORRELATES Patterns of regional economic growth
We now examine provincial economic growth rates over the same periods and for the same series. Since population growth rates vary considerably, we calculate both total and per capita growth rates, showing the latter in table 3 for all three series.
Total Indonesian GDP grew at an annual average rate of 5.6% from 1976 to 2004. Java–Bali, Kalimantan and Sulawesi grew faster than the national average, which was pulled down by Sumatra. Eastern Indonesia grew at the same rate as the national average. The Sumatran fi gure is depressed by the special case of Riau. In the non-mining series, the national average growth rate was 6.4%, and so too (very nearly) was that of Sumatra, Java and Sulawesi. Kalimantan grew slightly faster and Eastern Indonesia a little more slowly. The growth rates for household expenditure were also fairly similar.
Population growth has generally been higher in the richer and ‘frontier’ regions (see below, table 4). On a GRP per capita basis, Java–Bali was the fastest growing region between 1976 and 2004, with a growth rate of 4.9%, followed by Sulawesi at 4.5% (table 3). Here, too, Sumatra, at 1.6%, was pulled down by the oil sector. In the case of growth in non-mining GRP per capita, there is a relatively even growth pattern across island groupings: Java–Bali was the only major region to grow (slightly) faster than the national fi gure of 4.6%. Kalimantan and Sulawesi were just below it, followed by Sumatra, with Eastern Indonesia 0.9 percentage points below the average. The growth rates of per capita household expenditure are similarly quite even.
It is not easy to identify obvious groupings and characteristics of provinces based on growth rates. The fastest growth (in GRP per capita) over the period 1976–2004 occurred in Bali, West Nusa Tenggara, West Sumatra, Jakarta, Central Java and North Sulawesi. The slowest rates were recorded in Riau, Papua, South Sumatra, Maluku, East Kalimantan and Jambi. Thus the fast growers included
therefore based mainly on wholesale prices, whereas the Nashihin estimates include both wholesale and consumer price data.
both small and large provinces, ‘central’ and remote locations, and regions with initially high and low per capita incomes. The only common element appears to be the absence of a major resource sector, whereas this is a feature of all but one (Maluku) of the slow growers.
For a more detailed examination, we focus on the non-mining per capita series, which is arguably the most accurate indicator of provincial economic performance. The fastest growing provincial economy by a signifi cant margin (1.1 percentage points over its nearest competitor) has been Bali. Also in the high-growth group (at least 5%) are Southeast Sulawesi,9 Jakarta and West Sumatra. A further four prov-inces are just above the average: North Sumatra, West and Central Java, and North Sulawesi.
Conversely, a number of provinces have grown at a rate at least a percentage point slower than the national average. These are Papua and Maluku in the east, and Riau, Jambi and South Sumatra in Sumatra. The remaining 13 provinces grew close to but slower than the national average.
The picture differs for the shorter (and not directly comparable) CE per capita series. The fastest growing provinces from 1984 to 2004 were East Java, North Sulawesi, East Nusa Tenggara, West Sumatra and Central Java. The slowest growth was recorded in Yogyakarta, Southeast Sulawesi, Riau, Bali and Bengkulu.
The story also differs by sub-periods. Aceh’s non-mining GRP grew very fast from 1976 to 1990 as its gas production came on stream, but very slowly after 1990 as confl ict increasingly affected economic activity, and as a consequence of lower energy prices. Similarly, East Kalimantan slowed down in the second period of lower energy prices and slower timber exploitation. In fact, Kalimantan experi-enced the greatest growth deceleration among the major island groupings in this period, owing mainly to these two factors, principally the fi rst. Bali’s exceptionally rapid non-mining GRP growth also slowed, but was still above average after 1990.
By contrast, some provinces that grew more slowly than the national average in the fi rst period recorded above-average non-mining GRP growth rates in the sec-ond. This appears to be especially the case for a number of export-oriented econo-mies, which benefi ted from the 1980s reforms and which weathered the economic crisis better than other regions. Examples include the predominantly agricultural producers, North, West and South Sumatra (the latter the only province actually to grow faster in the second period than in the fi rst), Lampung, all of Sulawesi except the southeast, and the industrial province of West Java.
Although in aggregate growing more slowly than the national average, the four Eastern Indonesia provinces experienced mixed fortunes. Maluku’s growth was severely affected by confl ict. East Nusa Tenggara grew a percentage point faster than the national average in the second period, and West Nusa Tenggara at about the average. Papua’s growth was dependent on commodity prices, but its house-hold expenditure grew at almost the national rate in the second period.
9 The very high growth rates of small provinces like Southeast Sulawesi in the earlier period need to be interpreted with great caution. The statistical infrastructure was still rudimentary then, and the transition from subsistence to a monetary economy may have infl ated measured growth rates. The regional accounts for Papua were similarly very
ap-proximate.
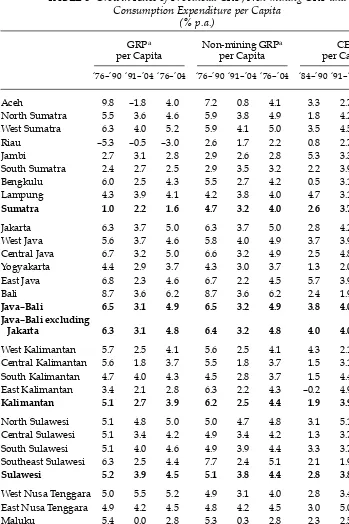
TABLE 3 Growth Rates of Provincial GRP, Non-mining GRP and Consumption Expenditure per Capita
(% p.a.)
GRPa
per Capita
Non-mining GRPa
per Capita
CEb
per Capita
‘76–’90 ‘91–’04 ‘76–’04 ‘76–’90 ‘91–’04 ‘76–’04 ‘84–’90 ‘91–’04 ‘84–’04
Aceh 9.8 –1.8 4.0 7.2 0.8 4.1 3.3 2.7 2.9
North Sumatra 5.5 3.6 4.6 5.9 3.8 4.9 1.8 4.2 3.4 West Sumatra 6.3 4.0 5.2 5.9 4.1 5.0 3.5 4.5 4.2 Riau –5.3 –0.5 –3.0 2.6 1.7 2.2 0.8 2.7 2.1
Jambi 2.7 3.1 2.8 2.9 2.6 2.8 5.3 3.3 3.9
South Sumatra 2.4 2.7 2.5 2.9 3.5 3.2 2.2 3.9 3.3 Bengkulu 6.0 2.5 4.3 5.5 2.7 4.2 0.5 3.1 2.2 Lampung 4.3 3.9 4.1 4.2 3.8 4.0 4.7 3.1 3.6
Sumatra 1.0 2.2 1.6 4.7 3.2 4.0 2.6 3.7 3.3
Jakarta 6.3 3.7 5.0 6.3 3.7 5.0 2.8 4.2 3.7 West Java 5.6 3.7 4.6 5.8 4.0 4.9 3.7 3.9 3.9 Central Java 6.7 3.2 5.0 6.6 3.2 4.9 2.5 4.8 4.0 Yogyakarta 4.4 2.9 3.7 4.3 3.0 3.7 1.3 2.0 1.8 East Java 6.8 2.3 4.6 6.7 2.2 4.5 5.7 3.9 4.5
Bali 8.7 3.6 6.2 8.7 3.6 6.2 2.4 1.9 2.1
Java–Bali 6.5 3.1 4.9 6.5 3.2 4.9 3.8 4.0 3.9 Java–Bali excluding
Jakarta 6.3 3.1 4.8 6.4 3.2 4.8 4.0 4.0 4.0
West Kalimantan 5.7 2.5 4.1 5.6 2.5 4.1 4.3 2.1 2.9 Central Kalimantan 5.6 1.8 3.7 5.5 1.8 3.7 1.5 3.1 2.5 South Kalimantan 4.7 4.0 4.3 4.5 2.8 3.7 1.5 4.4 3.4 East Kalimantan 3.4 2.1 2.8 6.3 2.2 4.3 –0.2 4.9 3.2
Kalimantan 5.1 2.7 3.9 6.2 2.5 4.4 1.9 3.9 3.2
North Sulawesi 5.1 4.8 5.0 5.0 4.7 4.8 3.1 5.1 4.4 Central Sulawesi 5.1 3.4 4.2 4.9 3.4 4.2 1.3 3.7 2.9 South Sulawesi 5.1 4.0 4.6 4.9 3.9 4.4 3.3 3.7 3.6 Southeast Sulawesi 6.3 2.5 4.4 7.7 2.4 5.1 2.1 1.9 1.9
Sulawesi 5.2 3.9 4.5 5.1 3.8 4.4 2.8 3.8 3.5
West Nusa Tenggara 5.0 5.5 5.2 4.9 3.1 4.0 2.8 3.4 3.2 East Nusa Tenggara 4.9 4.2 4.5 4.8 4.2 4.5 3.0 5.0 4.3 Maluku 5.4 0.0 2.8 5.3 0.3 2.8 2.3 2.5 2.4
Papua 0.3 3.1 1.6 2.7 2.6 2.6 1.5 3.7 2.9
Eastern Indonesia 3.2 3.7 3.4 4.5 2.7 3.7 2.7 4.1 3.6 INDONESIA 4.8 3.0 3.9 6.0 3.1 4.6 3.4 3.9 3.7
a GRP = gross regional product.
b CE = (household) consumption expenditure.
Source: BPS, Regional Income of Provinces in Indonesia by Industrial Origin, various years; Regional Income of Provinces in Indonesia by Expenditure, various years.
There are several cases of provinces growing faster than the national average (table 3) but slipping in the relative income rankings (table 2). North Sulawesi grew faster than the Indonesian average between 1976 and 2004, but its relative non-min-ing GRP per capita fell very sharply, from 109% to 60% of the national average. East Nusa Tenggara grew at about the national average, but its income fell from 52% of the national average to just 33%. There are also converse cases, such as Riau, whose non-mining per capita growth in this period was less than half the national average, but whose relative income rose. These cases are presumably the result of local terms-of-trade effects—that is, of local economies specialising in production of goods and services whose prices have risen faster or more slowly than the general price level (or specifi cally the national accounts defl ator). This is confi rmed, for example, in the case of North Sulawesi: if constant rather than current prices are used, its per capita income ranking rises considerably. It is also apparent from the regional defl ators: Maluku and North Sulawesi have the country’s lowest fi gures.
There are no obvious correlates among the fast growers in the non-mining series. Just two of them (Jakarta and North Sumatra) had above-average incomes in 1975. The explanations for fast growth in Jakarta and Bali are relatively straightforward— seat of government effects, global connections and high-value services and industry in the former, and tourism and resultant spill-overs in the latter. In West and Central Java, export-oriented industrialisation, especially in West Java from the mid-1980s, and the earlier agricultural successes from the mid-1970s, especially in Central Java, were important. North Sumatra has a strong agricultural base, and was tradition-ally the most industrialised province outside Java.
West Sumatra and North Sulawesi had traditionally strong agricultural bases and quite good education records. But both are somewhat distant from the main centres of commerce, and neither has had a ‘booming sector’. West Sumatra’s service sector growth is probably connected to high levels of inward remittances, as a result of its long history of mainly male out-migration. In the case of North Sulawesi, tourism, shipping and agro-processing (based mainly on coconuts and fi sheries) have all done quite well (Sondakh and Jones 2003). More recently, its tolerance of diverse religions and ethnicities has reportedly attracted investment from neighbouring confl ict-prone regions.
Are these regional growth differences amenable to quantitative explanation? There is a large literature attempting to explain international differences in growth rates, but much less has been written on inter-regional differences. Can one draw on the former to help explain the latter? Within a country, it is reasonable to assume something approaching perfect factor mobility and homogeneous nation-wide institutions. Moreover, regions within a country have the same macroeconomic environment and trade regime, and generally operate within the same institutional context (for example, within a common legal system). Hence the answer might be thought to be no. However, institutions clearly do differ among regions in many countries, and factor and product markets in developing countries are often poorly integrated. Further, as a growing literature has argued, growth concepts can be pro-ductively employed in a modifi ed form;10 for example, ‘open’ can be redefi ned to mean ‘connected’ (to the global economy).
10 See for example Barro and Sala-I-Martin (1991) and Rey and Montouri (1999).
The international evidence suggests, fi rst, that regions that are closely connected to the global economy are likely to grow more quickly. This seems to fi t the story for Jakarta, Bali and, in recent times, Riau (at least the islands adjacent to Singapore).11 These are arguably the regions most connected to the global economy, in terms of facilitating physical infrastructure, trade in goods and services and the move-ment of people. It is signifi cant that they have all grown quickly as Indonesia has become more open. A second factor is clustering and increasing returns to scale, as forward and backward linkages develop and spill over from growth centres. The best example in the Indonesian context is probably the rapid industrialisation in West Java since 1980 around the periphery of Jakarta. A third factor is the quality of regional institutions and governance. The evidence on this for Indonesia is mixed and incomplete. We lack reliable long-term estimates of any ‘quality’ variables, and in any case the provinces have enjoyed signifi cant political authority only since the decentralisation of 2001, while local-level democracy has arrived even more recently. Undeniably, though, since 2001 regional differences in administrative quality, including ease of doing business, have mattered more than was previously the case. Finally, the indifferent record of the four resource-rich provinces is sugges-tive of a Sachs and Warner (2001) ‘resource curse’ at work. However, two of the four have experienced very serious confl ict, and most of the resource wealth (at least until 2001) accrued to entities outside the province. Furthermore, there is suffi cient diversity within this group to caution against sweeping generalisations. Two of the provinces, East Kalimantan and Riau, have become increasingly prosperous.
Growth and structural change
Indonesia was a predominantly agrarian economy in the mid-1970s. Refl ecting this, agriculture accounted for more than one-third of GRP in 21 of the 26 provinces in 1975; in 10 of the provinces it accounted for at least half. By 2004, only eight provinces were above the one-third threshold. Thus, consistent with the well-known hypoth-esis linking economic growth and structural change, there has been a rapid shift out of agriculture. The provinces that have been slow to make this transition either are among the poorest in the country (Maluku, Southeast and Central Sulawesi, East Nusa Tenggara) or have a very strong comparative advantage in agriculture (Cen-tral Kalimantan, Jambi), or a combination of both (Lampung, Bengkulu).
Conversely, no province had a share of manufacturing in GRP in excess of 20% in 1975. By 2004, seven provinces registered shares greater than 20%: the three big Java provinces dominated, particularly West Java, with 43%. Off Java, the higher shares are found in Riau (owing principally to industrial spill-over from Singapore), the two Sumatran provinces with large agricultural/industrial processing sectors (North and South Sumatra) and East Kalimantan with its timber processing and oil-related fertiliser and heavy industries. There has been only one signifi cant case of ‘de-industrialisation’, in Jakarta, where the manufacturing share in 2004 was little over half the 1985 fi gure because factories had migrated across the border.
There has also been a general increase in the services sector share. In 1975 there were just two provinces in which services contributed at least one-half of GRP. By 2004, fi ve provinces were in this group, and several more were close to it. Only
11 These islands have become a separate province only since decentralisation, so it is not possible to estimate separately their longer-term growth rate.
resource-rich Riau, Papua and East Kalimantan recorded a share below 25% of GRP. Interestingly, high and/or increased services sector shares have occurred in a variety of development contexts. Land-scarce Jakarta has always had the highest services sector share, as the seat of national government, the provider of high-value commercial services and the national transport and communication hub. There are high shares in Bali and Yogyakarta, refl ecting their status as leading tourism and education centres, respectively. The services share is high in West Sumatra too, refl ecting the traditional importance of remittances in that province. But it is also high in poorer and/or more remote regions, including Maluku, East Nusa Tenggara and North Sulawesi. For the poorer regions, the explanation has more to do with a relatively large government sector, because fi scal transfers have been weighted in their favour. Higher transport shares in remote regions may also be a factor.
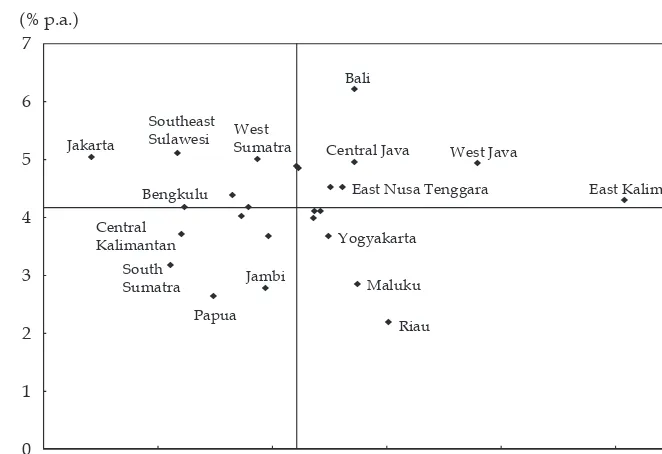
Theory also predicts a positive association between economic growth and the speed of structural change. We test this by calculating a simple index of structural change between the agriculture, industry (defi ned to include mining, utilities, man-ufacturing and construction) and services sectors for each province.12 The index is calculated for both the 3-sector and the 9-sector national accounts classifi cations, and the results are generally not sensitive to level of disaggregation. Figure 1 presents a simple plot of growth and the relevant index. There appears to be quite a weak
12 Structural change index = sharei
04sharei75 i
; i = agriculture, industry, services. FIGURE 1 Structural Change and Growth of Non-mining GRP per Capita,
1975–2004a
a See footnote 12 for the structural change index.
Source: Author’s own calculation based on BPS data in Regional Income of Provinces in Indonesia by Industrial Origin, 1975, 1990 and 2004; Regional Income of Provinces in Indonesia by Expenditure, 1983, 1990 and 2004.
correlation between growth and structural change. In the case of non- mining GRP, the fastest structural change has occurred in a diverse group of provinces: East Kali-mantan (refl ecting the resource boom and spill-overs); West Java (rising industriali-sation); Riau (the resource boom plus Singapore-related industrialiindustriali-sation); Maluku; Bali (tourism growth); and Central Java. The correlation between growth and struc-tural change is somewhat stronger if mining is included in the analysis.
Demographic dynamics
Indonesia’s regional demographics correlate with these economic changes.13 The country’s demographics refl ect the interplay of four main factors: highly uneven ‘initial conditions’ in the patterns of spatial settlement; the uneven location of opportunities for employment, economic advancement and education, which in turn trigger migration; offi cial migration policy (a factor especially in the period 1970–85); and the speed of the demographic transition towards low fertility and mortality. Table 4 highlights these patterns over the period 1971–2000. The popula-tion is heavily concentrated on Java–Bali, although this region’s share of the napopula-tional population is declining in aggregate and in all provinces except Jakarta and West Java. Sumatra and Kalimantan have been gaining most of the declining Java–Bali population share, while the share of Sulawesi and Eastern Indonesia (excluding Papua) has been constant over the three decades.
Provincial population growth is a combination of natural increase and net migration, so low population growth could be due to a very fast decline in fertility, or continuing high mortality, or out-migration. The percentage of the population born outside the province gives a reasonably accurate indication of the extent of in-migration. The major magnets are predictably those provinces that offer opportunities for socio-economic advancement. Thus they tend to be the richer ones or the frontier regions. Jakarta is quintessentially a migrant city, as it always has been, with by far the highest proportion of migrants in the country. There were also very high migrant shares in 2004 in resource-rich, frontier East and Central Kalimantan, almost all of southern Sumatra (because of proximity to Java and employment opportunities), Central and Southeast Sulawesi, and Papua. Yogyakarta, a major education centre, has the second-highest in-migrant share for Java–Bali after Jakarta.
Social correlates of economic indicators
How do economic and social indicators correlate, both across provinces and over time?14 Table 5 gives a summary picture, showing a health indicator (infant mor-tality), an education indicator (average years of schooling) and the share of the population below the poverty line. The fi rst two are based on the 1971 and 2000 population censuses, while the poverty estimates are available only from 1984.
Two general points deserve emphasis. First, there are dramatic improvements in the social indicators: by 2000, infant mortality was just a third of the 1971 rate, while average years of schooling had risen almost three-fold. Moreover, these improvements have been experienced practically throughout the country.
13 For analyses of Indonesian regional demographics, see Hugo et al. (1987); Jones and Hull (1997); and Muhidin (2002).
14 For studies of Indonesian social outcomes at the regional level, see Ananta (2003); Balisacan, Pernia and Asra (2003); and UNDP (2004).
TABLE 4 Demographic Indicators
Population (% of total)
Growth of Population (% p.a.)a
Born Outside Region
(%)
1971 2000 1971–00 1971 2000
Aceh 1.7 2.0 2.4 3.1 5.8
North Sumatra 5.5 5.6 1.9 8.3 3.9
West Sumatra 2.3 2.1 1.5 1.0 5.8
Riau 1.4 2.3 3.7 13.0 32.3
Jambi 0.8 1.2 3.1 15.9 23.5
South Sumatra 2.9 3.8 2.8 9.7 13.9
Bengkulu 0.4 0.8 3.9 7.0 22.7
Lampung 2.3 3.3 3.1 36.2 22.3
Sumatra 17.4 21.0 2.5
Jakarta 3.8 4.1 2.1 40.1 42.4
West Java 18.2 21.5 2.5 1.8 11.5
Central Java 18.3 15.2 1.2 1.2 2.3
Yogyakarta 2.1 1.5 0.8 4.1 12.3
East Java 21.4 17.0 1.1 1.2 2.2
Bali 1.8 1.5 1.4 1.1 7.0
Java–Bali 65.6 60.9 1.6
West Kalimantan 1.7 1.8 2.1 1.2 7.2
Central Kalimantan 0.6 0.9 3.3 5.6 23.5
South Kalimantan 1.4 1.5 2.0 3.9 12.1
East Kalimantan 0.6 1.2 4.2 7.2 35.0
Kalimantan 4.3 5.4 2.6
North Sulawesi 1.4 1.4 1.7 2.9 6.2
Central Sulawesi 0.8 1.0 2.8 5.6 18.4
South Sulawesi 4.3 3.8 1.4 1.4 3.5
Southeast Sulawesi 0.6 0.9 3.2 3.6 20.7
Sulawesi 7.1 7.1 1.8
West Nusa Tenggara 1.9 1.9 1.9 1.6 2.8
East Nusa Tenggara 1.9 1.9 1.7 0.6 2.8
Maluku 0.9 0.9 1.8 4.0 7.5
Papua 0.8 1.0 2.9 22.5 19.6
Eastern Indonesia 5.5 5.7 2.0
INDONESIA 100.0 100.0 1.9 4.9 10.1
(million) 119.3 203.9
aGeometric average. In-migration is calculated from average (arithmetic) annual recent migration.
Source: BPS, Population census, 1971 and 2000; Papua and Aceh data for 2000 have been re-estimated by BPS.
TABLE 5 Social Indicators
Infant Mortality Rate (deaths per ’000
population)
Average Schooling (years)
Poverty (% of population)
1971 2000 1971 2000 1984 2002
Sumatra
Aceh 143 40 2.3 6.0 14.3 29.8
North Sumatra 121 44 2.7 6.1 22.6 15.8
West Sumatra 152 53 2.6 5.6 23.8 11.6
Riau 146 48 1.8 6.0 29.1 13.6
Jambi 154 53 1.9 5.3 27.7 13.2
South Sumatra 155 53 1.9 5.3 34.1 21.1
Bengkulu 167 53 1.6 5.5 16.7 22.7
Lampung 146 48 1.6 5.1 54.5 24.1
Java–Bali
Jakarta 129 25 4.0 8.4 13.7 3.4
West Java 167 59 1.9 5.5 19.4 12.6
Central Java 144 44 1.4 5.0 37.9 23.1
Yogyakarta 102 25 2.3 6.6 30.1 20.1
East Java 120 48 1.6 5.1 29.1 21.9
Bali 130 36 1.4 5.9 34.4 6.9
Kalimantan
West Kalimantan 144 57 1.1 4.3 47.0 15.5
Central Kalimantan 129 48 2.3 5.4 29.4 11.9
South Kalimantan 165 70 1.9 5.1 22.4 8.5
East Kalimantan 104 40 2.0 6.3 37.7 12.2
Sulawesi
North Sulawesi 114 37 2.9 6.0 26.7 17.4
Central Sulawesi 150 66 2.4 5.3 45.7 24.9
South Sulawesi 161 57 1.9 4.9 24.7 15.9
Southeast Sulawesi 167 53 1.4 4.9 29.1 24.2
Eastern Indonesia
West Nusa Tenggara 221 89 1.0 3.9 53.8 27.8 East Nusa Tenggara 154 57 1.9 4.0 52.9 30.7
Maluku 143 66 2.7 5.6 31.7 26.6
Papua 86a 57 4.2a 4.3 27.2 41.8
INDONESIA 145 47 1.9 5.4 29.5 18.2
Coeffi cient of variation 0.184 0.262 0.357 0.164 0.362 0.439
a Urban areas only.
Sources: As for table 4; for poverty, Miranti (2007).
Although the rankings have not changed signifi cantly, in all but one case infant mortality rates have at least halved, and years of schooling have doubled. The one exception is Papua, for which the early data series are incomplete. There is also broad-based decline for the shorter time series of poverty estimates. Here too, Papua goes against the trend, partly owing to data weaknesses, but also refl ecting the unequal nature of its development. Aceh is the only other province where poverty has increased, and this is due to the effects of prolonged confl ict.
Second, coeffi cients of variation (CVs) among provinces are low, but there is no clear trend in them. The health and education CVs are very low, well below those of the regional accounts (income and consumption) series. They refl ect the fact that, as with inter-country comparisons, inter-provincial social inequalities are lower than economic inequality. The poverty CV is higher, and this is to be expected since it is generated from the consumption expenditure estimates. There is a slight increase in the poverty and health CVs, while for education they fall. These trends are unsurprising, and the latter in particular refl ects the government’s emphasis on universal mass primary and lower secondary education since the 1970s.
There are now several estimates of Human Development Indices (HDI) for Indonesian provinces. Although not presented here, they show the expected positive relationship between non-mining GRP per capita and HDI, albeit with much clustering close to the averages. Jakarta stands out with the highest value on both measures, while the Nusa Tenggaras and Papua are among the lowest. There are several provinces with below-average income per capita but above-average HDI. The two major cases are North Sulawesi and Yogyakarta, both with traditionally strong educational achievement. Interestingly, there are no cases of above-average (non-mining) GRP per capita but below-average HDI. This suggests that the resource-rich provinces (with the possible exceptions of Papua and Aceh noted above) have been reasonably successful at translating the benefi ts of the resource booms into improved social indicators. One qualifi cation that needs to be attached to these conclusions is that all the provincial HDIs thus far prepared include an income or expenditure variable, typically with a weight of one-third, thus limiting their value as an independent check on economic and social correlates.
REGIONAL INEQUALITY AND CONVERGENCE
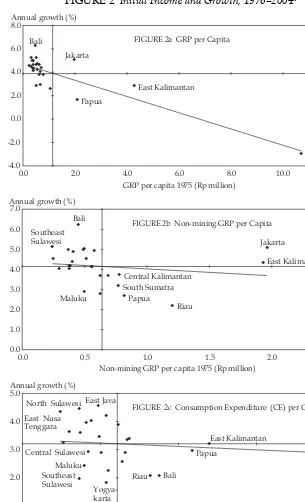
We now use a ‘four-quadrant’ graphic representation to explore the relationship between initial (i.e. 1975) levels of per capita GRP and per capita GRP growth over the period 1976–2004 (fi gure 2a). This provides a convenient picture of the likeli-hood of per capita incomes converging or diverging over time. In 1975, only four provinces had above-average GRP per capita—East Kalimantan, Jakarta, Papua and Riau. Of these, only Jakarta subsequently grew at above the national average. Conversely, of the 22 provinces with below-average per capita GRP in 1975, only three—Jambi, South Sumatra and Maluku—grew at a rate noticeably slower than the national average. Thus, in total GRP terms, most provinces were in either the ‘above-average growth/below-average initial income’ category, or the converse, suggesting that inter-provincial inequality was declining over this period. Many provinces were in fact very close to the national average growth rate. We shortly test this formally with reference to convergence estimates.
F
GRP per capita 1975 (Rp million) FIGURE 2a GRP per Capita
FIGURE 2 Initial Income and Growth, 1976–2004a
F
Non-mining GRP per capita 1975 (Rp million) Central Kalimantan
FIGURE 2b Non-mining GRP per Capita
F
CE per capita 1983 (Rp million) East Kalimantan
FIGURE 2c Consumption Expenditure (CE) per Capita
a The national average growth rates and base year per capita data used here differ from those reported
in tables 3 and 2 respectively, because simple (unweighted) averages and alternative constant price series were used here. The fi tted line in each graph is derived from the regression equation y&
i=+yi0, where y&i = annual growth of income per capita of province i, and yi0= initial income per capita of
province i (in 1975 for GRP and non-mining GRP, in 1983 for expenditure).
Source: As for fi gure 1.
When mining is excluded, the story changes somewhat (fi gure 2b). Only two of the seven provinces with above-average non-mining GRP in 1975 also registered above-average growth between 1976 and 2004: Jakarta and (just barely) East Kali-mantan. Although there are fi ve provinces in the below-average initial income/ slow growth quadrant for the non-mining GRP series, all but one is close to one or other of the national averages. The one exception is the special case of Maluku.
In the case of the expenditure series (fi gure 2c), six provinces are in the bottom left quadrant, that is, poor and apparently slipping behind: Bengkulu, Yogyakarta, West Kalimantan, Maluku, Central Sulawesi and Southeast Sulawesi. Again, most of these are very close to one or other national average. The latter three are fur-thest inside the quadrant, and therefore are the regions of greatest interest from the point of view of regional equity.
Methodology
We now examine the evidence on inequality and convergence, with reference to the two usual measures, β convergence—that is, whether poorer provinces are catching up to richer ones—and σ convergence, an overall measure of inequal-ity. With regard to the former, we focus only on absolute β convergence, since an analysis of conditional convergence merits a separate paper.15
Growth theory predicts that absolute β convergence is more likely to apply across regions than among countries, principally because regions offer fewer barriers to mobility and display less variation in policies and institutions. However, much depends on centre–region policies, particularly concerning fi scal arrangements (Sala-I-Martin 1996a).
Formally, β convergence is the partial correlation between income growth and its initial value. That is,
lnyit−lny*=eβtlnyio−eβtlny*=eβt(lnyio−lny*), where
yit= income per capita at time t in region i; yio= initial income per capita in region i; and
y* = steady state income per capita.
The growth trajectory is estimated in its reduced form as ln(yit/yio) /t=α+(eβ−1) lnyio+ut,
where
α=(1−eβt) (lnyio−lny*).
The second concept, σ convergence, employs a measure of standard deviation. A lower value simply indicates a smaller variation in inter-regional income. The most common measure, widely used in growth economics, is the variance of the log value of income per capita, that is
2= (lny
ilny) 2
i=1 n
1
n
15 Conditional β convergence is the result achieved if one or more of the variables that are presumed to infl uence regional growth (e.g. education, infrastructure, institutional
qual-ity) is controlled for (Barro and Sala-I-Martin 1995).
where
yi= income per capita in region i;
y= average income per capita;
n = number of regions.
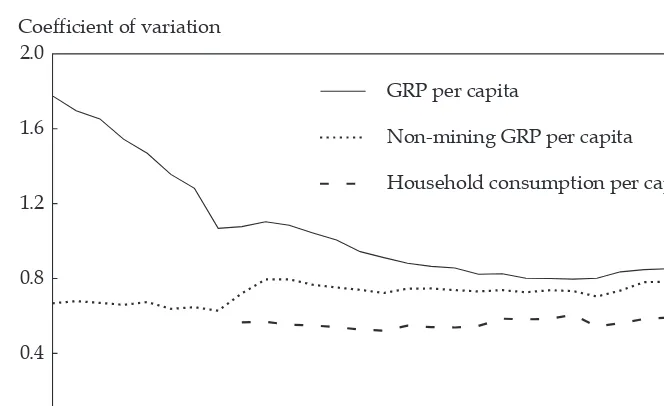
Alternative measures include the coeffi cient of variation (popularised in the regional economics literature by Williamson 1965) and the Theil index of inequality. In this paper, following Williamson, we employ coeffi cients of variation. The results are generally similar across series.16
Although measuring different phenomena, the β and σ convergence con-cepts are related. The major difference concerns the object of measurement: σ
convergence is concerned with the shape of the distribution over time, while β
convergence is concerned with the mobility of variables within the distribution (Sala-I-Martin 1996b). Absolute β convergence is a necessary but not suffi cient condition for σ convergence. It is impossible to narrow the distance between two ends of a distribution if the poorer economy is not growing faster than the richer. Nevertheless, even if the poorer economy is growing faster, the distance between the two ends of the distribution may still not narrow. If, for example, a poorer region grows faster than a rich one and so becomes the richer of the two regions, the distance between the two points may in the end remain the same. In such a case, the shape of the distribution is unchanged but the distribution of regions within it has altered. If this occurs then technically there will be absolute β con-vergence without σ convergence.
The Indonesian evidence
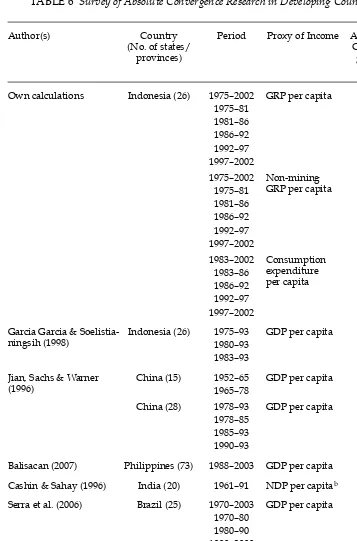
We report here estimates of provincial growth rates relative to initial (i.e. 1975) incomes—that is, indicators of the presence or absence of absolute β convergence (table 6). These extend the fi rst estimates for Indonesia by Garcia Garcia and Soe-listianingsih (1998), who found both absolute and conditional convergence of pro-vincial GRP for the period 1983–93. For GRP per capita, we fi nd a β coeffi cient of 1.5% for the period 1975–2002, suggesting that the observed disparity between initial and steady state incomes would halve over 46 years. The results are statisti-cally highly signifi cant.
However, these fi ndings are sensitive to the period of analysis, as they are heavily infl uenced by the very high incomes in the resource-rich provinces in 1975, and the declining relativities since, as the oil and gas sector has become less important. The pace of β convergence varies signifi cantly across develop-ment periods. It was quite rapid (2%) during the oil boom (1975–81), with the coeffi cient signifi cant at 5%. This is to be expected, with oil-rich provinces such as Riau and East Kalimantan having high initial incomes but slower growth over the period. The process of convergence accelerated still further after oil prices fi rst stabilised and then collapsed, with a coeffi cient of 2.8% for the years 1981– 86, presumably refl ecting the impact of the major policy reforms. It was also positive, though slower, for the other series. As the export-oriented reforms took hold, the speed of convergence slowed, to 1.7% for the period 1986–92, and fur-ther still during the 1990s, to just 1%. During the crisis and post-crisis period
16 See for example Akita and Lukman (1995) for earlier Indonesian estimates.