Morphometric and Phylogenic Analysis of Six Population
Indonesian Local Goats
A. Batubaraa, b, #,*, R. R. Noora, #, A. Farajallahc, #, B. Tiesnamurtid, & M. Doloksaribub
aDepartment of Animal Production and Technology, Graduate School, Bogor Agricultural University bIndonesian Goat Research Institute
Sei Putih, Galang 20585, North Sumatera, Indonesia
cDepartment of Biology, Faculty of Mathemetic and Natural Science, Bogor Agricultural University
#Jln. Agatis, Kampus IPB Darmaga, Bogor 16680, Indonesia dCentral Research Institute for Animal Science
Jln. Veteran III, Desa Banjarwaru, Ciawi Bogor 16002, Indonesia (Received 29-10-2010; accepted 25-03-2011)
ABSTRAK
Tujuan penelitian adalah untuk mengkarakterisasi ukuran-ukuran tubuh (morfometrik) dan jarak genetik antara enam populasi kambing lokal Indonesia. Analisis morfometrik dan kanonikal dilakukan untuk mengetahui hubungan kekerabatan dan ukuran tubuh yang dominan untuk me-nentukan pengelompokan pada kambing Benggala (n=96), Marica (n=60), Jawarandu (n=94), Kacang (n=217), Muara (n=30), dan Samosir (n=42). Analisis diskriminan digunakan untuk mengelompokkan parameter bobot badan dan ukuran-ukuran tubuh. Hasil penelitian menunjukkan bahwa bobot badan dan ukuran-ukuran tubuh (panjang badan, tinggi pundak, lebar dada, tinggi pundak, lingkar dada, tinggi dan lebar tengkorak, panjang dan lebar ekor, panjang dan lebar telinga) pada kambing Muara lebih tinggi (P<0,05) dibandingkan dengan populasi kambing lainnya, dan paling rendah pada kambing Marica. Jarak genetik paling dekat terdapat pada kambing Marica dan Samosir (11,207) dan paling jauh pada kambing Muara dan Benggala (255,110). Tingkat kesamaan paling tinggi antar individu dalam populasi dijumpai pada kambing Kacang (99,28%) dan paling rendah pada kambing Samosir (82,50%). Analisis kanonikal menunjukkan bahwa ukuran tubuh paling dominan sebagai pembeda antar enam populasi kambing lokal yang diamati antara lain: lingkar kanon, ukuran tubuh, lebar tengkorak, tinggi tengkorak, dan lebar ekor. Hasil analisis jarak mahalonobis pohon fenogram dan kanonikal menunjukkan bahwa enam populasi masing-masing berdiri sendiri, sehingga dibeda-kan menjadi enam rumpun, yaitu rumpun kambing Muara, Jawarandu, Kacang, Benggala, Samosir, dan Marica. Tingkat keragaman bobot badan dan panjang badan sangat tinggi, sehingga peluang peningkatan produksi dapat dilakukan melalui program persilangan dan seleksi.
Kata kunci: morfometrik, analisis diskriminan, kambing lokal
ABSTRACT
The research objectives were to characterize morphometric and genetic distance between populations of Indonesian local goats. The morphological discriminant and canonical analysis were carried out to estimate the phylogenic relationship and determine the discriminant variable between Benggala goats (n= 96), Marica (n= 60), Jawarandu (n= 94), (Kacang (n= 217), Muara (n= 30) and Samosir (n= 42). Discriminant analysis used to clasify body weight and body measurements. In the analysis of variance showed that body weight and body measurement (body length, height at with-ers, thorax width, thorax height, hert girth, skull width and height, tail length and width, ear length and width) of Muara goats was higher (P<0.05) compared to the other groups, and the lowest was in Marica goats. The smallest genetic distance was between Marica and Samosir (11.207) and the high-est were between Muara and Benggala (255.110). The highhigh-est similarity between individual within population was found in Kacang (99.28%) and the lowest in Samosir (82.50%). The canonical analysis showed high correlation on canon circumference, body weight, skull width, skull height, and tail width variables so these six variables can be used as distinguishing variables among population. The result from Mahalonobis distance for phenogram tree and canonical analysis showed that six popula-tions of Indonesian local goats were divided into six breed of goats: the rst was Muara, the second
Accredited by DGHE No: 66b/DIKTI/Kep/2011 DOI: 10.5398/medpet.2011.34.3.165
INTRODUCTION
Local goat is a great potential genetic resource to be utilized as a source of superior breeding formulation which adaptable to local conditions in Indonesia. FAO (2007) reported that breeds of local livestock is important to be protected because it has its own advantages, which can survive with low-quality feed, able to survive the pressure of the local climate changes, high resistance to local diseases and parasites, is a unique source of genes for use in repairing the breeds through the crossing, be more productive with lower costs, support diversity in the long term, support the diversity of food, agriculture and culture, is more e ective in achieving local food security.
Goats husbandry play an important role in small livestock farmers to improve incomes and also as a source of meat, manure for fertilizer, money, fam-ily labor optimization, improved social status, and socio-cultural aspects. Based on the statistics data in 2009 (Directorate General of Livestock, 2010) total goat population in Indonesia as much as 15,655,740 heads; the highest in Central Java province (3,491,073 heads); East Java (2,780,822 heads); West Java (1,488,152 heads); Lampung (1012 .705 tail); Banten (854,522 heads); Namro Aceh Darussalam (703 594 heads); North Sumatra (619,940 heads); NTT (547,234 heads); and South Sulawesi (435,103 heads). Nearly 99% of small ruminants in Indonesia are small-scale livestock enterprises. Goats can convert low-quality forages into animal protein, as a source of manure as well as savings.
External appearance (morphology) is still common-ly used by researchers and practitioners in identifying farms, characterization and selection of animals to breed (Khanet al., 2006; Dossaet al., 2007; Alade et al., 2008; adaptation capability has the ability to produce more than one alternative form of morphology, physiological status, and or behavior as a reaction or adaptation to environmental changes in the form of regulation of gene expression and changes in shape phenotype (Karnaet al., 2001; Noor, 2002; Rivaet al., 2004; Mansjoeret al., 2007).
The existing characteristics of some local goats in di erent regions showed many performance varieties. Since the last two centuries there were several types of goats imported to Indonesia, thereby increased ge-netic diversities of goats in Indonesia. For the purpose of wealth preservation and development potential of
livestock germ plasma is very necessary to explore and identify genetic diversity of local goat resources in Indonesia. Indonesia Animal Production Research Institute has begun to characterize Kacang, Peranakan
1985; Subandriyoet al., 1995; Setiadiet al., 1997). It is es-timated that there are some Indonesian local goat breeds that still not characterized yet and some might be nearly as the populations of rare or nearing extinction. The purpose of this study was to obtain data and informa-tion on the characteristics and genetic diversity among local goats in Indonesia.
MATERIALS AND METHODS
Animal and Data Sampling Collection
The study was conducted at several populations in the four Provinces, namely; Marica goat from South Sulawesi (Maros Regency and Jeneponto Regency), Benggala goat (B) of Nusa Tenggara Timur (Timor and Flores island), Jawarandu goat (J) from Central Java (Blora Regency), and 3 populations of North Sumatra (Kacang goat (K) from Indonesian Goat Research Institute station, Samosir goat (S) of Samosir Regency, and Muara goat (R) of the Regency of North Tapanuli). Goat samples made in random order, each region as much as 96 head Benggala, 94 head Jawarandu, 60 head Marica, 217 head Kacang, 30 head Muara, and 42 head Samosir goats. Phenotypic parameters used in data anal-ysis include: shoulders height, body length, chest tight, chest width, chest circumference, skull length, skull width, tail length, tail width, ear length, and ear width. The name of goat is used as covariates goat populations.
Statistical Analysis
Analysis of variance (ANOVA) was used to calculate the e ect of body sizes between populations. If the result is signi cantly di erent, it will be continued with the Duncan test analysis.
Morphometric Analysis
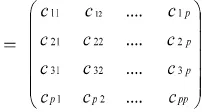
Simple discriminant function performed for the determigenotype of genetic distance (Traoreet al., 2008). The discriminant function used by the Mahalanobis distance approach as described by Nei & Nei (1987) and Flury (1988), where the matrix diversity range between variables of each population of goats were observed combined (pooled) into one matrix. The pooled matrix can be explained in the following form:
was Jawarandu, the third was Kacang, the fourth was Benggala, the fth was Samosir and the sixth was Marica goats. The diversity of body size and body weight of goats was observed quite large, so the chances of increasing productivity could be made through selection and mating programs.
To get the minimum genetic distance used quadratic formula in accordance with the instructions of
et al. (2001) and Quinnet al. (2002) as follows:
the j-th goat genotype on quantitative variables respectively.
The Mahalanobis statistical analysis with the DISCRIM procedure and the CANDISC procedure using the SAS version 9.1 program (SAS Inst., 2005). From the quadratic distance calculations was transformed to the square root data. The square root data was
The highest average of body weight of adult female (doe) was in Muara goat (37.46 kg) signi cantly di erent (P<0.05) when compared 5 other population groups. The mean and standard deviation for female goat (doe), male goats (buck) and over all of body weigth were shown in
Table 1. The average body weight of Samosir doe was buck was 24.67 kg, Samosir (22 kg) similar with Marica, Jawarandu (16.36 kg) almost similar with Benggala buck. The results showed that the goats body weight between populations were signi cantly di erent (P<0.005). Muara goat was the heaviest (38.23 kg), followed by Samosir (24.57 kg) and Benggala goat (24.09 kg) in the second rank, Kacang (21.95 kg) and Jawarandu (21.15 kg) in the third rank, and than Marica goat (20.53 kg) was the smallest in body weight. The average of body weight of doe and buck for Kacang and Jawarandu in this study lower compared with the research reported by Setiadi et al. (1997) in the Purworejo Regency were 23.83 kg and 26.88 kg for Kacang goat, 28.74 kg and 30.91 kg for Jawarandu goats. The body weight di erence was pre-sumebaly caused by di erences in breeding stock
qual-than in the Blora Regency.
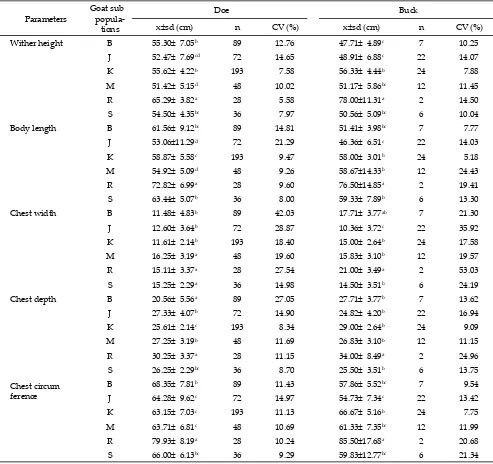
The average parameter goat s body sizes among population were signi cantly di erent (P<0.05) (Table 2). The highest wither height of doe was in Muara sig-ni cantly di erent (P<0.05) when compared with the other populations. Kacang doe wither height almost similar with Benggala and Samosir, and Jawarandu wither height almost similar with Marica. The highest wither height of buck also in Muara was signi cantly di erent when compared with other populations, from the highst to the lower were Kacang almost similar with Marica and Samosir, and the lowest were Jawarandu and Benggala bucks. The highest average body length of adult doe was found in Muara (72.82 cm) signi cantly di erent (P<0.05) with the other population. From the highest body length of doe to the lower were Samosir similar with Benggala, higher than Kacang, the lowest was Marica and Jawarandu respectively. The highest of buck body length was in Muara and than Samosir similar with Marica and Kacang, Benggala higher than Jawarandu respectively. The highest average chest width of doe was found in Marica almost similar with Samosir and Muara, and than Jawarandu similar with Kacang
Table 1. Mean body weight of 6 populations Indonesian local goats
Goat sub
Muara (R) 28 37.46±11.01a 2 49.00±26.87a 30 38.23±12.10a 31.64
Samosir (S) 36 25.00± 5.42b 6 22.00± 8.10bc 42 24.57± 5.86b 23.82
Table 2. Mean of the shoulder height, body length, chest width, chest depth, and chest circumference of doe and buck
Parameters
Goat sub popula-tions
Doe Buck
x±sd (cm) n CV (%) x±sd (cm) n CV (%)
Wither height B 55.30± 7.05b 89 12.76 47.71± 4.89c 7 10.25
J 52.47± 7.69cd 72 14.65 48.91± 6.88c 22 14.07
K 55.62± 4.22b 193 7.58 56.33± 4.44b 24 7.88
M 51.42± 5.15d 48 10.02 51.17± 5.86bc 12 11.45
R 65.29± 3.82a 28 5.58 78.00±11.31a 2 14.50
S 54.50± 4.35bc 36 7.97 50.56± 5.09bc 6 10.04
Body length B 61.56± 9.12bc 89 14.81 51.41± 3.98bc 7 7.77
J 53.06±11.29d 72 21.29 46.36± 6.51c 22 14.03
K 58.87± 5.58c 193 9.47 58.00± 3.01b 24 5.18
M 54.92± 5.09d 48 9.26 58.67±14.33b 12 24.43
R 72.82± 6.99a 28 9.60 76.50±14.85a 2 19.41
S 63.44± 5.07b 36 8.00 59.33± 7.89b 6 13.30
Chest width B 11.48± 4.83b 89 42.03 17.71± 3.77ab 7 21.30
J 12.60± 3.64b 72 28.87 10.36± 3.72c 22 35.92
K 11.61± 2.14b 193 18.40 15.00± 2.64b 24 17.58
M 16.25± 3.19a 48 19.60 15.83± 3.10b 12 19.57
R 15.11± 3.37a 28 27.54 21.00± 3.49a 2 53.03
S 15.25± 2.29a 36 14.98 14.50± 3.51b 6 24.19
Chest depth B 20.56± 5.56a 89 27.05 27.71± 3.77b 7 13.62
J 27.33± 4.07b 72 14.90 24.82± 4.20b 22 16.94
K 25.61± 2.14c 193 8.34 29.00± 2.64b 24 9.09
M 27.25± 3.19b 48 11.69 26.83± 3.10b 12 11.15
R 30.25± 3.37a 28 11.15 34.00± 8.49a 2 24.96
S 26.25± 2.29bc 36 8.70 25.50± 3.51b 6 13.75
Chest circum ference
B 68.35± 7.81b 89 11.43 57.86± 5.52bc 7 9.54
J 64.28± 9.62c 72 14.97 54.73± 7.34c 22 13.42
K 63.15± 7.03c 193 11.13 66.67± 5.16b 24 7.75
M 63.71± 6.81c 48 10.69 61.33± 7.35bc 12 11.99
R 79.93± 8.19a 28 10.24 85.50±17.68a 2 20.68
S 66.00± 6.13bc 36 9.29 59.83±12.77bc 6 21.34
Note: Means in the same column with di erent superscript di er signi cantly (P<0.05); K= Kacang; B= Benggala; S= Samosir; J= Jawarandu; M= Marica; R= Muara; n= number of samples; x= average; sd= standard deviation; CV=coe cient variance.
and Benggala goats. The highest chest width of buck was in Muara similar with Benggala, Marica similar with Samosir and Kacang, and the lowest was Jawarandu. The highest chest depth of doe were found in Muara similar with Benggala, signi cantly di erent (P<0.05) compare to others four populations, than followed by Jawarandu similar with Marica and Samosir, and the lowest was Kacang. The highest buck chest depth was in Muara signi cantly di erent (P<0.05) compared to other ve populations. The average buck chest depth of Samosir was similar to Marica, Kacang, Jawarandu, and Benggala goats. The highest average chest circumfer-ence was found in Muara signi cantly di erent (P<0.05) compared to other ve genotypes, Benggala similar with Samosir and the lowest Kacang similar to Marica
and Jawarandu. The highest chest circumference of buck found in Muara signi cantly di erent (P<0.05) com-pared to other ve populations, followed by Kacang, Marica similar to Samosir and Benggala, and the lowest was Jawarandu goat.
and the lowest was Marica. The highest skull width of buck was in Muara signi cantly di erent (P<0.05) com-pared to Kacang, than Jawarandu similar to Benggala and Marica, and the lowest was Samosir. The highest skull height of doe was Muara signi cantly di erent (P<0.05) compared to Samosir similar with Kacang, and
Benggala similar to Jawarandu and Marica. The highest skull height of buck skull was Muara signi cantly dif-ferent (P<0.05) compared to Kacang, and than Samosir similar to Marica, Benggala, and Jawarandu.
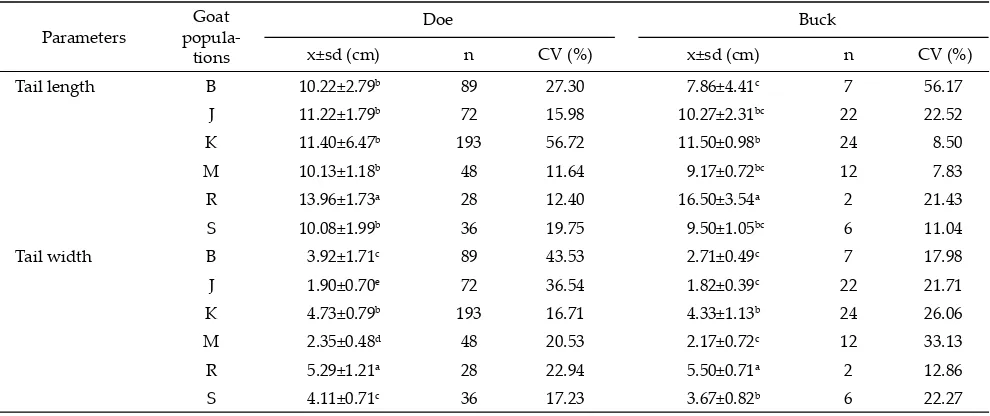
In general, the average tail length and width of 6 populations were signi cantly di erent (P<0.05) when
Note: Means in the same column with di erent superscript di er signi cantly (P<0.05); K= Kacang; B= Benggala; S= Samosir; J= Jawarandu; M= Marica; R= Muara; n= number of samples; x= average; sd= standard deviation; CV= coe cient variance.
Parameters
Goat
popula-tions
Doe Buck
x±sd (cm) n CV (%) x±sd (cm) n CV (%)
Tail length B 10.22±2.79b 89 27.30 7.86±4.41c 7 56.17
J 11.22±1.79b 72 15.98 10.27±2.31bc 22 22.52
K 11.40±6.47b 193 56.72 11.50±0.98b 24 8.50
M 10.13±1.18b 48 11.64 9.17±0.72bc 12 7.83
R 13.96±1.73a 28 12.40 16.50±3.54a 2 21.43
S 10.08±1.99b 36 19.75 9.50±1.05bc 6 11.04
Tail width B 3.92±1.71c 89 43.53 2.71±0.49c 7 17.98
J 1.90±0.70e 72 36.54 1.82±0.39c 22 21.71
K 4.73±0.79b 193 16.71 4.33±1.13b 24 26.06
M 2.35±0.48d 48 20.53 2.17±0.72c 12 33.13
R 5.29±1.21a 28 22.94 5.50±0.71a 2 12.86
S 4.11±0.71c 36 17.23 3.67±0.82b 6 22.27
Table 4. Means of tail length and width of Indonesian local goats
Note: Means in the same column with di erent superscript di er signi cantly (P<0.05); K= Kacang; B= Benggala; S= Samosir; J= Jawarandu; M= Marica; R= Muara; n= number of samples; x= average; sd= standard deviation; CV=coe cient variance.
Parameters
Goat
popula-tions
Doe Buck
x±sd (cm) n CV (%) ± SD (cm) n CV (%)
Skull length B 15.30±1.88ab 89 12.28 12.86±1.46b 7 11.39
J 14.08±2.52cd 72 17.87 12.36±1.81b 22 14.67
K 15.68±1.38a 193 8.78 15.67±1.40a 24 8.96
M 13.73±1.77d 48 12.90 13.00±1.35b 12 10.37
R 14.64±1.54bc 28 10.55 16.00±2.83a 2 17.68
S 13.69±1.86d 36 13.61 13.33±1.97b 6 14.75
Skull width B 10.53±1.30cd 89 12.33 8.71±0.76d 7 8.67
J 10.28±2.09de 72 20.35 9.18±1.14d 22 12.41
K 10.97±1.19bc 193 10.81 12.33±0.48b 24 3.90
M 9.79±1.27e 48 12.98 8.67±0.49d 12 5.68
R 13.79±2.91a 28 21.11 13.50±2.12a 2 15.71
S 11.56±2.45b 36 21.24 10.67±0.82c 6 7.65
Skull height B 11.70±1.39c 89 11.84 11.29±1.11cd 7 9.86
J 11.14±1.78c 72 15.97 10.45±1.65d 22 15.82
K 12.58±1.73b 193 13.78 15.00±1.87b 24 12.43
M 11.58±1.20c 48 10.36 11.33±1.15cd 12 10.19
R 14.36±1.47a 28 10.25 17.00±2.83a 2 16.64
S 12.94±1.19b 36 9.22 12.50±1.05c 6 8.39
compared between each others (Table 4). The highest tail length of doe was Muara signi cantly di erent (P<0.05) compared to others. Kacang was similar to Jawarandu, Benggala, Marica, and Samosir. The highest tail length of buck was Muara signi cantly di erent (P<0.05) compared to the others. Jawarandu similar to Kacang, Samosir and Marica, and the lowest was Benggala. The highest tail width of doe was Muara signi cantly dif-ferent (P<0.05) compared to Kacang, Samosir similar to Benggala, than Marica and the lowest was Jawarandu. The highest tail width of buck was Muara signi cantly di erent (P<0.05) compared to Kacang similar with Samosir, and than Jawarandu similar to Marica and Benggala.
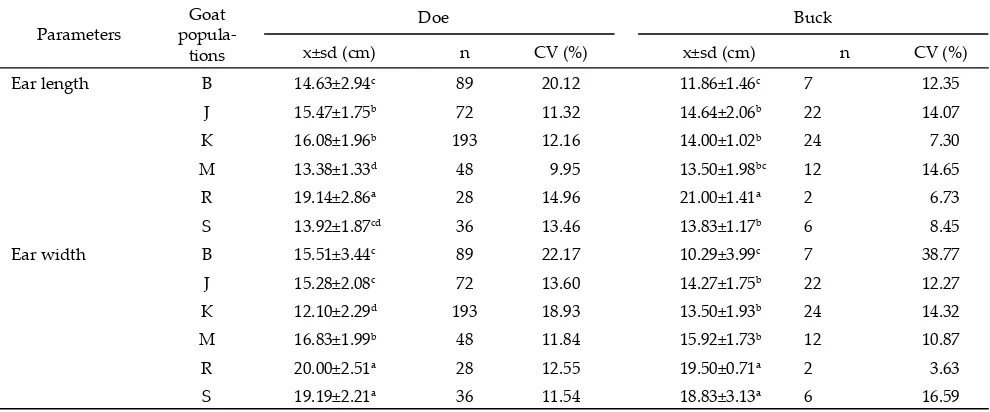
In general, the results showed the average size of ear length and width between populations were signi -cantly di erent (P<0.05) between each others (Table 5). The highest ear length of doe was Muara signi cantly di erent (P<0.05) compared to Kacang similar with Jawarandu, than Benggala, and Samosir similar with
Marica. The highest ear length of buck was Muara signi cantly di erent (P<0.05) compared to Jawarandu similar to Marica, Kacang, Samosir, and Marica, and the lowest was Benggala.
The highest ear width of doe were Muara and Samosir signi cantly di erent (P<0.05) compared to Marica, than Benggala similar with Jawarandu, and than the lowest was Kacang. The highest ear width of buck were Muara and Samosir signi cantly di erent (P<0.05) compared to Marica similar to Jawarandu and Kacang, and the lowest was Benggala.
The size of the canon circumference between popu-lations were signi cantly di erent (P<0.05) (Table 6). The highest canon circumference of doe was Muara sig-ni cantly di erent (P<0.05) compared to Benggala, than Samosir similar with Jawarandu, than Marica, and the lowest was Kacang. The highest canon circumference of buck was in Muara signi cantly di erent (P<0.05) compared to Samosir similar to Marica, Benggala, and Jawarandu, and the lowest was Kacang goat.
Note: Means in the same column with di erent superscript di er signi cantly (P<0.05); K= Kacang; B= Benggala; S= Samosir; J= Jawarandu; M= Marica; R= Muara; n= number of samples; x= average; sd= standard deviation; CV= coe cient variance.
Table 5. Means of ear length and ear width of Indonesian local goats
Parameters
Goat
popula-tions
Doe Buck
x±sd (cm) n CV (%) x±sd (cm) n CV (%)
Ear length B 14.63±2.94c 89 20.12 11.86±1.46c 7 12.35
J 15.47±1.75b 72 11.32 14.64±2.06b 22 14.07
K 16.08±1.96b 193 12.16 14.00±1.02b 24 7.30
M 13.38±1.33d 48 9.95 13.50±1.98bc 12 14.65
R 19.14±2.86a 28 14.96 21.00±1.41a 2 6.73
S 13.92±1.87cd 36 13.46 13.83±1.17b 6 8.45
Ear width B 15.51±3.44c 89 22.17 10.29±3.99c 7 38.77
J 15.28±2.08c 72 13.60 14.27±1.75b 22 12.27
K 12.10±2.29d 193 18.93 13.50±1.93b 24 14.32
M 16.83±1.99b 48 11.84 15.92±1.73b 12 10.87
R 20.00±2.51a 28 12.55 19.50±0.71a 2 3.63
S 19.19±2.21a 36 11.54 18.83±3.13a 6 16.59
Note: Means in the same column with di erent superscript di er signi cantly (P<0.05); K= Kacang; B= Benggala; S= Samosir; J= Jawarandu; M= Marica; R= Muara; n= number of samples; x= average; sd= standard deviation; CV= coe cient variance.
Table 6. Means of the canon circumference of six di erent populations of Indonesian local goats
Parameters
Goat
popula-tions
Doe Buck
x±sd (cm) n CV(%) x±sd (cm) n CV (%)
Canon circum ference
B 14.64±1.65b 89 11.24 13.43±0.53b 7 3.98
J 13.83±1.67c 72 12.07 13.27±1.58b 22 11.90
K 7.73±0.69e 193 8.98 9.17±0.38c 24 4.15
M 13.29±1.07d 48 8.06 13.83±0.94b 12 6.78
R 16.71±1.46a 28 8.75 19.50±4.95a 2 25.38
Maps of the Goat Phenotypic Measurements Distributions
The six populations of goat research showed a high diversity of morphologically in Muara, Jawarandu, Kacang, Marica, Samosir, and Benggala goats (Figure 1). The diversity of morphology can occur because of the mutation process of selection (natural and arti cial), crossbreeding, genetic drift that can result in lost or run o of certain genes (Anderson, 2001). Figure 1 showed that the grouping of the six population Indonesian goat research into 6 groups, namely: (1) the Muara goat (R) was in quadrant I, (2) groups of Jawarandu goats (J) was largely in quadrant I and quadrant IV, (3) group of Kacang goats in quadrant II, (4) the majority of Benggala goat was in quadrant III and a small portion was in quadrant IV, (5) Marica goat groups in quadrant III and quadrant IV, and (6) group Samosir goat similar to the Marica in quadrant III and quadrant IV. Muara goat was a group that far apart when compared with other geno-types, it alleged Muara goat was a spesi c breed goat of its own.
Kacang goat breeds rather far from the groups of Jawarandu, Samosir, Marica, and Benggala, that may be caused of the samples of Kacang goats were from Indonesian Goat Research Institute station, which has
that relatively larger body size compare to Kacang in Farmers. The characteristics of body size Marica goat s in South Sulawesi Province, Samosir goat in North Tapanuli regency, North Sumatra Province were rela-tively closer. This was apparently due to adaptation to the environment that almost simultaneously with the conditions foods availibity. Environment as a limiting factor for livestock in the area, e ect of feed availability, which in South Sulawesi province has the dry season between 6-9 months in 1 year and soil conditions were relatively had thin of top soil. While in Samosir regency despite relatively high rainfall, the top soil conditions similar to conditions in South Sulawesi was relatively thin of the top soil and rocky.
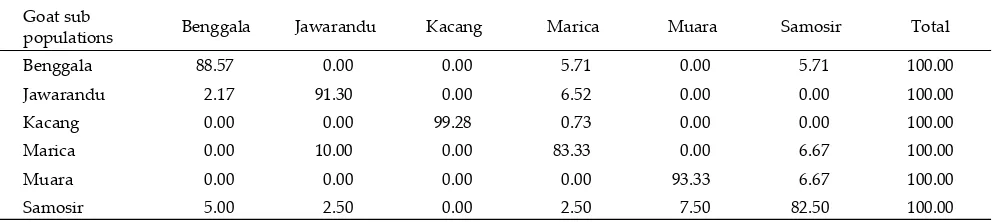
The Value of Inter-Group Phenotypic Mixture
The result of discriminate analysis can be used to predict the existence of common values in a group of goats. Most likely the proportion of values that a ect the similarity of a mixture of other populations based on phenotypic similarity measure (Riva et al., 2004; Sumantriet al., 2007; Carnerioet al. 2010; Jinget al. 2010). The results analysis of similarity and mixed in among the group showed that Samosir goats was the lowest similarity with value 82.50% because developed by mixture of Muara 7.50%, Benggala 5%, and Marica goat
Goat sub
populations Benggala Jawarandu Kacang Marica Muara Samosir Total
Benggala 88.57 0.00 0.00 5.71 0.00 5.71 100.00
Jawarandu 2.17 91.30 0.00 6.52 0.00 0.00 100.00
Kacang 0.00 0.00 99.28 0.73 0.00 0.00 100.00
Marica 0.00 10.00 0.00 83.33 0.00 6.67 100.00
Muara 0.00 0.00 0.00 0.00 93.33 6.67 100.00
Samosir 5.00 2.50 0.00 2.50 7.50 82.50 100.00
Figure 1. The distribution of canonical goat groups according to the phenotypic measurement of the 6 populations of Indonesian local goats. K= Kacang; B= Benggala; S= Samosir; J= Jawarandu; M= Marica; R= Muara.
2.5% (Table 7). Marica goat group had 83.33% similar-ity value, because of the e ect of Jawarandu 10% and Samosir goats 6.67%. Benggala goats group has similar-ity value 88.57%, because expand by mixture of Marica and Samosir goat with the value of each genotype goats at 5.71%. Jawarandu goat group had 91.30% similarity value because expand by mixture of Marica 6.52% and Banggala goat 2.17%. Muara goat group has the highest similarity value of 93.33%, because only in uenced by the value of a mixture of Samosir goat 6.67%. Genetic and environmental factors have a close relationship, and to express their genetic capacity of individuals are perfectly necessary environmental conditions were ideal (Noor, 2002; Fajemilehin & Salako, 2008).
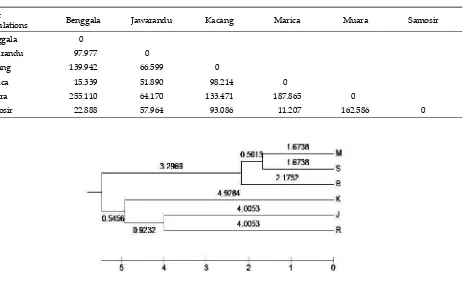
Determigenotype of the Genetic Distance and the Phenogram Tree
The value matrix of genetic distances between group 6 populations of goats (Table 8) were used to make construction phenogram tree (Figure 2). Phenogram tree depicts the overall genetic distance group. The analysis result in Table 8 shows that the smallest value obtained at a distance of two groups of Samosir and Marica goat is equal to 11.207. The largest value obtained from the Benggala goats (255.110), followed by Muara-Marica (187.865), as well as Kacang-Benggala goats (139.942) and Muara-Kacang goats (133.471). The matrix value of genetic distance obtained from a relatively large genetic distance between Muara goat-all groups, and genetic distance Kacang Benggala goats.
The construction of phenogram tree (Figure 2)
shows that the group Samosir-Marica goats and Marica-Benggala has a genetic distance close compared genetic distance Samosir-Benggala (22.888) and Jawarandu-Marica goat (51.890). Muara goat groups in North Tapanuli Regency, North Sumatra Province was geneti-cally separated from the Benggala, Kacang, Marica, and Samosir goats. Muara goat genetic distance showed from the branches of the tree in Figure 2 which showed that the branch indirect link between Marica, Samosir, Benggala, and Kacang goats.
Distribution map based on body size and phe-nogram tree some goats in one breeds should be cross breed mating program to increase genetic variation. Bourdon (2000) suggested that a crossing between in-dividuals that have a genetic distance away would give
to increased heterozygosis and gene comb genotypes. Based on this genetic distance and the phenogram tree the six population of Indonesian local goat could be classi ed into six breeds of goats which separated one sub breed to the others breeds.
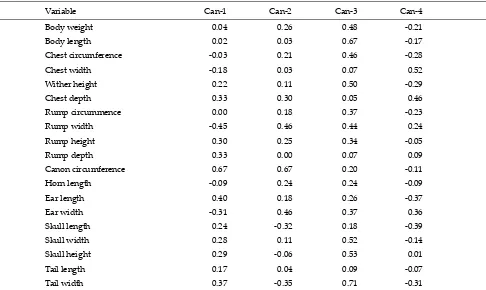
Discriminant Variables Goat Breeds
The result shows that the parameter has strong in uence on the breed groups were the circumference of canon (0.671 Can-1) and (0.666 Can-2), body length (0.669 Can-3), skull width (0.523 Can-3), skull height (0.529 Can-3),and tail width (0.714 Can-4), so that the circumference of the canon, body length, skull width, skull height, and tail width could be used as discrimina-tor variables local goat groups in Indonesia (Table 9).
Table 8. Matrix genetic distance between groups of six populations of Indonesian local goats
Goat
populations Benggala Jawarandu Kacang Marica Muara Samosir
Benggala 0
Jawarandu 97.977 0
Kacang 139.942 66.599 0
Marica 15.339 51.890 98.214 0
Muara 255.110 64.170 133.471 187.865 0
Samosir 22.888 57.964 93.086 11.207 162.586 0
CONCLUSION
Muara goat has the livebody weight and body linier measurement was larger when compared with Jawarandu, Benggala, Kacang, Samosir, and Marica goat. The canon circumference, body weight, body length, skull width, skull height and tail width were the most discriminant variable to determine the di erences between breeds of Indonesian local goats. The diversity of body size and body weight of goats were observed quite large, so the chances of increased productivity could be made through selection and mating programs.
ACKNOWLEDGEMENT
Financial support was provided by the Agency for Agricultural Research and Development which has funded this research. The authors wish acknowdge-ments to all cooperation and the assistance during eld sampling to the Head of BPTP South Sulawesi, the Head of BPTP Nusa Southeast Timor province, The Head of Animal Husbandry Service of Blora Regency - Central Java province, The Head of Fisheries and Livestock Services Regency of North Tapanuli, The Head of Agriculture, Livestock and Fisheries Services of Samosir Regency. In particular conveyed his gratitude for the good cooperation during the eld to Mr. Ir. Erwin Sihite, Ir. Mateus Sariubang, MSi, Ir. Daniel Pasambe, Ir. Bonggas Pasaribu, drh. Wasito M.Si., Mrs. Ir. Deborah Kana Hau, M.Si., and Ir. Rosianna Tarigan. Also many thanks to all the o cers and many farmers who pro-vided assistance during data collection in the elds.
REFERENCES
(FAO) Food and Agriculture Organization. 2007. The Global Plan of Action for Animal Genetic resources and Interlak-en Declarations on Animal GInterlak-enetic Resources. IntergInterlak-eno- Intergeno-typeal Technical Conference on Animal Genetic Resources for Food and Agriculture, Interlaken, 3-7 September 2007.
Rome, Italy.
Alade, N. K., A. O. Raji, & M. A. Atiku. 2008. Determination of apropriate model for the estimation of body weight in goats. J. Agric. Biol. Sci. 3:51-57.
Anderson, L.2001. Genetic dissection of phenotypic diversity in farm animals. Nature Rev. Genet. 2:130-138.
Bourdon, R. M. 2000. Understanding Animal Breeding. 2nd Ed. Prentice-Hall, New Jersey, USA.
Carnerio, H., H. Louvandini, S. R. Paiva, F. Macedo, B. Mernies, & C. McManus. 2010. Morphological characterization of sheep breeds in Brazil, Uruguay and Colombia. J. Small Rum. Res. 94:58-65.
Directorate General of Livestock Service. 2010. Livestock Sta-tistic 2009. Directorate General of Livestock Service. The Ministry of Agricultural of Republic of Indonesia, Jakarta. Dossa, L. H., C. Wollmy, & M. Gauly. 2007. Spatial variation in goat populations from Benin as revealed by multivariate analysis of morphological traits. J. Small Rum. Res. 73:150-159.
, B. & G. Dunn. 2001. Applied Multivariate Data Analy-sis. 2nd Ed. Oxford University Press. pp.342.
Fajemilehin, O. K. & A. E. Salako. 2008. Body measurement characteristics of the West African Dwarf (WAD) goat in deciduous forest zone of Southwestern Nigeria. African J. of Biotec. 7:2521-2526.
Herrera, M., E. Rodero, M. J. Gutierrez, F. Pena, & J. M. Rode-ro.1996. Application of multifactorial discriminant analy-sis in the morphostructural di erentiation of Andalusian caprine breeds. J. Small Rum. Res. 22:39-47.
Jimmy, S., M. David, K. R. Donald, & M. Dennis. 2010. Varibi-ality in body measurement and their application in pre-dicting libe bofy weight of Mubende and Small East Afri-can goat breeds in Uganda. Middle-East J. of Scient. Res. 5:98-105.
Jing, L, J. Ren-jun, Z. Guo-rong, Y. Qing-ran, & M. Hua-ming. 2010. Quentitative and qualitative body traits of longling yellow goats in China. J. Agric. Sci. in China 9:408-415. Karna, D. K., G. L. Koul, & G. S. Bisht. 2001. Pashmina yield
and its association with mophometric traits in Indian Che-ghu goats. J. Small Rum. Res. 41:271-275.
Khan, H., F. Muhammad, R. Ahmad, G. Nawaz, Rahimullah, & M. Zubair. 2006. Relationship of body weight with linear body measurements in goats. J. Agric. Biol. Sci. 1:51-54. Kumar, S., K. Tamura, & M. Nei. 1993. MEGA: Molecular
Evo-lutionary Genetics Analysis. Pennsylvania State Univer-sity, University Park, PA.
Lanari, M. R., H. Taddeo, E. Domingo, M. M. Centeno, & L. Gallo. 2003. Phenotypic di erentiation of exterior traits in local criollo goat population in Patagonia (Argentina). Ar-chive Tierzh. Dummerstorf 46:347-356.
Mansjoer, S. S., T. Kertanugraha, & C. Sumantri. 2007. Esti-masi jarak genetik antar domba garut tipe tangkas dengan tipe pedaging. Med. Pet. 30:129-138.
Nei, S. & M. Nei. 1987. The neighbor-joining method: a new method for reconstructing phylogenetic trees. J. Mol. Biol. Evol. 4:406-425
Noor R. R. 2002. Genetika Ekologi. Laboratorium Pemuliaan dan Genetika Ternak. Fakultas Peternakan, Institut Perta-nian Bogor, Bogor.
Quinn, G. P. & M. J. Keough. 2002. Experimental Design and Data Analysis for Biologist. Cambridge University Press, Cambridge, U.K., pp.537.
Riva, J., R. Rizzi, S. Marelli, & L.G. Gavalchini. 2004. Body measurements in Bergamasca sheep. J. Small Rum. Res. 55:221-227.
Salako, A. E. 2006. Principal component factor analysis of the morphostructure of immature Uda sheep. Internat. J. Mor-phology 24:571-574.
SAS Institute. 2005. SAS / STAT Guide for Personal Computer. Version 9.1. SAS Institute Cary, NC. USA.
Setiadi, B., I. K. Sutama, & I. G. M. Budiarsana. 1997. E siensi reproduksi dan produksi kambing Peranakan Etawah pada berbagai tatalaksana perkawinan. J. Ilmu Ternak Vet. 2:233-236.
Setiadi, B., Subandriyo, & L. C. Iniguez. 1995. Reproductive performance of small ruminants in an Outreach Pilot Proj-ect in West Java. J. Ilmu Ternak Vet. 1:73-80.
Sitepu, P. 1985. Produktivitas ternak kambing di Propinsi Su-matera Utara: Ukuran tubuh dan morfogenetik kambing lokal di Kecamatan Galang. J. Ilmu Pet. 2:5-9.
Subandriyo, B. Setiadi, D. Priyanto, M. Rangkuti, W. K. Sejati, D. Anggraeni, R. S. G. Sianturi, Hastono, & O. Butar-butar. 1995. Analisis Potensi Kambing Peranakan Etawah dan Sumberdaya di Daerah Sumber Bibit Pedesaan. Pusat Penelitian dan Pengembangan Peternakan.
Sumantri, C. A., A. Einstiana, J. F. Salamena, & I. Inounu. 2007. Keragaman dan hubungan phylogenik antar domba lokal di Indonesia melalui pendekatan analisis morfologi. J. Ilmu Ternak Vet. 12 : 42-54.
Tamura K., J. Dudley, M. Nei, & S. Kumar. 2007. MEGA 4: Mo-lecular Evolutionary Genetic Analysis (MEGA) software version 4.0. J. Biol. Evol. 24: 1596-1599.