GEOTECHNICAL ANALYSIS OF CARSINGTOM DAM FAILURE
Sukiman *
Abstract
The Carsington Dam failure is huge disaster that it was impacted many people died and a lot of houses been destroyed. That case arose many questions as it could be caused by numerous factors such as lack of design or construction could be the main factors that influence that failure. The purpose of this research is to analyze some factors that have been impacted the failure of Carsington Dam, this research also will explore the condition before and after construction have been done.
The failure which took place in the dam was likely to have been caused by inadequate material strength which is influenced by certain factors such as lack of design and/or construction and exposure to destructive chemical substances
Keywords: Carington Dam, pra and pasca construction, Dam Failure
Abstrak
Keruntuhan Carsingtom DAM adalah sutau musibah yang sangat dahsyat yang menyebabkan banyak kerugian jiwa maupun harta benda. Oleh karenanya perencanaan dan pelaksanaan yang sangat hati-hati dan penuh perhitungan sangat dibutuhkan. Keruntuhan yang terjadi di Carsington Dam di Derbyshire United Kingdom adalah salah satu contoh musibah yang menyebabkan kerugian material maupun inmaterial. Penyebab Keruntuhan tersbut dapat disebabkan banyak faktor seperti kegagalan mekanis, degradasi material maupun kesalahan prosedure pelaksanaan.
Tujuan dari penulisan adalah mengkaji penyebab keruntuhan dari Carsington DAM dengan memperhitungakan kondisi pra dan pasca pembangunan dari DAM tersebut.
Dari analisa yang dilakukan bahwa faktor utama yang menyebabkan keruntuhan adalah rendahnya kualitas material yang digunakan yang diakibatkan proses degradasi karena bahan kimia juga ditambah beberapa faktor seperti kualitas perencanaan yang rendah dan proses konstruksi yang tidak ketat.
Kata kunci: Carsingtom DAM, , Pra and Pasca Konstruksi, Keruntuhan DAM.
* Staf Pengajar Jurusan Teknik Sipil Fakultas Teknik Universitas Tadulako, Palu
1. Intoduction
The purpose of this report is to present the results of the study of the slope stability of Carsington Dam. This dam is an earth embankment dam for a water supply scheme and located in Derbyshire. The study consisted of two major parts.
• The pre-construction stability analysis This analysis was based on the values of drained shear strength parameters used by the original designer. Since no information could be
found in the literature regarding the values of porewater pressure assumed by the designer, a range of values of ru
were used in the analysis. A selection of other parameter values was also used to illustrate the effect of cohesion on the value of the factor of safety.
•The post-failure stability analysis
programme carried out after the slope failure. In addition, chainage 725 was selected as the reference section to represent the failure condition and the geometry of the dam.
To help carry out the analysis, a computer software SLOPE, which is part of the OASYS software package, was used to determine the factor of safety of the embankment against slope failure.
Finally, this study is enriched by additional information provided by Mr. Richard Chalmers, the representative from Babtie Geotechnical, in accordance with the actual pre and post-failure treatment of the Carsington Dam.
2. Site Description
Carsington Dam is located near the village of Hognaston in Derbyshire and has a maximum design height of 35 m. Plan of the Dam is presented in Fig. 1. This Dam was due to finish placing of filling material back in May 1984 when a crack was reported on the dam crest of its upstream part. This crack enlarged and had not stopped until 6 June, with the berm enlargement continued for a few more days. In chainage 675 m, the upstream toe had moved 13 m laterally and had lifted by about 2.5 m in addition of severe disruption of the upstream slope (Fig. 2).
Figure 1. Plan of Carsington Dam (chainage and elevation in meters)
Figure 2. Failure in Carsington Dam at 8 June 1984 (chainage and elevation in meters)
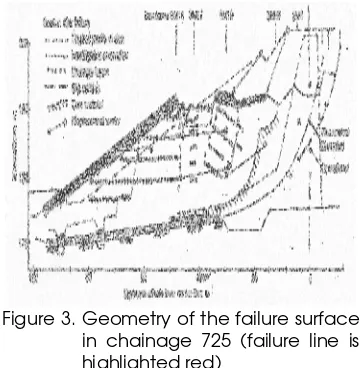
An early exploratory trench at chainage 620 m revealed the slip plane in the base layer and gave some understanding of the distortion at the toe. Further extensive exploratory works in trenches at chainage 720 m and 825 m (Fig. 2) provided more information and allowed sampling of embankment and foundation materials. From survey and interpretation, the geometry of the failure surface was derived and is presented in Fig. 3.
Figure 3. Geometry of the failure surface in chainage 725 (failure line is highlighted red)
Table 1. Geology of the foundation strata
Site
Identification Pit Logs
Classification and Description
Topsoil TS Topsoil
Subsoil a1
Head Deposits, Stiff brown and grey friable clay
Yellow Clay
(a) a2
Firm and stiff light grey and yellow/orange mottled clay. Both a1 and a2 contain some angular/sub-angular sandstone and limestone fragments, and rare rounded quartz pebbles
Yellow Clay (b) b1 & a2
Weathered Bedrock, Soft to stiff grey, brown and yellow mottled clay with rare sandstone and coal fragments (residual soil)
Dark Clay b3
Soft dark grey and black clay with some very weak mudstone peds. (Highly brecciated and completely weathered mudstone)
Brecciated
Mudstone b4
Dark grey laminated, highly weathered mudstone, very weak
Blocky
Mudstone b5
Dark grey laminated, moderately weathered mudstone
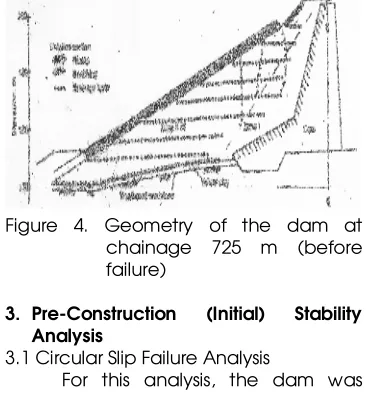
After the failure had occurred, a total of 1260 soil samples were taken and a comprehensive series of tests initiated. As the result, the geotechnical properties of the dam materials could be generalized and are presented in Table 2 (Fig. 4 as reference).
Figure 4. Geometry of the dam at chainage 725 m (before failure)
3. Pre-Construction (Initial) Stability Analysis
3.1 Circular Slip Failure Analysis
For this analysis, the dam was assumed to be made of homogeneous material with a unit weight of 20kN/m3. In
addition, groundwater level was set to be deep below the ground surface and circular failure surface was specified. The 2-D appearance of the Dam is shown in Figure 5.
Figure 5. 2-D appearance of the Carsington Dam as an input data for OASYS-SLOPE
Table 2. Geotechnical properties of the Carsington Dam strata
Peak Post-peak Residual No. Material Symbol Pit Log (kPa) γ
c' (kPa)
Φ'
(°) c' (kPa) Φ' (°) c' (kPa) Φ' (°) ru
1 Breaching - 18.5 - - - - - - 0
2 Fill Material b4 21 15 21 0 21 0 12 0
3 Core material a2,b1,b3 18.5 15 21 0 21 0 12 0.42 & 0.53
4 Yellow Clay a2,b1 18.3 10 20 0 20 0 12 0
5 Mudstone b3,b4 18.5 20 20 20 20 10 23 0
Table 3. Parameters for initial slope stability analysis
Set c’ (kPa) Φ’ (°) ru Notes
1 20 27 0.2, 0.4, 0.6 Original parameter set
2 20 23 0.2, 0.4, 0.6 Φ’ reduced (based on further testing)
3 5 23 0.2, 0.4, 0.6 c’ reduced
4 2 23 0.2, 0.4, 0.6 c’ reduced further
5 0 23 0.2, 0.4, 0.6 purely frictional material (c’ = 0)
This analysis was done using
OASYS-SLOPE programme to find the minimum factor of safety against slope failure (failure occurs if factor of safety just less than 1.00). The parameters used are presented in Table 3.
In the program, several features were chosen to be reliable for this analysis:
o The downstream slope (1:2.5) was the steepest slope of the homogeneous material dam. Thus, this slope was assumed to produce the lowest factor of safety against shear failure and therefore was chosen to be analysed in this part.
o Bishop’s and Janbu’s method were chosen instead of Fellenius because the material was considered drained. Since both of those prior methods showed similar results, only the Bishop’s method results are presented in this report.
o Parallel Interslice Forces method was used to carry out the calculation of factor of safety based on the shear strength of the slope.
o Circular slip surface type was chosen, with the direction of slip downhill.
o The least amount of slope failure weight was set to be 100 kN.
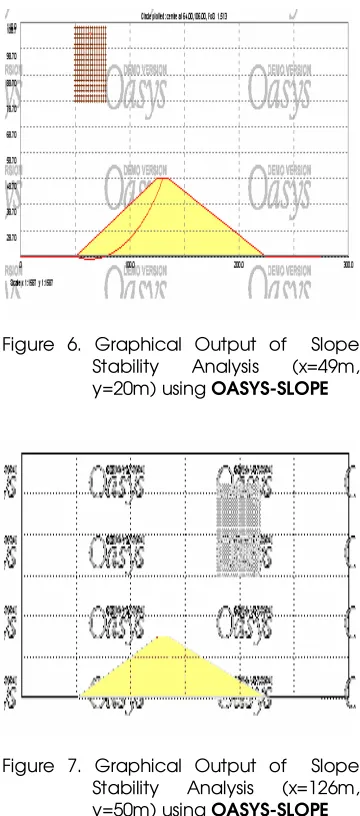
o Co-ordinates of common points which all failure circle must pass were:
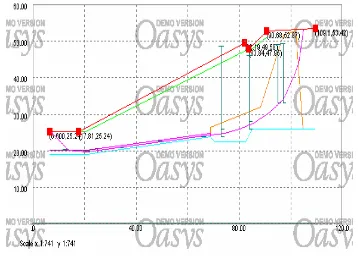
A(x = 49m, y = 20m) and B(x = 126m, y = 50m) (see Fig. 6 for reference).
Figure 6. Graphical Output of Slope Stability Analysis (x=49m, y=20m) using OASYS-SLOPE
The results of the analysis are presented in the Table 4.
Table 4. Results of the initial slope stability analysis
(206,142) 0.618 Comment
4 A (49, 20) (34, 174) 0.920
3.2 Non-Circular Slip Failure Analysis (Two-Wedge Analysis Method)
This analysis used the dam geometry at chainage 725 (Fig. 4). This cross sectional view was transformed into a simplified two-wedge model as presented in Fig. 6. In addition, this analysis assumed a homogeneous dam (as in the initial slope stability analysis) and used parameter Set 5 (c’ = 0 kPa,
Φ’= 23°) with ru = 0.2 (see Table 2 for
reference).
Figure 8. Simplified two-wedge model of the cross section at chainage then the correct value of factor of safety (F) has been chosen. In other words a trial approach is required by adjusting the value of F until convergence is achieved (Fig. 9).
From Fig. 9 above, the magnitude of P1 and P2 can be found from a polygon force providing an assumption
about its inclination
q
=
f
mor
tan
q
=
tan
f
'/
F
, wheref
m'
represents the mobilised angle of shearing resistance. The magnitude of total force W1 and W2 were obtained from the area of each wedge multiplied by the unit weight of soil.
A polygon of forces can be drawn for wedge 1 and 2 as shown in Fig. 8. The magnitude and direction of
c’L1 / F and c’L2 / F are known. The direction of N1’ and N2’ are known. The resultant R1 of the frictional component is assumed to act at the angle
'
m
f
from the direction of N1’ (the same procedure to R2). The direction of P1 and P2 are assumed so the polygon can be closed and thus, the value of P1 and P2 can be measured.Figure 10. Simplified two-wedge model of the cross section at chainage 725
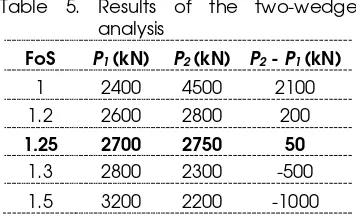
After several attempts, the most reasonable convergence value of factor of safety was approximately 1.25. Several calculation results are presented in Table 5 .
It can be concluded that because the factor of safety is above 1.00, thus the dam is considered to be safe against slope stability failure.
Table 5. Results of the two-wedge analysis
FoS P1 (kN) P2 (kN) P2 - P1 (kN)
1 2400 4500 2100 1.2 2600 2800 200
1.25 2700 2750 50
1.3 2800 2300 -500
1.5 3200 2200 -1000
4. Post-failure Stability Analysis
For this analysis, the geometry of the dam was taken from chainage 725 as presented in Fig. 4. The position of the non-circular failure surface was taken from the approximated failure line in Fig. 3. The input geometry for the SLOPE programme is presented in Fig. 11.
Figure 11. Input Geometry for SLOPE (failure line is highlighted red)
Basically, this analysis used the drained shear strength parameters tabulated in Table 2 in order to find the combination that gains the factor of safety of 1.00 (approximately) with consideration of the peak, post-peak, and residual value of the parameters. This is with the assumption that failure will occur when the factor of safety of the dam against shear strength is just less than 1.00.
In the program, several features were chosen to be reliable for this analysis:
be applied for non-circular slip in the SLOPE software.
o Parallel Interslice Forces method was used to carry out the calculation of factor of safety based on the shear strength of the slope.
o Non-circular slip surface type was chosen, with the direction of slip downhill.
o The least amount of slope failure weight was set to be 100 kN.
o The water table was set to be equal to the total head level of the piezometers.
The values of pore pressure ratio (ru) were 0.42, 0.53, and 0.00 for the core,
boot, and yellow clay respectively. Because of the limitation of the SLOPE software, the information had to be inputted in the form of a piezometric grid (Fig.12). The piezometer water level can be calculated using the equations as follow:
H
=
z
+
h
wheresoil soil u
water
h
r
h
g
g
´
´
=
H = piezometer water level / total head (m)
Z = elevation head (m)
h = pressure head (m)
hsoil = height of embankment above the piezometer tip (m)
γsoil = unit weight of soil above the piezometer tip (kN/m3)
γwater = unit weight of water (9.81 kN/m3)
Figure 12. Position of the piezometer grid at the input geometry
Since the materials that were involved in the failure are the yellow clay and the core material, only these materials were tested in the SLOPE-programme. In addition, the yellow clay material was divided into two terms:
yellow clay 1: the clay material near the core’s boot and under the fill
yellow clay 2: the clay material near the embankment’s end
This division was with respect to the measured post-failure strength properties of the clay
After several attempts, the minimum and most reasonable properties to stabilize the slope and make the factor of safety equals 1.00 are as shown in Table 6.
Table 6. Results of the post failure stability analysis
Core and Boot
Yellow Clay 1
Yellow Clay 2 No. Description
Φ’
(°) c’
(kPa) Φ’ (°)
Φ’
(°) c’ (kPa)
Factor of Safety
1 peak values 21 15 20 20 10 1.409
2
post peak
values 21 0 20 20 0 1.242
3
predicted
values 17.5 0 15 20 3 1.001
In table 6, yellow clay 1 material refers
The Carsington Dam failure arose many questions as it could be caused by numerous factors which can be physical (mechanism of failure), chemical (material degradation) or administrational (construction method). In this report, the discussion is limited to the physical factors which are narrowed to the factors of design and material properties. As the result, the term “Factor of Safety” is selected to be the governing condition of the design to judge the material properties of the dam.
o Circular Slip Failure Analysis
The simplified homogenous model of the dam was tested with several physical-material conditions and with the assumption of circular slip failure. From the results in Table 3, several characteristics are obtained:
- Set 1 gives the most optimistic strength governs the stability of the slope.
- Increase in the ru value lowers the
FoS, in other words, increase in pore water pressure reduces the stability of the embankment.
Although some results of the analysis show that failure will occur in the model, this is not a problem since this analysis was not meant to value the stability of the Carsington Dam (not with so much simplification).
This analysis is to determine whether the governing material strength and physical conditions may influence the slope stability. And based from the characteristics above, this analysis succeeds to find that the material strength (i.e. c’ and Φ’ values)
and the pore water pressure govern the stability of the slope.
o Non-Circular Slip Failure Analysis (Two-Wedge Analysis Method)
Different from the previous analysis, this analysis is meant to test the dimension of the Carsington Dam against reasonable material properties and pore water pressure condition in order to approximate the likely FoS against slope failure.
From this simplified analysis, the FoS was approximated to be 1.25. Thus the dam is considered safe against the test values. Although this analysis used many simplifications (e.g. homogenous materials, simplified dimension, etc), it is still representative to describe that the failure which took place in the dam was caused by inadequate material strength and/or higher pore pressure value.
o Post-failure Stability Analysis
This analysis was done in purpose to approximate the actual material properties that would likely to cause failure of the dam. This analysis is the most sophisticated from all, introducing the post failure measured values of the materials as a benchmark for the analysis.
The analysis result (Table 5) shows that for the factor of safety to be equal to 1.00, the strength properties:
• Core and boot : Φ’ = 17.5° ; c’ = 0 kPa
• Yellow clay 1 : Φ’ = 15° ; c’ = 0 kPa
• Yellow clay 2 : Φ = 20° ; c’ = 3 kPa
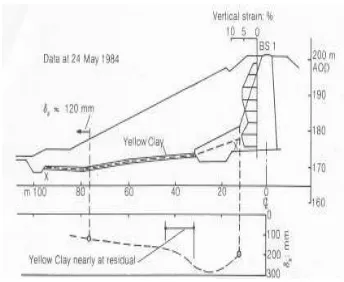
Figure 13. Horizontal movements on line XX and vertical strain in the core (chainage 725)
From this analysis, it can be concluded that the materials in the embankment dam had different conditions. In this case the core and boot material and the yellow clay material (especially near the boot) were estimated to be below their post peak values. This reduction of strength is likely to be the cause of the slope failure.
In overall, the whole analysis of the Carsington Dam has come to a general understanding that the slope stability failure was likely to have been caused by the inadequate material strengths. In accordance, certain factors such as lack of design and/or construction and exposure to destructive chemical substances must not be overlooked.
6. Conclusions
Several conclusions can be derived from this study:
1) The Carsington Dam failure arose many questions as it could be caused by numerous factors which can be physical (mechanism of failure), chemical (material degradation) or administrational (construction method).
2) The stronger the material strength (i.e. c’ and Φ’ values) and the smaller the pore water pressure in the slope the higher the stability
(factor of safety) of the slope, and vice versa.
3) The failure which took place in the dam was likely to have been caused by inadequate material strength which is influenced by certain factors such as lack of design and/or construction and exposure to destructive chemical substances.
7. References
British Standard: 8004, 1986. Code of practice for foundation. Annual book of British Standard, 1986.
Burland, J.B, and Wroth, C.P. 1974.
Settlement of building and
associated damage. Review
paper, session V.611-54.
Settlement of structures.Pentech press. London
Eurocode 7: Geotechnical Design Part 1: General Rules (ENV 1997-1)
M.B Jaksa et all, Towards reliable and effective site investigation,
Geotechnique 55, No. 2 (2005), pp. 109-121.
Skempton & Coates, 1985, Carsington
Dam Failure, Proceedings of
Symposium on Failures in Earthworks, ICE, London