Segmentation of Microscopic Images of Living Cells: A Study
Bazila
1and Dr. A.H. Mir
21
Electronics and Communication Engineer, Department National Institute of Technology, Srinagar (J&K), India 190006
2
Electronics and Communication Engineer, Department National Institute of Technology, Srinagar (J&K), India 190006
1
[email protected], [email protected] Abstract
In this paper, three different segmentation techniques are used, namely, region growing segmentation technique, watershed segmentation and texture segmentation, to accurately extract the shapes of membranes and nuclei from the inverted microscopic images, taken throughout the monolayer formation of BGM-70 (Baby Grevit Monkey) cell culture. This strategy is a prerequisite for an accurate quantitative analysis of cell shape and morphodynamics during organogenesis and is the basis for an integrated understanding of biological processes.
The segmentation of cellular structures is achieved by first normalizing the microscopic images by performing CLAHE operation followed by de-noising by morphological opening and filling of the holes and then applying segmentation algorithm for cell shape reconstruction.
Keywords: Region growing, Watershed segmentation, Texture segmentation, BGM-70 cells, Image de-noising, Image normalization
1. Introduction
The study of cell movement and cell behavior is of fundamental importance in areas such as cell embryology, wound healing, host defense mechanisms, and mechanisms of tumor cell metastasis and invasion. Under both normal and pathological conditions, certain types of cells exhibit extensive motion, often migrating to entirely different parts of the organism. The investigation of cell movement and behavior has led to the development of automated systems designed to quantify the behavior of cells on a 2-d substratum or in a 3-d collagen gel [1]. Computer-controlled stage positioning and digital image acquisition systems enable sequences of cell images to be obtained using time-lapse procedures and analyzed using computer vision and digital image processing techniques.
Analysis of an image begins with a segmentation process, which differentiates meaningful regions of interest from the background. Cell segmentation is also one of the most challenging problems due to both the complex nature of the cells and problems inherent to microscopic images [1]. In both 2- and 3-D tissue culture environments, cells are non-rigid, irregular influences their shapes, which in turn affects their locomotory behavior and ultimately how they function.
optical noise, also play an important role in the effective segmentation of a digital image. Also, typically, the population of cells in one image is large. If we want to count the number of the cells, or study the property of certain cell, cell segmentation is necessary and important. In general, a reliable segmentation is hard because images are noisy (both random and speckle noise). Sometimes many cells will cluster together and even overlap in the sample. The segmentation approach adopted must be robust against these problems in order to ensure that reliable information is obtained. This complicated situation makes the problem more challenging and interesting. Therefore, a lot of people are working on algorithms for Computer-Based cell segmentation of microscope images. There is a wide variety of approaches focusing on different segmentation problems.
One of the popular approaches is active contour models or snakes, first introduced by Terzopoulos and Kass [2, 3]. The basic idea in active contour models (or snakes) is to evolve a curve, subject to constraints from a given image u0, in order to detect objects in that image. Usually, the model contains an edge detector, which depends on the gradient of the image u0. The initial curve is around the object to be detected, and then the curve moves in the normal dimension to itself and ideally stops at the boundary of the object. The main drawbacks of the original snakes are their sensitivity to initial conditions and the difficulties associated with topological transformations.
Another famous model in image segmentation is formulated by Mumford and Shah [4]. In their paper they proposed a minimization problem, the minimizer for the functionals is the optimal piecewise smooth approximation u for the given image u0. In practice, solving the Mumford and Shah model is not an easy job, because the functional involves an unknown set C of lower dimension and usually the problem is not convex. Another approach is level set method. The level set method is a numerical and theoretical tool for propagating interfaces. It was first introduced by Osher and Sethian [4, 5], and has become a more and more popular theoretical and numerical framework within image processing, fluid mechanics, graphics, computer vision, etc. The level set method is basically used for tracking moving fronts by considering the front as the zero level set of an embedded function, called the level set function. In image processing, it is used for equivalent. Each pixel is treated as a vector of the three dimensions namely H, S, and V. The components are weighted to give more importance to the most distinguishing features. In this modeling technique each of the above mentioned region is segmented by a distinct 3-D Gaussian distribution. In the first step, K-means clustering is performed on the 3-D feature vectors. This results in partitioning of the image into distinct regions. The centroids and the variances obtained in the K-means step are used to initialize Gaussian parameters for Expectation Maximization (EM) algorithm. The EM algorithm iterates between segmentation and parameter estimation till convergence [6-8].
1.2. Problem Statement
2. Materials and Methods
taken from the Falcon dishes in a logarithmic phase of growth and plated in new 25 cm2 plastic Falcon dishes.The cultures were observed with a NIKON (JAPAN) compound inverted microscope with an eye piece having magnification of 10X and a lens having magnification of 10X and 20X too. The images were captured using Sony Cyber-shot cameral, a digital still camera (Model No. DSC-H9), having magnification of 15X (Figure 1). The microscope and the camera were placed in a laboratory maintained at the temperature of about 25.0 °C - 37.0 °C.
A B
Figure 1. Input image-BGM-70 Cells on 3rd and Ist Day of the Culture,
Respectively
2.2. Elementary Steps Taken For the Segmentation of the Images of Living Cells.
2.2.1. Image Normalization
:
Image normalization attempts to reduce the effect of variation in the input images due to differing lighting, camera exposure and other settings. Two common methods of normalization are contrast stretching and histogram equalization. Contrast stretching applies a linear transformation to the input image so that the intensity histogram is stretched across the full range of possible pixel intensity values (e.g., 0-255 for the 8-bit gray level images). In order to prevent a relatively small number of outlier pixel intensities adversely affecting the result, it is normal to allow a certain percentage (say, 0.5%-3%) of pixels to become saturated (set to 0 or 255).Image normalization also attempts to resize the input image using either nearest-neighbor interpolation or bilinear interpolation or bicubic interpolation. When the specified output size is smaller than the size of the input image and method is 'bilinear' or 'bicubic', resizing applies a lowpass filter before interpolation to reduce aliasing. The default filter size is 11-by-11. Resizing reduces the processing time.
In our work Contrast-limited adaptive histogram equalization (CLAHE) was performed at the very first step for the standardization of all the images (Figure 2).
A
B
Figure 2. Contrast Enhanced Image-BGM-70 Cells on 3rd and Ist DAY of the
Culture
2.2.2 Image De-noising
:
In order to separate cell regions from the background, the contrast enhanced image was thresholded and the level argument was computed automatically. The result of this process is the binary image shown in Figure 3. The noise present in the image can disrupt the shape information; therefore the de-noising process is an essential preliminary task in images segmentation. Different sources of noise can be identified: the non-homogeneous concentration of the fluorescent proteins in the labeled structures and the electronic noise from the instrument. It can be observed from Figure 3 that foreground objects include not only cells, but also small particles, which can be seen as small white blobs. Small holes can also be seen in the center of some of the cell regions in Figure 3. These holes are caused by contiguous dark cell regions within the input image, where the standard deviation may be very low or even zero, causing them to be considered part of the background. In order to accurately reconstruct the object shape, the de-noising process has to improve the signal-to-noise ratio, faithfully preserving the edges position and definition. Image de-noising still remains a challenge for researchers because noise removal introduces artifacts and causes blurring of the images, also de-noising process may remove image fine structures. To clean up the image, the small particles and holes were removed by doing some morphological processing, such as filling up the holes to the thresholded image of Figure 3, a hole is a set of background pixels that cannot be reached by filling in the background from the edge of the image, performing morphological opening on the thresholded image (Figure 3) with the structuring element (ones (5, 5)), structuring element is a single structuring element object, as opposed to an array of objects, all connected components (objects) that had fewer than 40 pixels were removed producing another binary image Figure 4. The default connectivity is 8 for two dimensions, and 8 for three dimensions.O
nl
in
e
Ve
rsi
on
O
nl
y.
Bo
ok
ma
de
b
y
th
is
fil
e
is
IL
LEG
Figure 3. Thresholded Image-BGM-70 Figure 4. De-noised Image-BGM-70
Cells on 3rd Day of the Culture Cells on 3rd Day of the Culture
2.2.3. Image Segmentation: An outline of the segmentation result of Figure 4 is shown
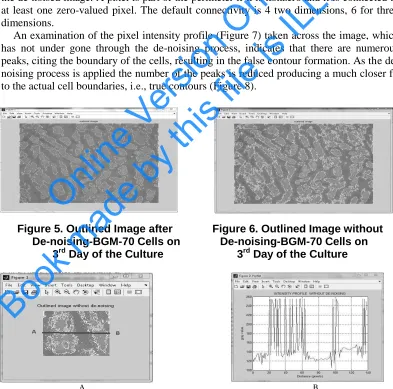
superimposed on the input image in Figure 5. It can be seen that the segmentation result produces a reasonably accurate contour for cell areas where there is halo or where there is not. For getting the accurate contour for the cell areas perimeter pixels are to be found in the de-noised image. A pixel is part of the perimeter if it is nonzero and it is connected to at least one zero-valued pixel. The default connectivity is 4 two dimensions, 6 for three dimensions.
An examination of the pixel intensity profile (Figure 7) taken across the image, which has not under gone through the de-noising process, indicates that there are numerous peaks, citing the boundary of the cells, resulting in the false contour formation. As the de-noising process is applied the number of the peaks is reduced producing a much closer fit to the actual cell boundaries, i.e., true contours (Figure 8).
Figure 5. Outlined Image after Figure 6. Outlined Image without De-noising-BGM-70 Cells on De-noising-BGM-70 Cells on
3rd Day of the Culture 3rd Day of the Culture
A
B
Figure 7. Pixel Intensity Profile (A) Interval AB within an Area in the Image with-out de-noising (B) Intensity Profile of AB before de-Noising
O
nl
in
e
Ve
rsi
on
O
nl
y.
Bo
ok
ma
de
b
y
th
is
fil
e
is
IL
LEG
C
D
Figure 8. Pixel Intensity Profile (C) Interval AB within An Area in the Image after De-noising (D) Intensity Profile of AB After de-Noising
2.3 Results of the Three Different Segmentation Techniques
2.3.1 Region Growing
: In this work morphological operation is done to shrink objects to
points and form a seed. It removes pixels so that objects without holes shrink to a point, and objects with holes shrink to a connected ring halfway between each hole and the outer boundary. This option preserves the Euler number. Morphological opening by reconstruction is performed for the restoration of the shape of the objects in the image. One of the problems in the region growing is the stopping rule. Basically, growing a region should stop when no more pixels satisfy the criteria for inclusion in that region. Criteria such as intensity values, texture, and color, are local in nature and do not take into account the “history” of region growth The method used in this paper, opening by reconstruction restores exactly the shapes of the objects that remain after erosion.Figure 1 is the input microscopic image of BGM-70 Cells on the 3rd day of culture. Before reconstruction of the image from the seed the image normalization is done (Figure 2).
De-noising processing is followed by finding perimeter pixels in the binary image. Figure 9 depicts the boundaries of the cells which on superimposition with the input image (Figure 1) describes the contours of the cells (Figure 10).
We have tried to use the bright objects, which we assume are nuclei (Figure 11). The
extended maxima operator can be used to identify groups of pixels that are significantly higher than their immediate surroundings. Extended maxima transform is the regional maxima of the H maxima transform, H is a non-negative scalar and H = 30 in our case.
The outlined image, Figure 10 is overlapped with the nuclei and the result is shown in Figure 12.
Figure 9. Shape of the fully grown Figure 10. Outlined Image-
BGM-70 Cells on 3rd Day of Culture BGM-70 Cells on 3rd Day of Culture
O
nl
in
e
Ve
rsi
on
O
nl
y.
Bo
ok
ma
de
b
y
th
is
fil
e
is
IL
LEG
Figure 11. Nuclei of BGM-70 Figure 12. Over Lapped Image-
Cells on 3rd Day of Culture BGM-70 on 3rd Day of Culture
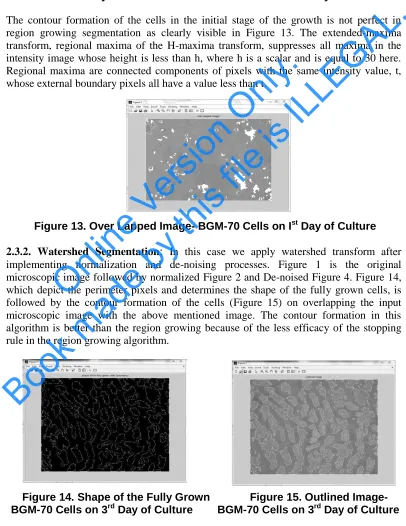
The contour formation of the cells in the initial stage of the growth is not perfect in region growing segmentation as clearly visible in Figure 13. The extended-maxima transform, regional maxima of the H-maxima transform, suppresses all maxima in the intensity image whose height is less than h, where h is a scalar and is equal to 30 here. Regional maxima are connected components of pixels with the same intensity value, t, whose external boundary pixels all have a value less than t.
Figure 13. Over Lapped Image- BGM-70 Cells on Ist Day of Culture
2.3.2. Watershed Segmentation
:
In this case we apply watershed transform after implementing normalization and de-noising processes. Figure 1 is the original microscopic image followed by normalized Figure 2 and De-noised Figure 4. Figure 14, which depict the perimeter pixels and determines the shape of the fully grown cells, is followed by the contour formation of the cells (Figure 15) on overlapping the input microscopic image with the above mentioned image. The contour formation in this algorithm is better than the region growing because of the less efficacy of the stopping rule in the region growing algorithm.Figure 14. Shape of the Fully Grown Figure 15. Outlined Image-
BGM-70 Cells on 3rd Day of Culture BGM-70 Cells on 3rd Day of Culture
O
nl
in
e
Ve
rsi
on
O
nl
y.
Bo
ok
ma
de
b
y
th
is
fil
e
is
IL
LEG
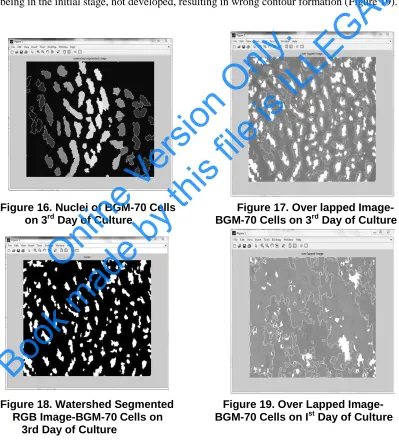
Nuclei are again assumed with the help of extended maxima transform which identifies the groups of pixels that are significantly higher than their immediate surroundings (Figure 16).
Nuclei are overlapped with the Figure 15 to form an image with nuclei as well as with the contours (Figure 17).
Next step is to complement the image so that the peaks become valleys. We do this because we have to apply the watershed transform, which identifies low points, not high points followed by modifying the image so that the background pixels and the extended maxima pixels are forced to be the only local minima in the image.
Now the watershed transform is computed, followed by converting the label matrix (image) into an RGB color image for the purpose of visualizing the labeled regions, Figure 18.
After normalizing Figure 1, as described in the Figure 2, de-noising is performed followed by contour formation. The image is not de-noised perfectly because the cells being in the initial stage, not developed, resulting in wrong contour formation (Figure 19).
Figure 16. Nuclei of BGM-70 Cells Figure 17. Over lapped Image-
on 3rd Day of Culture BGM-70 Cells on 3rd Day of Culture
Figure 18. Watershed Segmented Figure 19. Over Lapped Image-
RGB Image-BGM-70 Cells on BGM-70 Cells on Ist Day of Culture
3rd Day of Culture
2.3.3. Texture Segmentation
: Here the concept of symmetric padding is used; the values
of padding pixels are a mirror reflection of the border pixels in the input image (Figure 1).O
nl
in
e
Ve
rsi
on
O
nl
y.
Bo
ok
ma
de
b
y
th
is
fil
e
is
IL
LEG
It is followed by normalization and then de-noising. In normalization the textured image is rescaled so that its values are in the default range for a double image. In de-noising process a threshold value of 0.58 is selected because it is roughly the intensity value of pixels along the boundary between the cells and the background. A rough mask is made in the de-noising process which extracts the features (Figure 20).
Here the perimeter pixels are computed from the texture filtered image forming the contour of the cells as described in the Figure 22.
Figure 20. Mask for Feature Figure 21. Features Extracted Extraction-De-noised using the Mask-BGM-70
Image-BGM-70Cells on Cells on Ist Day of Culture
Ist Day of Culture
Figure 22. Outlined Image-- BGM-70 Figure 23. Texture Filtered Image
Cells on the Ist Day of Culture using Rangefilt-BGM-70 Cells
on Ist Day of Culture
Figure 23 is the texture filtered image using rangefilt function and Figure 24 is the texture filtered image using stdfilt function. Rangefilt function returns an array where each output pixel contains the range value (maximum value - minimum value) of the 3-by-3 neighborhood around the corresponding pixel in the input image. Input image can have any dimension and the output image is of the same size as that of the input image. By default, rangefilt uses the neighborhood true(3). Rangefilt determines the center element of the neighborhood by floor((size(NHOOD) + 1)/2).
Stdfilt function returns an array where each output pixel contains the standard deviation of the 3-by-3 neighborhood around the corresponding pixel in the input image. Input image again can have any dimension. Here also the output image is of the same size as that of the input image. By default, stdfilt uses the neighborhood ones(3). Stdfilt
O
nl
in
e
Ve
rsi
on
O
nl
y.
Bo
ok
ma
de
b
y
th
is
fil
e
is
IL
LEG
determines the center element of the neighborhood by floor((size(NHOOD) + 1)/2). Figure 1(A) is the microscopic image of the fully grown cells and texture segmentation of the same does not give the perfect results because monolayer is completely formed and has almost shadowed the background, with the result appropriate features are not being extracted and hence no proper contour formation as is clearly visible in the Figure 25.
Figure 24. Texture Filtered Image using Figure 25. Outlined Image—
stdfilt - BGM-70 Cells on Ist Day of Culture BGM-70 Cells
on 3rd Day of Culture
3. Conclusion
Segmentation of living cell images presents a number of problems. Firstly, the images must be taken in a non-invasive manner so that the cells may continue to grow unharmed. This precludes the use of fluorescent markers and histological stains that can make segmentation much simpler. Furthermore, the nature of images taken using inverted microscope renders standard segmentation approaches ineffective. For example, the background gray levels are a subset of the cell gray levels and so intensity thresholding cannot be used. Furthermore, the halo that appears around many cell borders creates false edges when standard edge detection methods are applied.
Three elementary steps are taken to overcome the above mentioned problems for the segmentation of the living cell images:
Normalization to reduce the effect of variation in the input images due to differing lighting, camera exposure and other settings. The method used, has a limitation as it flattens the image histogram towards a uniform distribution
De-noising in order to accurately reconstruct the object shape. Then applying segmentation algorithm for cell shape reconstruction.
Visual inspection of the segmentation results reveals that for the initial stage of the culture, texture segmentation is preferred over region growing and watershed segmentation. The contour formation in the texture segmentation is done by computing the perimeter pixels (boundary) of the texture filtered image by calculating the local entropy of the intensity image, as is not the case in watershed and region growing algorithms. In watershed and region growing algorithms the perimeter pixels (boundary) are computed in a binary thresholded image.
Again from the visual inspection of the results we can bring out that contour formation of the fully grown cells is better when watershed segmented rather than region growing algorithm, because of the less efficacy of the stopping rule for the reconstruction of the image from the seed.
The algorithm can be improved by integrating the segmentation of membranes and of nuclei with the sub-nuclear bodies in the same process.
crossing of functional analysis and statistics. In spite of the sophistication of all the proposed methods, most algorithms have not yet attained a desirable level of applicability. All show an outstanding performance when the image model corresponds to the algorithm assumptions, but fails in general and creates artifacts or removes image fine structures. We may intend to propose an algorithm addressing the preservation of structure in a digital image.
References
[1] T. Chan, “Some recent developments in variational image segmentation”, UCLA CAM Report cam06-52, (2006).
[2] T. Chan, “Active contour and segmentation models using geometric PDE’s for medical images”, UCLA CAM Report, (2000).
[3] T. Chan, “Active contours without edge”, IEEE Trans. on Image Processing, (2001), pp. 86-277. [4] T. Chan, “Image segmentation using level sets and the piecewise constant Mumford-Shah Model”,
UCLA CAM Report cam00-14, (2000).
[5] S. Osher, “Level set methods and dynamic implicit surfaces”, Springer, New York, (2003).
[6] I. Ersoy, “Multi-Feature Contour Evolution for Automatic Live Cell Segmentation in Time Lapse Imagery”, 30th Annual International IEEE EMBS Conference Vancouver, British Columbia, Canada, (2008).
[7] C. J. Bradhurst, “Segmentation of Bone Marrow Stromal Cells in Phase Contrast Microscopy Images”, IEEE Xplore, (2008), pp. 1-2.
[8] A. Korzynskan Wojciech Strojny, “Segmentation of microscope images of living cells”, Springer, (2007) April.
[9] R. C. Gonzalez, “Digital Image Processing”, Pearson Education, Inc. Upper Saddle River, New Jersey, (2008).
[10] R. C. Gonzalez, “Digital Image Processing Using MATLAB”, Pearson Education, Inc. Upper Saddle River, New Jersey, (2008).
[11] W. K. Pratt, “Digital Image Processing”, Fourth Edition, Pixelsoft, Inc. Los Altos, California, (2007).
Author
Bazila
Research Scholar
Electronics and Communication Engineer, Department
National Institute of Technology, Srinagar (J&K), India 190006 [email protected]