1
COORDINATION CONTROLLER POWER SYSTEM
IN JAVA-BALI 500 KV INTERCONECTED BASED ON COMBINATION
BACTERIA FORAGING AND PARTICLE SWARM OPTIMIZATION
FOR SMALL SIGNAL STABILITY IMPROVEMENT
1,2
IBG Manuaba,
2AAN Amrita,
1Ardyono Priyadi and
1Mauridhi Hery Purnomo
1
Department of Electrical Engineering, Sepuluh Nopember Institute of Technology, Surabaya
2
Department of Electrical Engineering, Udayana University, Denpasar
E-mail:
11
1Abstrak
Stabiliser sistem tenaga dan pengendali redaman sistem transmisi fleksibel telah banyak digunakan untuk meningkatkan stabilitas sistem tenaga listrik. Metode pengendalian yang terkoordinasi berdasarkan teori evolusi komputasi gabungan diusulkan untuk mengatasi beberapa pengendali redaman secara bersamaan untuk menjaga pada tingkat redaman sistem tenaga listrik yang diijinkan. Pengendali ini bekerja penuh dengan penggunaan interaksi yang menguntungkan diantara interaksi yang merugikan pengendalian dan meminimalkannya sehingga osilasi sistem tenaga listrik dapat ditekan secara efektif. Penalaan pengendali
proporsional integral derivatif (PID) yang berbasiskan stabiliser sistem tenaga PSS3B (PIDPSS3B), kompensator var statis dan regulator tegangan otomatis disajikan dalam tulisan ini. Parameter gain kontroler PID seperti proporsional, faktor integral, koefisien diferensial serta regulator tegangan otomatis dipilih dan dioptimalkan oleh metode BF-PSOTVAC. Standar kesalahan absolut waktu terpisah desain optimasi sebagai fungsi tujuan. Hasil simulasi menunjukkan bahwa indeks kinerja sistem berdasarkan metode yang diusulkan adalah 42,7890. Metode BF-PSOTVAC memiliki kemampuan untuk meredaman secara optimal dan menekan
erornya sampai minimal.
Kata kunci:PSS, PID, SVC, BF-PSOTVAC.
Abstract
Power system stabilizer (PSS) and flexible AC transmission system (FACTS) damping controller to improve the stability of the power system has been widely used. A coordinated control method based on the combined computational evolutionary theory is proposed to overcome some of damping controllers simultaneously so as to keep the allowable level of power system damping. It works by making full use of favorable interaction between the controlling and minimizing adverse interactions so that the power system oscillations can be suppressed effectively. Proportional integral derivative (PID) controller tuning based power system stabilizer types PSS3B (PIDPSS3B), static var compensator (SVC) and automatic voltage regulator (AVR) presented in this paper. PID controller gain parameters such as proportional, integral factor, differential coefficient and get AVR selected and optimized by BF-PSOTVAC. The integral time absolut error (ITAE) standards of optimization design as objective function. The results of simulations show that performance index of system the proposed method is 42.7890. The BF-PSOTVAC method has the capability to damping optimally and suppresses error to minimum.
2
INTRODUCTION
The dynamic stability in electric power system gives capability of any component of generator to give response in load change. One of the most complex phenomena of power system dynamics are power system electromechanical oscillations. Dynamic stability is related to the ability of power system to increase synchronization when there are small power changes. A dynamic change in power system makes oscillation in system. Damping oscillation in power system can be using power system stabilizer. The power system stabilizer (PSS) adds a stabilizing signal to automatic voltage generator (AVR) gain to modulate the generator excitation. Main task of PSS is to create damping electrical torque component in phase with rotor speed deviation in turbine shaft, increase the generator damping. [1]
The study of the impact of flexible alternating current transmission systems (FACTS) devices on power system dynamics has become a topic of great research importance. FACTS devices play an important role in maximizing the utilization of existing electric power transmission systems. FACTS devices have the ability to make a power system be operated in a more flexible, secure, and economical. Generally, a potential motivation for the accelerated use of FACTS devices is the deregulation environment in contemporary utility business. Along with primary function of the FACTS devices, the real power flow can be regulated to mitigate the low frequency oscillations and enhance power system stability. Among the several types of FACTS devices, static var compensator (SVC) is selected to be developed in this research [2] [3].
Stabilizing control schemes using intelligent procedures have been proposed in recent years. The reason for the lack of stability analysis is due to the complexity of the power systems. Moreover, industry will be reluctant to accept controller design if stability cannot be guaranteed. As a result, the stability may be difficult to adjust the PID controller parameters through analytical methods. Recently, evolutionary computation techniques such as genetic algorithm [8], particle swarm optimization (PSO) [5]-[7], rule based bacteria foraging [9] have been applied for PSS
parameter optimization to obtain the optimal controller parameters. These evolutionary algorithms are heuristic population-based search procedures that incorporate random variation and selection operators. Although, these methods seem to be good ones for the solution of PSS parameter optimization problem, when the system has a condition where parameters being optimized are highly correlated and number of parameters to be optimized is large, they have degraded efficiency to obtain global optimum solution and also simulation process using a lot of computing time.
This paper proposed a method applied to optimize the proportional-integral-derivative (PID) based PSS type PSS3B, AVR gain and SVC to damp the oscillation on power system. The bacteria foraging – particle swarm optimization with time varying accelerator coefficient (BF-PSOTVAC) is a method to optimize PID based PSS type PSS3B, AVR gain and SVC used in this research on optimization problem. The comparison result of the methods to others i.e. open loop system, conventional PSS, conventional PID based PSS type PSS3B, AVR-PID based PSS type PSS3B and SVC optimized by BF, AVR-PID based PSS type PSS3B and SVC optimized by BF-PSO and AVR-PID based PSS type PSS3B and SVC optimized by BF-PSOTVAC was carried out to find the difference of damping oscillation simulation results.
.
POWER SYSTEM STABILIZER
The operational function of a PSS is to produce a proper torque on the rotor of the machine involved in such a way that the phase lag between the exciter input and the machine electrical torque is compensated. Supplementary stabilizing signal considered is one proportional to speed. The transfer function of the i-th
(
)(
)
(
1)(
1)
( )
1 1 1
1 3
2 4
i
sT sT
sT
U K s
sT sT sT
i i
w
i i
w i i
ω
+ +
= ∆
+ + +
PSS is given by: [4]
(1) Where, Δωi is the deviation in speed from the
synchronous speed. This type of stabilizer consists of a washout filter, a dynamic compensator. The output signal, Ui is used for
3 filter, is used to reset the steady-state offset in the output of the PSS.
PID
The PID control algorithm remains the most popular approach for industrial process control despite continual advances in control theory. The transfer function of a PID controller is described as follows[6]:
( )
iG s k k s
s
k c = p+ + d
(2) Where kp, ki, and kd are the proportional,
integral and derivative gains, respectively. Amplitude and phase which is required for stabilized signal was obtained by matching polarity and constants of gain KS1 and KS2.
Phase compensation was prepared by filter A1
to A8. The maximum influence of stabilized
signal which is permitted at AVR is between
VSTMAX and VSTMIN
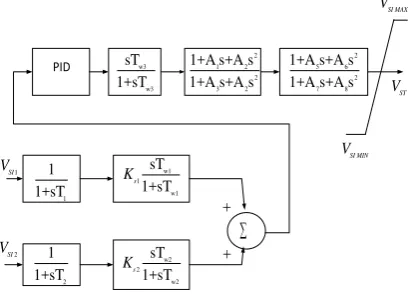
PIDPSS3B
Supplementary excitation control, commonly referred to as PSS has become an important means to enhance the damping of low frequency oscillations. PSS model PSS3B has dual inputs those are an electrical power and rotor angular frequency deviation. In particular, this model can be used to represent two distinct types of dual-input stabilizer implementations as described as follows:[15] •Stabilizers that, in the frequency range of
system oscillations, act as electrical power input stabilizers. These use the speed or frequency input for the generation of an equivalent mechanical power signal, to make the total signal insensitive to mechanical power change.
•Stabilizers that use a combination of speed (or frequency) and electrical power. These systems usually use the speed directly (i.e., without phase-lead compensation) and add a signal proportional to electrical power to achieve the desired stabilizing signal shaping.
Equivalent mechanical power signal was obtained using signals. This signal was combined with electrical power to result accelerating power. A transducer time constant is represented by time constants T1 and T2. The
washout time constants, rotor angular speed, and derived mechanical power respectively are
represented by time constants TW1 to TW3 [6].
The PID was embedded before washout block diagram of this power system model. PIDPSS3B is a development of power system stabilizer PSS3B.
w3
w3
sT 1+sT
2
1 2
2
3 2
1+A s+A s 1+A s+A s
2
5 6
2
7 8
1+A s+A s 1+A s+A s
w2 2
w2
sT 1+sT
s K
w1 1
w1
sT 1+sT
s K
1
1 1+sT
2
1 1+sT
∑
2
SI V
1
SI
V SI MIN
V SI MAX V
ST V
+
+
PID
FIGURE 1. PSS type PSS3B embedded with PID
.
STATIC VAR COMPENSATOR
FACTS devices have evolved to bring major changes to the system of power that led to the development of a resource controlled static var. The development of SVC started in the 60s, which was originally only used to control the voltage quickly to cope with change and large-scale industrial load unexpected. The primary purpose of application of SVC is to control voltage or power flow along transmission line or to increase transmission capacity. In addition it can suppress power system oscillations if a damping control function is added, especially for loosely connected power systems. SVC will inject reactive power by generating reactive power (SVC capacitive) of the capacitor bank at a low voltage system. But otherwise, the SVC will absorb reactive power from the system (SVC inductive) if it is in overvoltage. Setting the amount of reactive power absorbed or injected influenced by setting the ignition angle of the thyristor inverter circuit. SVC model is shown in Figure 2. [3]
Thyristor Bus j
capasitor Inductor
4 BACTERIA FORAGING
The Escherichia Coli (E. coli) bacteria that are present in our intestines have a foraging strategy governed by four processes namely Chemo-taxis, Swarming, Reproduction, Elimination and Dispersal [9]. Chemo-taxis is achieved through swimming and tumbling. Depending upon the rotation of the flagella in each bacterium it decides whether it should move in a predefined direction (swimming) or an altogether different direction (tumbling), in the entire lifetime of the bacterium. The base idea of BF is natural selection tends to eliminate animals with poor foraging strategies and favor those having successful foraging strategies. After many generations, poor foraging strategies are either eliminated or reshaped into good ones. To represent a tumble, a unit length random direction, say +(j), is generated; this will be used to define the direction of movement after a tumble. To represent a tumble, a unit length random direction, say φ(j), was generated; this would be used to define the direction of movement after a tumble. The equation is below:
(
j 1, ,k l)
(
j k l, ,) ( ) ( )
C i ji i
θ + =θ + φ
(3) Where θi (j, k, 1) represents the ith bacterium at
jth chemo-tactic kth reproductive and Ith
Swarming is always desired that the bacterium which has searched optimum path of food should try to attract other bacteria so that they reach the desired place more rapidly. Swarming makes the bacteria congregate into groups.
elimination and dispersal step. C(i ) is the size of the step taken in the random direction specified by the tumble. 'C' is termed as the 'run length unit'
Reproduction -The least healthy bacteria die and the other healthiest bacteria each split into two bacteria, which are placed in the same location. This makes the population of bacteria constant.
Elimination and Dispersal is possible that in the local environment, the life of a population of bacteria changes either gradually or suddenly due to some other influence. Events can kill or disperse all the bacteria in a region. This process can possibly destroy the chemo tactic progress, but in contrast they also assist it, since dispersal may place bacteria near good
food sources. Elimination and dispersal helps in reducing the behavior of stagnation,( i.e. being trapped in a premature solution point or local optima).
PARTICLE SWARM OPTIMIZATION
PSO is a population-based optimization
techniques proposed for the unconstrained
minimization problem.
PSO is inspired by particles moving around in the search space. The individuals in a PSO thus have their own positions and velocities.Each solution called
a ‘‘particle’’, flies in the problem search
space looking for the optimal position to
land.
Each particle adjusts its trajectory towards its own previous best position, and towards the best previous position. This position is called the personal best and is denoted by Ppb. Among these Pi, there is onlyone particle that has the best fitness, called the global best, which is denoted by Pgb.
A
particle, as time passes through its quest,
adjusts its position according to its own
‘‘experience’’ as well as the experience of
neighboring particles.
PSO system
combines local search method (through
self experience) with global search method
(through
neighboring experience),
attempting to balance exploration and
exploitation.
PSO is a stochastic global optimization method which is based on simulation of social behavior. PSO consists of a population refining its knowledge of the given search space. The velocity update equations of PSO are given by [5][13]1
1 1 b 2 2 b
Vik Vik c rk Pk Xik c rk Pk Xik
i p i g
ω
= + − + −
+
:
(4)
1 1
Xik+ =Xik+Vik+
The position update equations of PSO are:
Where
i
= 1, 2
,….N
N
= the size of the population
= a constriction factor that constrict
velocities
ω
= the inertia weight
5
r
i1, r
i2=
random numbers uniformly
distributed within the range [0, 1]
X
ikP
pb= position of particle
i
at iteration
k
k
P
gb= best position of particle
i
at
iteration
k
k
= best position of the group at
iteration
k
TIME VARYING ACCELERATOR COEFFICIENT
TVAC is to enhance the global search in the early part of the optimization and to encourage the particles to converge towards the global optima at the end of the search. This is achieved by changing the acceleration coefficients c1 and c2 with time in such a
manner that the cognitive component is reduced while the social component is increased as the search proceeds. With a large cognitive component and small social component at the beginning, particles are allowed to move around the search space instead of moving toward the population best during early stages. Technique of PSO with time varying inertia weight can locate good solution at a significantly fast rate, its ability to fine tune the optimum solution is weak, mainly due to the lack of diversity at the end of the search. In population-based optimization methods, the policy is to encourage individuals to roam through the entire search space during the initial part of the search, without clustering around local optima. During the latter stages, convergence towards the global optima is encouraged, to find the optimal solution efficiently. On the other hand, a small cognitive component and a large social component allow the particles to converge to the global optima in the latter part of the optimization process. The acceleration coefficients are expressed as [10]:
(
)
1 1 1 1
max iter
c C C C
iter
f i i
= − +
(
)
2 2 2 2
max iter
c C C C
iter
f i i
= − +
(5) Where C1i, C1f, C2i and C2f are respectively,
initial and final values of cognitive and social acceleration factors. The concept of time varying inertial weight was introduced as per which W is given by [6, 7]
(
)
maxmin min
max iter iter
W W W W
iter
max −
= − +
(6)
iter is the current iteration number while
itermax is the maximum one. Usually, the value
of W is varied between 0.9 and 0.4. Constant c1
pulls the particles towards local best position whereas c2 pulls it towards the global.
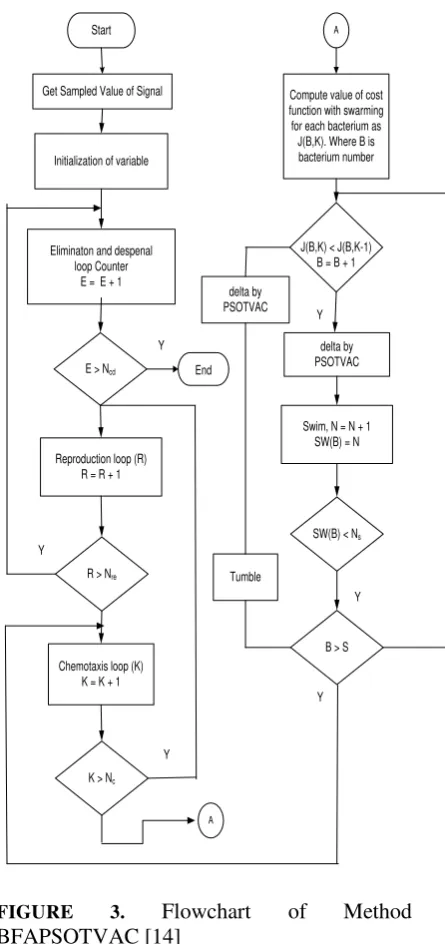
COMBINATION METHOD
BF-PSOTVAC performs local search through the chemo-tactic movement operation of BF whereas a PSO operator accomplishes the global search over the entire search space. In this way, it makes full use of the ability of bacteria foraging algorithm for acquire new solution in the dispersed and eliminated then also to exchange social information.
Get Sampled Value of Signal
Initialization of variable
Chemotaxis loop (K) K = K + 1
E > Ncd
Reproduction loop (R) R = R + 1
R > Nre
K > Nc
J(B,K) < J(B,K-1) B = B + 1
delta by PSOTVAC
delta by PSOTVAC Compute value of cost function with swarming for each bacterium as J(B,K). Where B is bacterium number
Tumble Y
Y
Y
Y End Start
Eliminaton and despenal loop Counter
E = E + 1
A
A
Swim, N = N + 1 SW(B) = N
SW(B) < Ns
B > S Y
Y
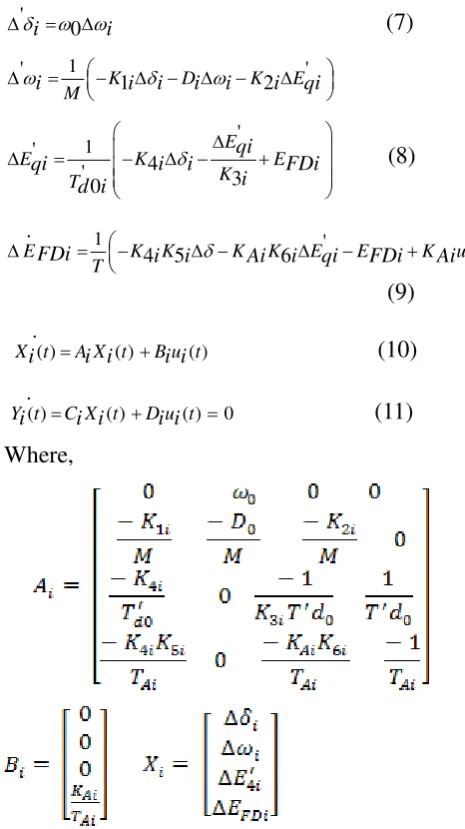
6 POWER SYSTEM MODELING
State space formulation of block diagram
power system modeling can be expressed
as follow:[4]
' 0
i i
δ ω ω
∆ = ∆
(7)
1
' '
1 2
K D K E
M
i i i i i i qi
ω δ ω
∆ = − ∆ − ∆ − ∆
1 '
'
4
' 3
0
E
E K E
K T
qi
qi i i FDi
i d i
δ
∆
∆ = − ∆ − +
(8)
1 .
'
4 5 6
E K K K K E E K u
T
FDi i i δ Ai i qi FDi Ai i
∆ = − ∆ − ∆ − +
(9)
( ) ( ) ( )
.
X ti =A X ti i +B u ti i
(10)
( ) ( ) ( ) 0
.
Y ti =C X ti i +D u ti i =
(11)
Where,
A is system matrix, B is input matrix and
X is state variable
SIMULATION AND RESULT ANALYSIS
The system used for simulation is the Java-Bali 500 kV interconnection power system in Indonesia. The system consists of 23 buses with 28 transmission line and 8 generators. The generators connected to the system such as Suralaya, Muaratawar, Cirata, Saguling, Tanjungjati, Gresik, Paiton, and Grati. Cirata and Saguling generators are hydro generator, the others are thermal generators. Suralaya generator in this system is act as slack
generator. The single diagram of Java-Bali 500kV interconnection power system described in Figure 10. The system data of load bus is obtained from PT PLN (Persero) P3B Java-Bali.
FIGURE 4.Single Line Diagram of Java-Bali 500 kV Power System
7 TABLE 1. DATA LOAD AND GENERATION INTERCONNECTION SYSTEM JAVA-BALI
500 KV
Bu s No
Bus Name Bus
code
Generator Load
MW MVA
R MW
MVA R 1
Suralaya Swing 3211.
6 1074.1 219 67
2 Cilegon Load 0 0 333 179
3 Kembangan Load 0 0 202 39
4 Gandul Load 0 0 814 171
5 Cibinong Load 0 0 638 336
6 Cawang Load 0 0 720 217
7
Bekasi Load 0 0 112
6 331
8
Muaratawar Generato
r 1760.
0 645.0 0 0
9
Cibatu Load 0 0 115
2 345
10
Cirata Generato
r 948.0 200.0 597 201
11
Saguling Generato
r 698.4 150.0 0 0
12 BandungSelata
n Load 0 0 477 254
13 Mandiracan Load 0 0 293 65
14 Ungaran Load 0 0 193 118
15
Tanjung Jati Generato
r
1321.
6 90.0 0 0
16 Surabaya
Barat Load 0 0 508 265
17
Gresik Generato
r 900.0 366.3 127 92
18 Depok Load 0 0 342 95
19 Tasikmalaya Load 0 0 133 33
20 Pedan Load 0 0 365 101
21 Kediri Load 0 0 498 124
22
Paiton Generato
r 3180.
0 917.3 448 55
23
Grati Generato
r 398.6 100.0 180 132
24 Balaraja Load 0 0 732 287
25 Ngimbang Load 0 0 264 58
In table 2, we know that proposed method has the capability to minimize error. From table 3, we can see the parameters of Kp, Ki, and Kd
which has been optimized with the BFA-PSOTVAC and are optimized to the other methods.
TABLE 2. COMPARISON PERFORMANCE INDEX WITH OTHER METHOD
Performance Index
Method ITAE
No Control 460.9866
CPSS+SVC 108.1126
PIDPSS+SVC 93.8374
PIDPSS3B+SVC 66.5966
Optimization BFA 64.3780
Optimization BFA-PSO 42.7890
TABLE 3. DATA OPTIMIZATION VALUE OF PARAMETERS VALUE OF Kp, Ki, AND Kd
PIDPSS3B G1 G2 G3 G4
Kp 0.7512 0.7512 0.7512 0.7512
Ki 0.1211 0.1211 0.1211 0.1211
Kd 0.2508 0.2508 0.2508 0.2508
Kp BFA 0.6251 0.5532 0.7261 0.3410 Ki BFA 0.1101 0.1201 0.1123 0.2531 Kd BFA 0.1512 0.2217 0.1254 0.2308 Kp BFA-PSO 0.8147 0.9134 0.9649 0.2785 Ki BFA-PSO 0.1058 0.3324 0.2469 0.3576 Kd BFA-PSO 0.1270 0.3975 0.1575 0.1706
PIDPSS3B G5 G6 G7 G8
Kp 0.7512 0.7512 0.7512 0.7512
Ki 0.1211 0.1211 0.1211 0.1211
Kd 0.2508 0.2508 0.2508 0.2508
Kp BFA 0.8131 0.4891 0.6829 0.4115 Ki BFA 0.3641 0.1154 0.1311 0.1521 Kd BFA 0.1508 0.4121 0.1518 0.1251 Kp BFA-PSO 0.9572 0.1419 0.7922 0.1357 Ki BFA-PSO 0.2854 0.1218 0.1595 0.1491 Kd BFA-PSO 0.3003 0.5157 0.2557 0.1340
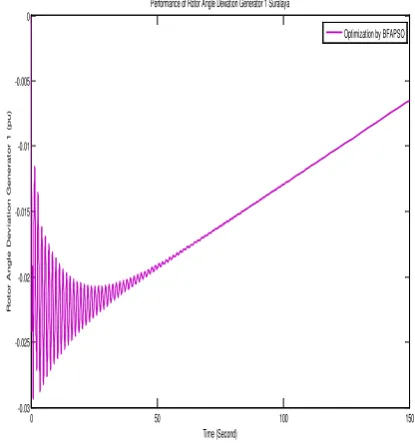
Figure 5 until Fig. 11 are comparison result between our method and other methods with and without SVC. Comparison in performance of rotor angle deviation is shown in Fig. 8 and Fig. 9, while comparison in speed rotor angle deviation is shown in Fig. 10 and Fig. 11.
0 50 100 150
-0.03 -0.025 -0.02 -0.015 -0.01 -0.005 0
Time (Second)
R
ot
or
A
ngl
e D
ev
i
at
i
on G
ener
at
or
1 (
pu)
Performance of Rotor Angle Deviation Generator 1 Suralaya
Optimization by BFAPSO
8
0 50 100 150
-0.03 -0.025 -0.02 -0.015 -0.01 -0.005 0 0.005 0.01 Time (Second) R ot or A ngl e D ev i at ion G ener at or 1 ( pu)
Performance of Rotor Angle Deviation Generator 1 Suralaya
No Control PIDPSS+SVC PIDPSS3B+SVC Optimization by BFA Optimization by BFAPSO
FIGURE 6. Comparison of performance rotor angle deviation
0 50 100 150
-4 -3 -2 -1 0 1 2x 10
-4 Time (Second) F r equenc y A ngl e D ev iat ion G ener at or 1 ( pu)
Performance of Frequency Angle Deviation Generator 1 Suralaya
Optimization by BFAPSO
FIGURE 7.Performance of frequency angle deviation with BFA-PSO
0 50 100 150
-4 -3 -2 -1 0 1 2x 10
-4 Time (Second) F r equenc y A ngl e D ev iat ion G ener at or 1 ( pu)
Performance of Frequency Angle Deviation Generator 1 Suralaya No Control PIDPSS+SVC PIDPSS3B+SVC Optimization by BFA Optimization by BFAPSO
FIGURE 8.Comparison of performance frequency angle deviation
0 50 100 150
-1 -0.5 0 0.5 1 1.5 2 2.5 3 3.5x 10
-3 Time (Second) V ol t age G ener at or 1 ( pu)
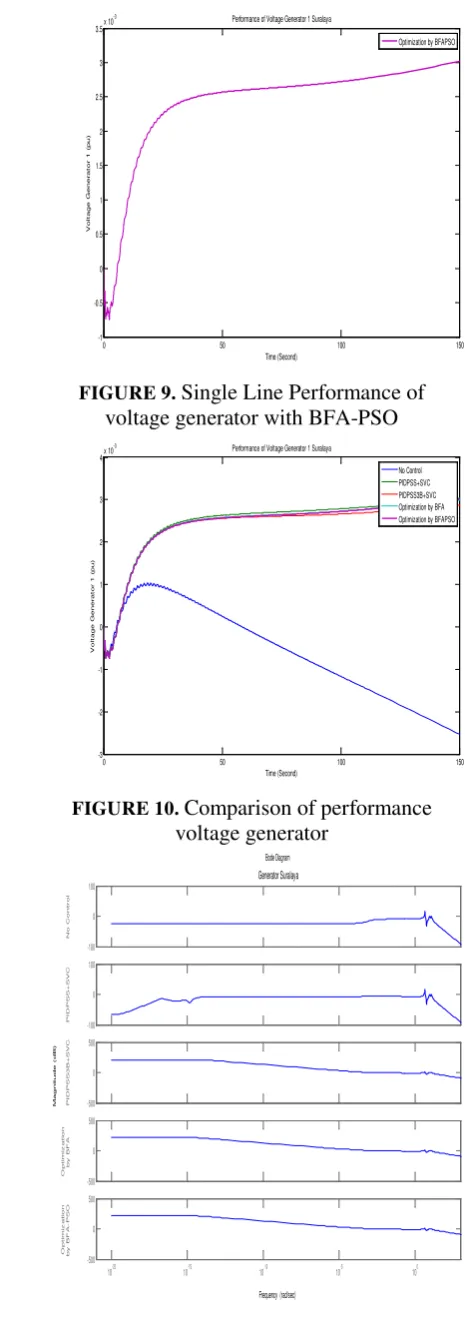
Performance of Voltage Generator 1 Suralaya
Optimization by BFAPSO
FIGURE 9.Single Line Performance of voltage generator with BFA-PSO
0 50 100 150
-3 -2 -1 0 1 2 3 4x 10
-3 Time (Second) V ol tage G ener at or 1 ( pu)
Performance of Voltage Generator 1 Suralaya
No Control PIDPSS+SVC PIDPSS3B+SVC Optimization by BFA Optimization by BFAPSO
FIGURE 10.Comparison of performance voltage generator
Bode Diagram
Frequency (rad/sec)
M agni t ude ( dB )
10-20 10-15 10-10 10-5 100 -500 0 500 O p t im iz a t io n b y BF A-PSO -500 0 500 O p t im iz a t io n b y BF A -500 0 500 PI D PSS3 B+ SVC -100 0 100 PI D PSS+ SVC -100 0 100 N o C ont r ol Generator Suralaya
9 Figure 11 showed that all the performance of bode diagram with several methods. It indicated that the proposed method had more advantages compared to other methods.
CONCLUSION
The bacteria foraging – particle swarm with time varying acceleration coefficient (BF-PSOTVAC) is the proposed algorithm in this paper has the capability to damping optimally for the enhancement of dynamic stability. Gain setting of PID-PSS3B has been optimized using BFA-PSOTVAC. Performance index of systems was obtained using BFA-PSOTVAC method: 42.7890. The proposed method has suppresses error to minimum.
ACKNOWLEDGEMENTS
The authors are grateful to the Universitas Udayana for HUPS Research Grant that we received.
REFERENCES
[1] Selvabala, B., and Devaraj, D., " Co-Ordinated Tuning of AVR-PSS Using Differential Evolution Algorithm",
[2]
pp. 439-444, 2010.[3]
Abido, M.A. , "Power System Stability Enhancement Using FACTS Controlles: A Review", The Arabian Journal for Science and Engineering, Vol 34, No 1B, pp. 153 -172, 2008.
[4]
Abido, M.A., and Y.L. Abdel-Magid,"Coordinated design of a PSS and an SVC-based controller to enhance power system stability", Electrical Power and Energy Systems, pp. 695-704, 2003.
[5]
Saadat, Hadi "Power System Analysis", Mc.Graw Hill Companies, Singapore, 2004.
[6]
Shayeghi, H., Safari, A., and Shayanfar, H. A., "Multimachine Power System Stabilizers Design Using PSO Algorithm", International Journal Of Electrical Power and Energy Systems Engineering, pp. 226-233, 2008.
Swarm Optimization," WSEAS Transactions on Power Systems, vol. 3, pp. 465-474, 2008/6 2008.
Oonsivilai, A., and Marungsri, B., "Stability Enhancement for Multi-machine Power System by Optimal PID Tuning of Power System Stabilizer Using Particle
[7]
[8]
El-Zonkoly, A. M., "Optimal Tuning of Power Systems Stabilizer and AVR Gains Using Particle Swarm Optimization," Elsevier Expert Systems with Applications, vol. 31, pp. 551-557, 2006.
[9]
Hosseini, S. H., Rahnavard, R., and Kharrati, H., "Application of Genetic Algorithm to Design PID Controller for Power System Stabilization,"
[10]
Korani, W. M., Dorrah, H. T., and Emara, H. M., "Bacterial Foraging Oriented by Particle Swarm Optimization Strategy for PID Tuning," IEEE International Symposium on Computation Intelligence in Robotic and Automation (CIRA), pp. 445-450, 2009.
[11]
Chaturvedi, K. T., Pandit, M., and Srivastava, L., "Particle Swarm Optimization With Time Varying Acceleration Coefficients For Non-Convex Economic Power Dispatch " Elsevier Electrical Power and Energy Systems, 2009.
[12]
Mishra, S., "A Hybrid Least Square-Fuzzy Bacterial Foraging Strategy for Harmonic Estimation " IEEE Transactions on Evolutionary Computation, vol. 9, pp. 61-73, 2005.
[13]
Sinha, N., Lai, L. L., and Rao, V. G., "GA optimized PID controllers for automatic generation control of two area reheat thermal systems under deregulated environment", DRPT 2008. Third International Conference on Electric Utility Deregulation and Restructuring and Power Technologies, 2008. , pp. 1186-1191, 2008
[14]
Manuaba, I. B. G., Hartati, R. S., Soeprijanto, A., and Purnomo, M. H., "The Application of Particle Swarm Optimization Method to Solve Economic Dispatch Problem in Electric Power System Bali", The 11th Seminar On Intelligent Technology and Its Applications, vol. 11, 2010
10
Optimization", The 4th International Conference on Modeling, Simulation and Applied Optimization (ICMSAO 2011), Kuala lumpur, Malaysia, April 2011, 508-514.