Published Online July 2015 in SciRes. http://www.scirp.org/journal/gep http://dx.doi.org/10.4236/gep.2015.35009
An Experimental Study on Measurement
Methods of Bulk Density and Porosity
of Rock Samples
Weiren Lin
1*, Osamu Tadai
2, Manabu Takahashi
3, Daisaku Sato
4, Takehiro Hirose
1,
Wataru Tanikawa
1, Yohei Hamada
1, Kentaro Hatakeda
2 1Kochi Institute for Core Sample Research, Japan Agency for Marine-Earth Science and Technology, Nankoku, Japan
2
Department of Marine & Earth Sciences, Marine Works Japan Ltd., Nankoku, Japan 3
Research Institute of Earthquake and Volcano Geology, National Institute of Advanced Industrial Science and Technology, Tsukuba, Japan
4
Graduate School of International and Area Studies, Hankuk University of Foreign Studies, Seoul, Korea Email: *[email protected]
Received 29 May 2015; accepted 10 July 2015; published 17 July 2015
Abstract
Density and porosity are fundamental and important physical properties of rocks in various geo-logical problems, and affect the other physical properties. Therefore, measurements of density and porosity of rock samples are important investigation items in both geo-science and geo-engi- neering areas. Several measurement techniques of the density and porosity are available and be-ing applied currently. To ensure the data quality and to conduct its quality assessment, compari-son of measurement results by different measurement techniques is necessary since the tech-niques are based on different principles and test procedures. In this study, we collected eight types of rock samples including a gabbro, a granite, four sandstones, a welded tuff and a mudstone as study materials, and also prepared several metal specimens for the experimental comparison. The porosities of the eight rocks covered a very wide range from 0.3% to 50% approximately. We employed three methods (caliper, buoyancy and helium-displacement pycnometer) to measure volumes of regularly-shaped specimens and to determine their bulk densities and porosities. As a result, the three techniques yielded almost same bulk densities and porosities for all the speci-mens. In addition, we also applied mercury intrusion porosimetry to measure density and porosi-ty as well as to determine pore size distribution of the rock samples. Porosiporosi-ty values obtained by the porosimetry method were underestimated in the case of high-porosity (soft) rock samples and overestimated for the very low-porosity rock samples. Ability to determine pore size distribution, however, is a very important advantage of the porosimetry method.
Keywords
Rock, Density, Porosity, Caliper Method, Buoyancy Method, Helium-Displacement Pycnometer, Mucury Intrusion Posimetry
1. Introduction
Density and porosity are fundamental and important physical properties of rocks in various geological problems, and affect the other physical properties such as elastic wave velocity, permeability, resistivity, strength, Young’s modulus etc. (e.g. Schon 1998) [1]. Therefore, measurements of density and porosity using drilling core samples retrieved from depths and rock samples taken from geological outcrops are the most popular and important in-vestigation items in both geo-science and geo-engineering fields. Several measurement techniques of bulk den-sity and poroden-sity are available and currently applied in the fields (Franclin, 1979) [2]. To ensure the data quality, comparison and examination of the measurement results by the different measurement techniques are necessary since the techniques are based on different principles and test procedures. In this experimental study, for com-parison of measurement results we collected eight types of rock samples including a gabbro, a granite, four sandstones, a welded tuff and a mudstone as test materials, and also several metal samples and then measured the density and porosity of the rock samples by different techniques. The porosities of the eight rocks covered a very wide range from 0.3% to 50% approximately. We employed three methods (caliper, buoyancy and he-lium-displacement pycnometer also called gas pycnometer) to measure volume of regularly-shaped specimens and to determine the bulk densities and porosities of the rock samples (Franclin, 1979 and Blum, 1997) [2] [3]. In addition, we also measured the porosities and determined pore size distributions by mercury intrusion poro-simetry (American Society for Testing and Materials, 1999) [4].
2. Rock Samples and Test Methods
2.1. Samples
As test materials for the planned experiments of different methods, eight types of rock samples which cover a very wide porosity range were collected. The rock types of the samples are middle-grained Belfast gabbro (Symbol used in this study: BG) retrieved from South Africa, fine-grained Aji Granite (AG) from Kagawa Pref., Japan, an yellow sandstone (AAS) from Australia, Rajasthan sandstone (RS) from India, Shirahama sandstone (SS) from Wakayama Pref., Japan, Berea sandstone (BS) from Ohio State, USA, Tage welded tuff (TWT) from Tochigi Pref., Japan and Nankai mudstone (NM) from an off shore ocean drilling site in southwest Japan.
The Nankai mudstone was obtained by a scientific deep ocean drilling project from a depth of 476 meters be-low sea floor with about 3800 m water depth at IODP (Integrated Ocean Drilling Program) drilling site C0006F in west Pacific Ocean (Expedition 314 Scientists, 2009) [5]. The other rocks were taken from quarries on land. All of the rock samples are relative homogenous and fresh, e.g., not weathered and visual crack free. The rock types and number of specimens used for various experiments were shown in Table 1. Addition to the rock sam-ples, we also prepared five metal specimens (two aluminum, two brass and one stainless specimens) for the vo-lume measurements because they do not have pore and are regularly shaped in a better quality than rock sam-ples.
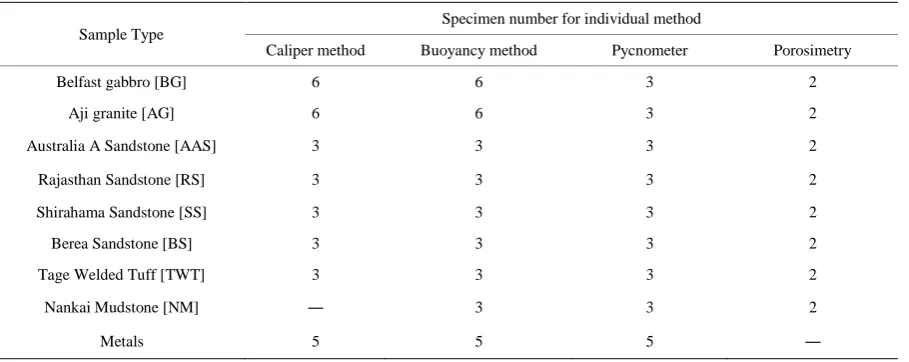
Table 1. Rock types and number of test specimens for the various experiments.
Sample Type Specimen number for individual method
Caliper method Buoyancy method Pycnometer Porosimetry
Belfast gabbro [BG] 6 6 3 2
Aji granite [AG] 6 6 3 2
Australia A Sandstone [AAS] 3 3 3 2
Rajasthan Sandstone [RS] 3 3 3 2
Shirahama Sandstone [SS] 3 3 3 2
Berea Sandstone [BS] 3 3 3 2
Tage Welded Tuff [TWT] 3 3 3 2
Nankai Mudstone [NM] ― 3 3 2
We prepared rock specimens for the measurements in a shape of regular cylinder for seven rock types except the NM. Sizes of all the cylinder specimens are of the same diameter (approximately 25 mm), but of different length of 20 - 35 mm dependent on the original rock sample size. Because the dimension of NM drilling core sample was not enough for recoring to make up the 25 mm-diameter cylindrical specimens, we used irregular specimens for NM.
2.2. Measurement Methods and Procedures
For determining bulk density of rock samples, the simplest method is to measure their volume and mass (or weight) as showed in Equation (1);
ρ =B M V/ B (1)
where ρB is bulk density (g/cm3), M is mass (g), and VB is the bulk volume including both solid’s and pore’s vo-lume (cm3). If mass M was measured using dry rock specimen, ρB is the bulk dry density. On the other hand, bulk wet density is determined by the mass of the rock specimen at water saturated state. In this study, we deal with the bulk dry density. Porosity (n in %) is defined as the ratio of accumulated (total) pore volume (VP in cm3) included in a rock specimen to the bulk volume VB of the specimen as follow:
100 P/ B
n= ×V V (2)
Based on these equations, it is clear that the measurements of bulk volume and pore volume control mea-surement accuracy of density and porosity of rock specimens rather than mass (or weight) meamea-surements which can be performed by an electrical balance relatively easily and accurately. Therefore, to examine results of vo-lume measurements by different methods is the key issue.
For bulk volume measurements, three methods i.e. caliper (Franclin, 1979; resolution of the caliper used: 0.05 mm) [2], buoyancy based on Archimedes’ principle (Franclin, 1979; US620H and SMK-102 of Shimadzu Cor-poration, Japan) [2], and helium-displacement Penta-Pycnometer which is according to Boyle’s Law (Blum, 1997; Pentapycnometer of Quantachrome Corporation, USA) [3], were employed in this study.
First, the rock specimens were soaked in a vacuumed desiccator for about three days for water saturation. Then, their bulk volumes were independently measured by the three methods; and their weights at wet state by an electrical balance with 0.001 g resolution. After these measurements, the specimens were dried in an oven at 110˚C for more than 24 hours. After cooling the specimens to the room temperature in a dried desiccator, their dry weights were measured by the same electrical balance and dry volumes (volumes of solid portion only) were determined by pycnometer. We use the following equation to determine pore volume VP (cm3):
(
)
/P wet dry water
V = M −M ρ (3)
where Mwet (g) is the mass of the specimen at water saturated state, Mdry (g) is the mass at dry state and ρwater (g/cm3) is the water density at the room temperature.
Here, we use the same rock specimens for the different measurement methods, and believe it is important for such experimental comparison studies of different measurement methods. After the measurements of caliper, buoyancy and pycnometer methods; the specimens used were finally resized (cut) to fit sample holder of the mercury intrusion porosimetry apparatus (Mercury Porosimeter Auto Pore IV 9500 of Micromeritics, USA). Then, the pore volumes and pore size distributions in dry specimens were determined by the porosimetry me-thod (American Society for Testing and Materials, 1999) [4].
3. Measurement Results and Discussions
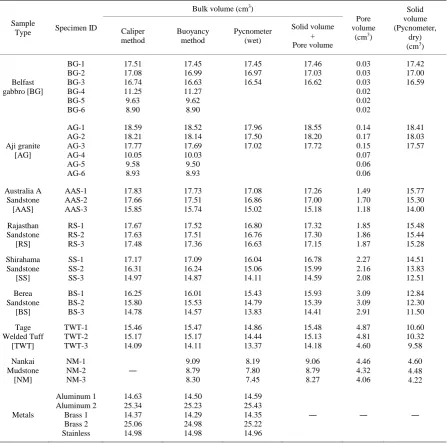
3.1. Bulk Volume Measured by Different Methods
Table 2. A comparison of bulk volumes measured by different methods.
Solid volume + Pore volume
Belfast
Aji granite [AG]
Australia A Sandstone Welded Tuff
[TWT]
Aluminum 1 Aluminum 2 Brass 1
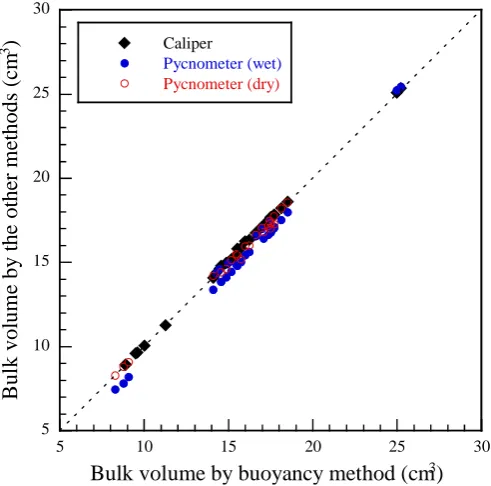
Figure 1 is cross plots of the bulk volumes measured by buoyancy and the other methods, showing that the bulk volume values located in the vicinity of 1:1 line approximately. In detail, the values by pycnometer at wet state (blue circles) look like to be slightly smaller than the buoyancy method.
To make a quantitative comparison among the bulk volumes obtained by different methods, we defined a pa-rameter “error” E (%) as follow:
(
)
100 B B B / B B
E= × V −V − V − (4)
where VB: the bulk volume obtained by individual method; VB-B: the bulk volume by the buoyancy method. This parameter in percentage more clearly shows how much different between the individual and buoyancy mea-surements (Figure 2).
5 10 15 20 25 30
5 10 15 20 25 30
Caliper Pycnometer (wet) Pycnometer (dry)
B
ul
k vol
um
e by
t
he
ot
he
r m
et
hods
(
cm
3
)
Bulk volume by buoyancy method (cm
3)
Figure 1. A comparison between bulk volumes measured by buoy-
ancy and the other methods.
-15 -10 -5 0 5
Caliper Pycnometer (wet)
Pycnometer (dry)
(V
B
-V
B-B
)/
V
B-B
, %
Sample type
BG AG AAS RS SS BS TWT NM Metal
Figure 2. A quantitative comparison among the bulk volumes
ob-tained by different methods.
caliper methods. The wet one, however, had approximately 5% errors for six rocks except BG and NM. From this result, it can be considered that the pycnometer measurement using the dry specimen seems to be better than using the wet one. In addition, a trend showing the error level of the wet pycnometer data increases with the wa-ter content should be noted.
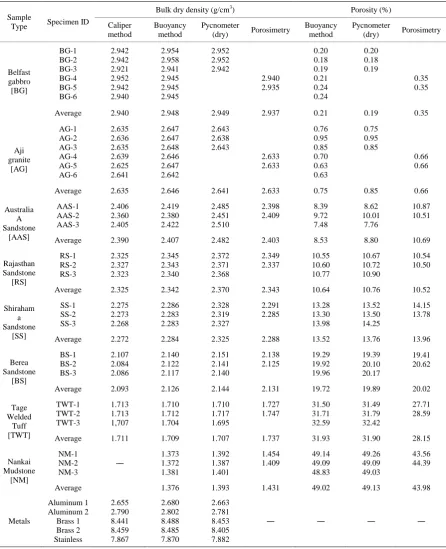
3.2. Bulk Density and Porosity Measured by Different Methods
Table 3. A comparison of bulk dry densities and porosities measured by various techniques.
(dry) Porosimetry
Buoyancy method
Pycnometer
(dry) Porosimetry
Belfast
Aluminum 1 Aluminum 2 Brass 1
On the other hand, the reason for the smaller porosity result for NM might be that high pressure applied for mercury injection causes deformation of the soft rock specimen and decrease its pore volume. Figure 3 shows a very good general relationship between the bulk dry density and the porosity of the eight rocks, i.e. the bulk dry density increases with the porosity decrease.
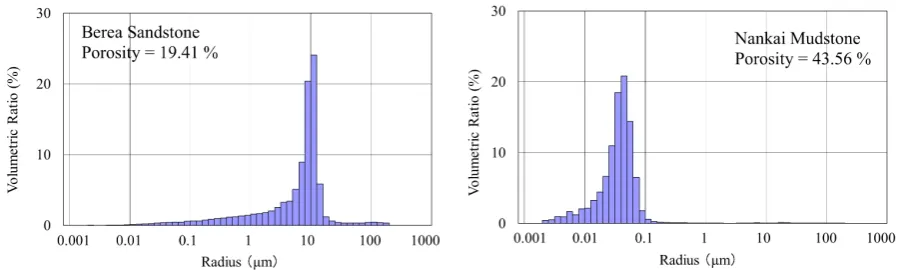
Although porosities obtained by the mercury porosimetry showed some uncertainty, it has a great advantage on measuring pore size distribution which could not be obtained by the other porosity measurement methods employed in this study (Lin et al., 2011) [6]. For example, the peak of pore size distribution of BS is around 10 μm being more than 100 times of that of NM although the porosity (43.56%) of NM is much larger than that (19.41%) of BS (Figure 4).
4. Summary
Several different measurement techniques of bulk density and porosity of rocks are available and being applied in the geo-science and geo-engineering fields. To ensure the data quality and to make its quality assessment, we carried out an experimental comparison study in which different measurement techniques (caliper, buoyancy, helium-displacement pycnometer and mercury intrusion porosimetry) were employed for the same rock speci-mens. We collected eight types of rock samples including a gabbro, a granite, four sandstones, a welded tuff and a mudstone as test materials. The porosities of the eight rocks covered a very wide range from 0.3% to 50% ap-proximately. Therefore, it can be said that the collected rock samples are proper for such comparison study of different measurement techniques. As a result, the techniques using caliper, buoyancy and pycnometer yielded the almost same bulk dry density and porosity results. In detail, the helium-displacement pycnometer measurement
0 10 20 30 40 50
1.0 1.5 2.0 2.5 3.0
P
or
os
it
y
, %
Bulk density (dry), g/cm
3 NMTWT
AAS RS SS
BS
BG AG
Figure 3. Relationship between porosity and bulk dry density
meas-ured by buoyancy method.
using the dry specimens seems to be better than using the wet ones. However, the porosimetry underestimated porosity values in the case of very high-porosity rock (i.e. soft rock) probably due to the specimen deformation under intrusion pressure; and showed some errors for the very low-porosity rock samples probably due to insuf-ficient accuracy of mercury intrusion volume measurement. Ability to determine pore size distribution is an im-portant advantage of the porosimetry method.
Acknowledgements
The Nankai Mudstone core samples were provided by the Integrated Ocean Drilling Program (IODP). Part of these works were supported by Grants-in-Aid for Scientific Research 25287134 (JSPS), Japan.
References
[1] Schön, J.H. (1998) Ch. 2, Pore Space Properties: Porosity, Specific Internal Surface, and Permeability, 2nd Edition. Handbook of Geophysical Exploration, Seismic Exploration, Vol. 18, Pergamon, Netherlands, 23-58.
[2] Franklin, J.A. (1979) Suggest Methods for Determining Water Content, Porosity, Density, Absorption and Related Properties and Swelling and Slake-Durability Index Properties. International Journal of Rock Mechanics and Mining
Science & Geomechanics Abstracts, 16, 141-156.
[3] Blum, P. (1997) Ch. 2, Moisture and Density (by Mass and Volume), in Physical Properties Handbook: A Guide to the Shipboard Measurement of Physical Properties of Deep-Sea Cores. ODP Technical Notes, 26, 2-1-2-15.
[4] American Society for Testing and Materials (1999) Standard Test Method for Determination of Pore Volume and Pore Volume Distribution of Soil and Rock by Mercury Intrusion Porosimetry, Designation D 4404-84 (Reapproved 1992).
Annual Book of ASTM Standards, 04.08, 588-592.
[5] Expedition 314 Scientists (2009) Expedition 314 Site C0006. In: Kinoshita, M., Tobin, H., Ashi, J., Kimura, G., Lal-lemant, S., Screaton, E.J., Curewitz, D., Masago, H., Moe, K.T., and the Expedition 314/315/316 Scientists, Proc.
IODP, 314/315/316, Integrated Ocean Drilling Program Management International, Inc., Washington DC.
[6] Lin, W., Tadai, O., Hirose, T., Tanikawa, W., Takahashi, M., Mukoyoshi, H. and Kinoshita, M. (2011) Thermal Con-ductivities under High Pressure in Core Samples from IODP NanTroSEIZE Drilling Site C0001. Geochemistry,