COUPLING REGULAR TESSELLATION WITH RJMCMC ALGORITHM TO SEGMENT
SAR IMAGE WITH UNKNOWN NUMBER OF CLASSES
Y. Wang, Y. Li*, Q. H. Zhao
Institute for Remote Sensing Science and Application, School of Geomatics, Liaoning Technical University, Fuxin, Liaoning 123000, China – (wangyu, liyu, zhaoquanhua)@lntu.edu.cn
Commission VII, WG VII /4
KEY WORDS: SAR Image Segmentation, Segmentation with Unknown Number of Classes, Regular Tessellation, RJMCMC Algorithm
ABSTRACT:
This paper presents a Synthetic Aperture Radar (SAR) image segmentation approach with unknown number of classes, which is based on regular tessellation and Reversible Jump Markov Chain Monte Carlo (RJMCMC`) algorithm. First of all, an image domain is portioned into a set of blocks by regular tessellation. The image is modeled on the assumption that intensities of its pixels in each homogeneous region satisfy an identical and independent Gamma distribution. By Bayesian paradigm, the posterior distribution is obtained to build the region-based image segmentation model. Then, a RJMCMC algorithm is designed to simulate from the segmentation model to determine the number of homogeneous regions and segment the image. In order to further improve the segmentation accuracy, a refined operation is performed. To illustrate the feasibility and effectiveness of the proposed approach, two real SAR image is tested.
1. INTRODUCTION
Image segmentation is a hot topic in Synthetic Aperture Radar (SAR) image processing and involves two tasks: determining the number of homogeneous regions and segmenting them. By far, there are numerous algorithms for SAR image segmentation (Alkasassbeh et al., 2012; Ayed et al., 2005; Cao et al., 2005; Li et al., 2010; Schmitt et al., 2014; Xu et al., 2011; Xue et al., 2010). The statistics- and region-based approaches has been proved that they are much most effective for SAR image segmentation. To this end, geometry tessellation based segmentation approaches have been proposed, in which image domain is partitioned into a set of sub-regions and image model is built based on it. The commonly used geometric tessellations include regular tessellation (Askari et al., 2013), Voronoi tessellation (Lucarini, 2009; Zhao et al., 2013), Poisson tessellation (Schneider, 2009; Schneider, 2010), and so on. Li et al. (2010) proposed a region-based approach for SAR image segmentation based on Voronoi tessellation, Bayesian inference and Reversible Jump Markov Chain Monte Carlo (RJMCMC) algorithm. The proposed approach can segment SAR image well, but the number of homogeneous region need to be indicated by users. In order to automatically determine the number of homogeneous regions, Askari et al. (2013) presented an approach to SAR image segmentation. The approach is based on regular tessellation, Bayesian inference, a maximum likelihood Gamma distribution parameter estimator and RJMCMC algorithm. As the move types are designed unreasonably, the proposed approach can automatically determine the number of homogeneous regions, the segmentation accuracy is low and the proposed algorithm is time-consuming.
The proposed approach couples regular tessellation with RJMCMC algorithm to automatically determine the number of homogeneous regions and segment the image. In the RJMCMC algorithm, five move types are designed, involving splitting or merging real classes, sampling parameter vector, sampling label field, birth or death of an empty class and splitting or merging
blocks. These moves overcome the instability problem of segmentation optimization.
This paper is organized as follows. In Section 2 we present the proposed algorithm. We then in Section 3 detail and discuss the results of real SAR images. Finally, Section 4 contains conclusions and perspectives for further research.
2. DESCRIPTION OF THE PROPOSED ALGORITHM 2.1 Image segmentation model
A SAR image, represented by a vector Y of pixel intensities, is defined on the image domain D, that is, Y = {Yd, dD}, where
dDis a pixel location on D, Yd is a random variable defined on d.
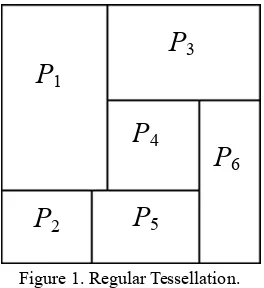
In this paper, the image domain D is partitioned into a set of blocks D = {Pi, i = 1, …, m} by regular tessellation, where m is the unknown number of blocks and possess a prior distribution with the probability density function (pdf) p(m), the number of pixels in ith block Pi is the multiple of 4 and the minimum block is 22. Figure 1 shows an example which D is partitioned into 6 rectangles by regular tessellation, that is, D = {Pi, i =1, …, 6}.
A random label field Z = {Zi, i = 1, …, m},which is formed with the set of labels for all blocks, where each random variable
P
1P
2P
3P
4P
5P
6Zi is associated with the block Pi and takes its value in {1, …,
k}, where k is unknown and has a prior distribution p(k). A realization of Z corresponds to a segmentation of the image. The improved stationary Potts model (Besag, 1986) is used to define the label field, which models the correlation of labels among blocks. In a given block Pi, NPi ={ Pi, Pi Pi}denotes the block set of sites neighbouring block Pi, i, i {1, …, m} and i i, Pi Piare neighbours if and only if they have a mutual boundary. The conditional pdf of Zi given Zi, PiNPi, can be expressed as
control the neighbourhood dependences between a pair of neighbour blocks (Dryden et al., 2003). On the assumption that pdfs for Zi, i = 1, …, m, are conditionally independent, then theIt can be seen that the segmentation of Y can be fully described by the label field Z.
For the ith block Pj, the pixels intensities Yi = {Yd, d Pi} are modelled by a identical and independent Gamma distribution conditional on its label Zi = s, the joint pdf of Yi becomes satisfies identical and independent Gaussian distributions with mean () and standard deviations () (Yang et al., 2006). Accordingly, the pdf of can be expressed as
when each block has a different class). Its prior distribution as follows Poisson distribution with mean m (truncated with minimum m= k, and the maximum mmax = d if each block exactly has one pixel). Its prior distribution satisfies (Green, 1995),
)
2.2 Simulation
Segmentation is performed according to RJMCMC to simulate the posterior distribution defined in Eq. (8). Let = (Z,, k, m). accepting the candidate * can be computed as (Green, 1995)
(1) Splitting or merging real classes
In the proposed algorithm, the real class represents that at least one block is labeled the class and its number is kr. For splitting move, a set of blocks with a same class label randomly chosen in the current state k are split to two sub-sets with different move can be written as
r
A merging is designed in tandem with a splitting so that they form a reversible pair (Green, 1995). So the acceptance probability of the merge move can be generalized as
r
r s
m (Λ,Λ*)min1, 1/R
(12)(2) Sampling parameter vector
The parameter vector for Gamma distribution is updated by sequentially updating the elements of s for each label s {1, …, k }. First of all, we need judge whether s is an empty. If
s is a real class, the acceptance probability can be expressed as
(3) Sampling label field
For a block Pi, a new real label s* israndomly chosen from the set of current real classes and s* ≠ s (Zi = s). The acceptance probability can be written as
l (4) Birth or death of an empty classIn the proposed algorithm, the empty class means that no block is associated with the class and its number is denoted as ke. Given the current number of classes k, Let = (Z,, k, m), bk or dk+1 is the probabilities of proposing a birth or death operation. For a birth move, first of all, a new empty class k +1 is proposed, then a new set k+1*= (k+1*, k+1*), samplied from the prior distribution by identically and independently. So *= (Z*,*, k+1, m), where * = {s, s = 1, …, k, k +1}. The acceptance probability of a birth can be expressed as
e
A death is designed in tandem with a birth (Green, 1995), so the acceptance probability can be written as
e
e b
d (Λ,Λ*)min 1,1 /R
(19)(5) Splitting or merging blocks
A move of splitting a block involves splitting a block to two blocks with different class labels. The operation includes: (i) Randomly choosing Pi in the current partition of image domain D = {P1, …, Pi, …, Pm}, and its corresponding label Zi = s; (ii) block’s row number is 6 and the column number is 10, they are
both the multiple of 2, so there are 6 (= (6+10)/2-2) splitting types in the selected Pi, the numbers of splitting types are labeled as 1, …., 6, respectively; (iii) One splitting is randomly chosen and splits Pi into Pi* and Pm+1*, and their corresponding
labels are re-allocated s and s*, s s*, respectively. The new partition of image domain becomes D*= { P1, …, P
i*, …, Pm,
Pm+1*}, the acceptance probability of the splitting move can be expressed as,
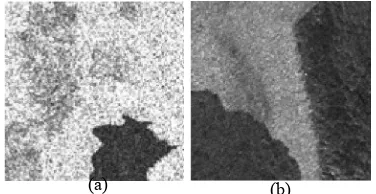
3. EXPERIMENTAL RESULTS AND DISCUSSION The proposed approach is tested on real SAR images with sizes of 128128 as given in Figure 3, where Figure 3a presents a RADARSAT-I image with VV polarization and spatial resolution of 25m, and Figure 3b shows a RADARSAT-II standard mode image with HV polarization and spatial resolution of 25m. Visually, both of them include three homogeneous regions.
Experiment results demonstrate that (1) kr [2, kmax] before a jumping period and after that kr attains to its stable value. In the experiments, kmax =7. As is shown in Figure 4a and b, the iterations are 20 and 16, respectively; (2) during the jumping period, there is no class remaining unchanged with consecutively 10 iterations. Consequently, if kr is unchanged with 30 times continuously in iteration, it is assumed that be the number of the real class. As is shown in Figure 4, their real classes are equal to 3.
Figure 3. Real SAR images: (a) coastal image, and (b) estuary image.
(a) (b)
(a) (b)
Figure 4. Changes of kr for real SAR image: (a) coastal image, and (b) estuary image.
After kr is determined, only move (2)-(4) are preformed. Figure 5 shows the real SAR image segmentation results. Figure 5a1 and b1 present the regular tessellation of coarse segmentation, and Figure 5a2-b2 shows the corresponding coarse segmentation. From Figure 5a1-b1 and a2-b2, it can be found that the accuracy of region segmentation is very high, but the boundary segmentation accuracy is poorer than it. In order to improve the accuracy of image boundary segmentation, a refined operation is performed. First of all, extracting the outlines of segmentation results and buffer zones with two pixels in width are generated centered on them. Then the pixels in the buffer zones are reclassified by the criterion defined in Eq. (1), new boundaries of homogeneous regions are tracked. Figure 5a3 and b3 show the refined segmentation result, respectively. From Figure 4 and 5, it is easy to find that the proposed approach can not only determine the number of classes but also segment the image precisely.
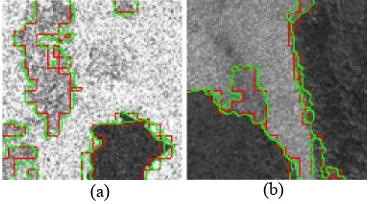
In order to qualitatively evaluate the proposed algorithm, the outlines of segmentation results (red) and refined outlines (green) are overlaid on the original image (see Figure 3) shown in Figure 6. Visually, the extracted outlines of segmentation results poorly match the real outlines, but the refined outlines match better.
In order to asses the segmented results shown in Figure 5a3-b3 quantitatively, some common measures, including Producer’s accuracy, User’s accuracy, Overall accuracy and Kappa coefficient, are computer based on the simulated real SAR images in Figure 7. Table 1 lists them. As is shown in Table 1, it can be seen that only three accuracies are below 90%. In addition, the kappa coefficients are up to 0.915. It can be illustrate that the proposed approach is feasible and effective.
Image a3 b3
C1 95.1 97.4
C2 98.5 99.6
Producer’s accuracy (%)
C3 88.6 82.7
C1 97.7 97.4
C2 95.8 98.2
User’s accuracy (%)
C3 94.3 89.1
Overall accuracy (%) 95.7 97.1
Kappa coefficient 0.915 0.949
Table 1. Quantitative evaluation 4. CONCLUSION
This paper presents a SAR image segmentation approach combined regular tessellation and RJMCMC algorithm, which can not only automatically determine the number of homogeneous regions but also segment them well.
The proposed approach is a region-based segmnatation method by using regular tessellation technique. To improve the segmentation accuracy, regular tessellation is used to partition the image domain into a set of blocks, and the statistics- and region-based model are built. The partitioned blocks can quickly simulate the homogenous regions, but the boundaries of homogenous regions can not match the real outlines well. To improve the accuracy of boundary segmentation, a refined operation is designed. The results obtained from both two real SAR images show that the proposed algorithm works well and efficient. In the future work, other tessellation methods (Voronoi tessellation, Poisson tessellation and so on) can be chosen to partition image domain.
ACKNOWLEDGMENTS
This work was supported by Center for Earth Observation and Digital Earth (No.2012LDE013) and National Natural Science Foundation of China (No. 41271435; No. 41301479).
REFERENCES
Alkasassbeh, M., Braik, M., Ayyash, H. A., 2012. Detection of oil spills in SAR images using threshold segmentation algorithms. International Journal of Computer Applications, 57(7), pp. 10–15.
Askari, G., Xu, A. G., Li, Y., Alavipanah, S. K., 2013. Automatic determination of number of homogenous regions in SAR images utilizing splitting and merging based on a Reversible Jump MCMC algorithm. Journal of the Indian Society of Remote Sensing, 41(3), pp. 509–521.
Ayed, I. B., Mitiche, A., Belhadj, Z., 2005. Multiregion level-set partitioning of synthetic aperture radar images. IEEE
(a) (b)
Figure 6. Visual evaluation: (a)-(c) overlaying the coarse and refined outlines on the original images.
(a1) (a2) (a3)
Figure 5. Segmentation results: (a1)-(b1) regular tessellation of segmentation, (a2)-(b2) segmentation results, and (a3)-(b3) refined segmentation.
(b1) (b2) (b3)
(a) (b)
Figure 7. Templates of real SAR images: (a) coastal image, and (b) estuary image.
I
II III II
Transactions on Pattern Analysis and Machine Intelligence, 27(5), pp. 793–800.
Besag, J., 1986. On the statistical analysis of dirty pictures. Journal of the Royal Statistical Society. Series B (Methodolological) 48(3), pp. 259–302.
Cao, Y.F., Sun, H., Xu, X., 2005. An unsupervised segmentation method based on MPM for SAR images. IEEE Geoscience and Remote Sensing Letters, (1), pp. 55–58.
Dryden, I. L., Scarr, M. R., Taylor, C. C., 2003. Bayesian texture segmentation of weed and crop images using Reversible Jump Markov Chain Monte Carlo methods. Journal of the Royal Statistical Society. Series C, pp. 52(1), 31–50.
Green, P. J., 1995. Reversible Jump Markov Chain Monte Carlo computation and Bayesian model determination. Biometrika, 82(4), pp. 711–732.
Li, Y., Li, J., Chapman, M. A., 2010. Segmentation of SAR intensity imagery with a Voronoi tessellation, Bayesian inference, and Reversible Jump MCMC algorithm. IEEE
Transactions on Geoscience and Remote Sensing, 48(4), pp. 1872–1881.
Lucarini, V., 2009. Symmetry-break in Voronoi tessellations.
Symmetry, 1(1), pp. 21–54.
Ma, M., Liang, J. H., Guo, M., Fan, Y., Yin, Y. L., 2011. SAR image segmentation based on artificial bee colony algorithm.
Applied Soft Computing, 11(8), pp. 5205–5214.
Schmitt, A., Wessel, B. Roth, A., 2014. An innovative curvelet-only-based approach for automated change detection in multi-temporal SAR imagery. Remote Sensing, 6(3), pp. 2435–2462.
Schneider, R., 2009. Weighted faces of Poisson hyperplane tessellations. Advances in Applied Probability 41(3), pp. 682–694.
Xu, H., Wang, W., Liu, X., 2011. A fast segmentation approach of SAR image by fusing optical image. In: Proc. 2011 IEEE International Geoscience and Remote Sensing Symposium
(IGARSS), Vancouver, BC, Canada, July, pp. 2665–2668. Xue, X., Wang, X., Xiang, F., Wang, H., 2010. A new method of SAR image segmentation based on the gray level co-occurrence matrix and fuzzy neural network. In: Proc. 2010 6th International Conference on Wireless Communications Networking and Mobile Computing (WiCOM), Chengdu, China, September, pp. 1–4.