Detection and Modeling of Temperature Inversion in the Atmosphere Using MODIS Images
(Case Study: Kermanshah)
H. Kachar a*, M. R. Mobasheri a, A. A. Abkara, M. RahimZadegana
aK.N. Toosi university of Technology, Faculty of Geodesy and Geomatics Eng, Mirdamad Cross, Tehran, Iran - (hamedkachar,
maj_r2002 )@yahoo.com , (mobasheri , abkar)@kntu.ac.ir
KEY WORDS: Temperature Inversion, Radiosonde, MODIS, Brightness Temperature
ABSTRACT:
Increase of temperature with height in the troposphere is called temperature inversion. Parameters such as strength and depth are characteristics of temperature inversion. Inversion strength is defined as the temperature difference between the surface and the top of the inversion and the depth of inversion is defined as the height of the inversion from the surface. The common approach in determination of these parameters is the use of Radiosonde where these measurements are too sparse. The main objective of this study is detection and modeling the temperature inversion using MODIS thermal infrared data. There are more than 180 days per year in which the temperature inversion conditions are present in Kermanshah city. Kermanshah weather station was selected as the study area. 90 inversion days was selected from 2007 to 2008 where the sky was clear and the Radiosonde data were available. Brightness temperature for all thermal infrared bands of MODIS was calculated for these days. Brightness temperature difference between any of the thermal infrared bands of MODIS and band 31 was found to be sensitive to strength and depth of temperature inversion. Then correlation coefficients between these pairs and the inversion depth and strength both calculated from Radiosonde were evaluated. The results showed poor linear correlation.This was found to be due to the change of the atmospheric water vapor content and the relatively weak temperature inversion strength and depth occurring in Kermanshah. The polynomial mathematical models and Artificial intelligence algorithms were deployed for detection and modeling the temperature inversion. A model with the lowest terms and highest possible accuracy was obtained. The Model was tested using 20 independent test data. Results indicate that the inversion strength can be estimated with RMSE of 0.84o C and R2 of 0.90. Also inversion depth can be estimated with RMSE of 54.56 m and R2 of 0.86.
* Corresponding author
1. INTRODUCTION
Increase of temperature with height in the troposphere is called temperature inversion (Kahl et al., 1992). Parameters such as strength and depth are characteristics of temperature inversion. Inversion strength is defined as the temperature difference between the surface and the top of the inversion and the depth of inversion is defined as the height of the inversion from the surface (Liu and Key, 2003). The common approach in determination of these parameters is field measurements by Radiosonde (Hudson and Brandt, 2005). On the other hand the Radiosonde data are too sparse, so using satellite images is essential for modeling the temperature inversion. The main objective of this study is detection and modeling the temperature inversion using MODIS thermal infrared data.
2. BACKGROUND OF RESEARCH
In this part of the study a brief review of past studies and searches on temperature inversion in Iran and other countries is given. Kahl (1990), examined the climatological characteristics of low-level tropospheric temperature inversions based on radiosonde data from two coastal weather stations. Bradley et al. (1992), examined the annual cycle of surface-based inversions at nine Arctic weather stations based on radiosonde
data. Bradley et al. (1993) and Walden et al. (1996) analyzed the systematic change in midwinter surface-based inversion depth over the past few decades based on the radiosonde data from several weather stations in the Arctic.
In Iran, Pourahmad (1998), investigated the effect of climatic factors such as wind, rain, fog and temperature inversionon air pollution in Tehran. The result indicates that the number of temperature inversions occurred near the ground level between 1967 and 1971 has been minimum 211 days and maximum 271 days. In winter the frequency of near the ground temperature inversion phenomenon is significant, because apart from snowy and rainy days which are less frequent the rest of the days the weather is clear with no clouds. In summers the frequency of near the ground temperature inversion phenomenon increases to its maximum level, because at nights the weather is clear with no clouds and as the day comes due to rapid warming of the earth, temperature inversion is canceled and the air pollution is reduced. In spring and autumn the number of temperature inversion occurrences is relatively fewer in terms of instability. Karimi and Derakhshan (2005), investigated the temperature inversion phenomenon in Isfahan in the years 1991-1993. They have concluded that temperature inversion has occurred in all seasons during the study period and almost 80 percent of the days of the year inversion phenomenon was present, however The International Archives of the Photogrammetry, Remote Sensing and Spatial Information Sciences, Volume XL-1/W5, 2015
the inversion layer altitude varied in different seasons. Hedayat
and Lashkari (2006), analyzed the synoptic patterns of Tehran’s
temperature inversions and discovered that four synoptic patterns can cause severe temperature inversion in Tehran. Jahanbakhsh and Roshani (2013), used radiosonde information and investigated the inversion phenomenon in Tabriz in scales of daily, monthly and seasonal, during the years of 2004- 2008. The result of their study indicates that the average number of days with temperature inversion phenomenon occurrence in Tabriz is 191 days, 87 percent of which is related to radiation temperature inversion and the other 13 percent is related to subsidence temperature inversion.
To summarize according to the most of local and international sources, research in the field of temperature inversion has been based on data extracted from radiosonde information and weather stations and researchers used this data to investigate the ways that temperature inversion phenomenon’s intensity, frequency and continuity effects and is affected by air pollution. Therefore, in this section a brief history of acquiring atmospheric profiles, mainly temperature, using satellite observations is given. Extraction of atmospheric profiles from thermal infrared radiation flux density was introduced for the first time by King (1956). His study explained the method of extracting temperature profiles from satellite measurements of radiation flux density scans. Kaplan (1959), further developed the concept of temperature profiling,by proving that the vertical resolution of the temperature field can be extracted from the spectral distribution of thermal radiation. He concluded that by proper selection of a series of profiling spectral channels at different wavelengths, the observed radiations can be used to create a proper interpretation of the vertical temperature distribution in the atmosphere. Rahimzadegan and Mobasheri (2010) presented a model to improve the accuracy of the thermal profile extracted from MODIS for non-inversion days.
Liu and Key (2003), developed an empirical algorithm to detect and estimate the characteristics of clear sky, low-level temperature inversions using data from the Moderate Resolution Imaging Spectroradiometer (MODIS) on the Terra and Aquasatellites.
Several algorithms have been proposed in order to extract temperature and humidity profiles from satellite measurements such as MODIS images. These methods usually use previously established or modeled statistical relationships between measured radiations and their corresponding atmospheric profiles (Seeman et al., 2003). according to (Seeman et al., 2006) In a sky devoid of clouds, radiation flux density at the top of the atmosphere at the frequency of fj is the sum of all the radiations coming from the surface of the earth and of all atmospheric participant layers. For example,the following equation applies for all atmospheric temperature profiles and it also explains the other profiles as well:
L(fj) =
N
i 1
p[fj , T(pi)]w(fj , pi) (1)
j = 1,2,…,M
where w(fj , pi) is a weighting function to calculate the participation of each layer, p[fj , T(pi)] is the Planck flux density in the frequency of fj and temperature of T in the pressure layer of Pi. Pressure and altitude are assumed to be completely interdependent.
The weighting function is shown by the equation (2) (Seeman et al., 2006).
w(fj , pi) =
(fj , pi)
(fj , 0
pi) (2)in Equation (2), the weighting function w(fj , pi) combines, emissivity effect
transparency
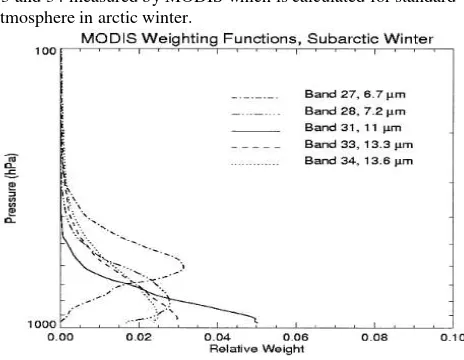
of the top of the atmosphere to the level of i in the band j.Figure 1, shows the weighting function for the bands 27, 28, 31, 33 and 34 measured by MODIS which is calculated for standard atmosphere in arctic winter.
Figure 1. Weighting functions for the MODIS bands at 6.7, 7.2, 11, 13.3, and 13.6 mm using subarctic winter standard
atmosphere profile (Liu and Key, 2003)
Figure 1, gives therelative weighting functions for MODIS channels 27(6.7 µm), 28 (7.2 µm), 31 (11 µm), 33 (13.3 µm), and34 (13.6 µm), calculated for the subarctic winter standardatmosphere. Channels 27 and 28 are water vaporchannels, 31 is a window channel, and 33 and 34 arecarbon dioxide channels. The peaks of the weighting functions for the 6.7-, 7.2-, 11-, 13.3-, and 13.6-µm channels are approximately 600 hPa, 800 hPa, the surface,950 hPa, and 900 hPa, respectively. Because the weighting functions are broad and represent an average radiance contribution from a layer, the measured brightness temperature is sensitive to a relatively thick layer.
As Figure 1 shows, the brightness temperature of the window channel at 11 µm, BT11, will be most sensitive to the temperature of the surface. The 7.2µm water vapor channel brightness temperature, BT7.2 , is most sensitive to temperatures near 800 hPa. The magnitude of the brightness temperature difference (BTD) between the 7.2- and 11µm channels, BT7.2 - BT11, will therefore be proportional to the strength of temperature difference between the 800-hPa layer and the surface, which is related to the inversion strength (Liu and Key, 2003).
the correlation coefficients between temperature inversion strength and BT6.7 - BT11, BT7.2 - BT11, BT13.3 - BT11, and BT13.6 - BT11 are 0.97, 0.98, 0.95, and 0.93, respectively and also, the correlation coefficients between temperature inversion depth and BT6.7 - BT11, BT7.2 -BT11, BT13.3 - BT11,and BT13.6 - BT11 are 0.89, 0.90, 0.88, and 0.87, respectively (Liu and Key, 2003). the relationship between strength and depth of temperature inversion and BT7.2 - BT11 is stronger and less variable. Therefore, BT7.2 - BT11 is used to retrieve the strength and depth of the temperature inversion (Liu and Key, 2003).
3. THEORY OF IMPLEMENTED METHOD
In this study only the temperature inversions occurred in the condition of clear sky are investigated. In this study the assumption is that the basis for temperature inversion occurrences in the ground level, therefore the base altitude is The International Archives of the Photogrammetry, Remote Sensing and Spatial Information Sciences, Volume XL-1/W5, 2015
the altitude of the weather station and the top the inversion is assumed to be the altitude of maximum temprature measured by radiosonde. If the maximum temperature is located inside an Isothermal layer, the top section of the isothermal layer is assumed as the top of the inversion. According to surveys and studies conducted on accessing the temperature inversion characteristics using MODIS satellite images, the study conducted in the Pole (Liu and Key, 2003) was considered as theoretical basis of this study. According to studies conducted in the Pole on accessing the temperature inversion characteristics using MODIS satellite images, the theoretical basis is the weighting function calculated for different bands of MODIS. The temperature weighting function represents the thermal sensitivity of different measurement bands of MODIS in different altitudes of atmosphere. Taking into consideration the fact that such temperature weighting function has not been
calculated for Kermanshah’s standard atmosphere and other
cities of Iran, in order to achieve a comprehensive and accurate study and the possibility of analyzing all possible scenarios, it seemed necessary to investigate all thermal infrared bands of MODIS in order to acquire the temperature inversion characteristics. The different stages of conducting this study are as follow:
- Collecting radiosonde data
- Collecting and implementing the products of MYD35 in order to test the cloud on image pixels
- Collecting the MODIS sensor satellite images related to temperature inversion days
- Planck equation was used to calculate the brightness temperature, in the condition of a clear sky and field of view of 5 Km * 5 Km
- Using the brightness temperatures participants from all layers of the Earth's surface and atmosphere using a combination of 16 MODIS infrared band
- Creating a database of temperature profiles and satellite images of MODIS sensor for the desired area using data of specific period of time
- Calculating the strength and depth of the temperature inversion using temperature profiles derived from radiosonde data
- Calculating the correlation coefficients between MODIS brightness temperature difference pairs and the observed temperature inversion strength and depth
- Identifying and modeling the characteristics of temperature inversion
- Analysis and evaluation of results
4. IMPLEMENTATION IN KERMANSHAH
Kermanshah with an area of about 8547 square kilometers is the ninth most populated city, and one of the metropolises, of Iran()with a temperate mountain climate. The weather station at Kermanshah, which has the longitude of 47˚9’, latitude of
34˚21’, and altitude of 1318 meters, has been selected as the
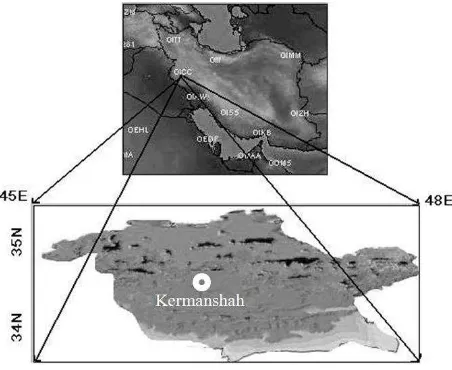
study region. The international station ID is OICC, and the station number is 40766. The reason for selecting this station is the abundance of information in its radiosonde data bank because of the fact that this station releases two weather balloons every day. Figure 2, shows the geographical position of the study region in relation to Kermanshah Province.
Figure 2. the geographical position of the study region in relation to Kermanshah Province
The days with atmospheric inversion were determined by collecting the radiosonde data at the Kermanshah weather station in the interval 2007-2008 and by using this data to plot temperature profiles of the troposphere. The temperature inversion phenomenon in Kermanshah is an everlasting, stable, and continuous phenomenon and includes almost all seasons and days of the year. In all, 90 days with temperature inversion under conditions of clear skies covering all the seasons of the year were extracted to make the necessary implementations using the radiosonde data and MODIS satellite images. The strength and depth of temperature inversion were calculated using the radiosondes data related to the days with temperature inversion and with clear skies. The difference between brightness temperature of each thermal band of the MODIS sensor and the brightness temperature of band 31, which is
sensitive to the temperature on the earth’s surface, was
calculated to study the correlation between temperature inversion characteristics and brightness temperature difference. It must be mentioned that the 20, 21, 22, 23, and 32 bands of the MODIS sensor, which behave similarly to band 31 and are
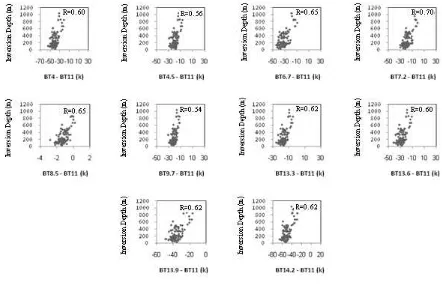
sensitive to the temperature on the earth’s surface, are not present in future analyses. Figures 3 and 4, based on the collected radiosonde data, indicate the relationship between the brightness temperature of band pairs and the strength and depth of temperature inversion, respectively.
Figure 3. Relationship between MODIS brightness temperature difference pairs and the observed temperature inversion strength
Figure 4. Relationship between MODIS brightness temperature difference pairs and the observed temperature inversion Depth The International Archives of the Photogrammetry, Remote Sensing and Spatial Information Sciences, Volume XL-1/W5, 2015
As can be seen in Figures 3 and 4, brightness temperature difference increases with increased strength and depth of temperature inversion. Figures 4 and 5 show that, for the study region (the Kermanshah weather station), correlation coefficients between brightness temperature difference of various band pairs and the strength and depth of temperature inversion are relatively weak compared to the Pole. Since the characteristics of temperature inversion for various regions are different because of different types of weather such as surface temperature, atmospheric water vapor, and surface pressure, therefore, the weighting functions and the relationships between inversion characteristics and BTD will also be different.
4.1 Recognition and Detection of Temperature Inversion
To estimate the strength and depth of inversion using brightness temperature of the infrared region under conditions of clear skies (no clouds in the air), we must first determine the presence or absence of temperature inversion by using MODIS satellite images. Since increases in the strength and depth of temperature inversion leads to increases in brightness temperature difference, the threshold level limit is considered for conditions without inversion. In the study for recognizing temperature inversion in Kermanshah, BT13.6 - BT11 was used as the test for inversion detection with the threshold limit of minus 30 degrees Kelvin. In recognizing temperature inversion in Kermanshah, if BT13.6 – BT11 is less than minus 30 degrees Kelvin, there will be no temperature inversion; otherwise, temperature inversion has happened on the related day. Unfortunately, investigations, and use of the mentioned threshold limit on the available data, indicate that about 10% of the non-inversion cases were recognized as inversion ones. 4.2 Retrieval of the Strength and Depth of Temperature Inversion by MODIS Satellite Images
Results of this research showed that modeling temperature inversion in an urban area like Kermanshah, where there are water vapor and various pollutions, does not follow a linear relationship. Therefore, considering the model used at the Pole, which is like a polynomial, use of general mathematical models such as polynomials for modeling temperature inversions is unavoidable.That is why the polynomial math model presented in equation (3) was used for modeling.
(3)
Among the difficulties of using the polynomial math model shown in equation (3) for modeling temperature inversion is the very large search space. In order to optimize the mathematical model, in the sense of selecting optimal terms in the polynomials and achieving the maximum possible accuracy in estimating characteristics of temperature inversion, and also because it was impossible to make a complete search to reach the most optimal model, we had to use artificial intelligence algorithms. It must be mentioned that optimal terms refers to the use of the minimum possible number of terms to achieve the best possible accuracy in extracting the strength and depth of temperature inversion from MODIS satellite images. Considering the large number of possible states and the complexity of this optimization problem, the genetic algorithm was used (Beasley et al., 1993). The process of implementing the genetic algorithm for optimizing equation (3) in order to achieve the depth and strength of temperature inversion is as follows. The information entering the genetic algorithm is of
two classes. The first class consists of input data and brightness temperature differences that are obtained from MYD02 images, which are in the form of various quintuplet combinations. The second class includes input data, and the depth and strength of temperature inversion extracted from radiosonde data for days with inversion. The mathematical model shown in equation (3) was codified to be presented to the genetic algorithm in binary form. Ninety days with inversion were divided into the three classes of radiosonde control points (RCP), genetic algorithm check points (GACP), and independent check points (ICP). The number of radiosonde control points, genetic algorithm control points, and independent check points are 40, 30, and 20, respectively. To evaluate the fitness of each solution (chromosome), the fitness function solves the presented polynomial represented by each chromosome using the forty radiosonde control points and, after finding the structure and the coefficients of the polynomial, estimates the RMSE for the 30 check points of the genetic algorithm, with lower produced RMSE the symbol of improved fitness of each solution. Use of the probabilistic tournament selection method for selecting parents and filling the mating pool, employment of the two-point crossover method, and applying the mutation technique on all the genes of the chromosome with the probability of 0.003, are some of the parameters and adjustments of the genetic algorithm. It must be mentioned that operational considerations, including use of unnormalized input data and inverse of a matrix using Gauss-Jordan elimination in the stage of estimating unknown parameters using the least squares method, have been used in implementing the genetic algorithm. Using the initial population of 1000 chromosomes and 500 generations, and setting the stopping condition that the algorithm stopped after 500 generations, the structure and the optimal terms of the model were extracted. Finally, fitting the mathematical model of the polynomials, and using the genetic algorithm to obtain the best model, statistical regression equations for quantification of the relationship between the strength and depth of temperature inversion and combinations of brightness temperature of various MODIS infrared bands were calculated as follows.
5. RESULTS
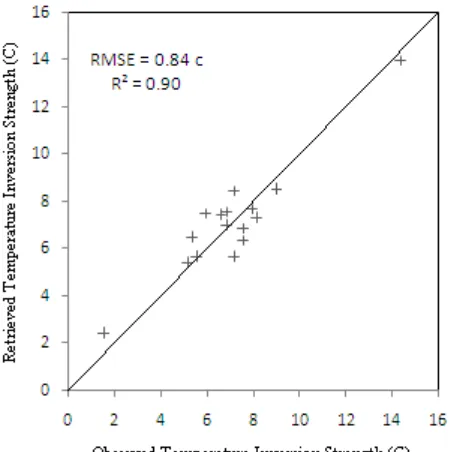
Using equations (4) and (5), the model of estimating the strength and depth of temperature inversion was applied on the 20 independent check points that were not involved in determining the structure and coefficients of the model. Results are presented in Figures 5 and 6.
Figure 5. Inversion strength from the MODIS regression retrievals compared to radiosonde observations
Figure 6. Inversion Depth from the MODIS regression retrievals compared to radiosonde observations
Figure 5, indicates that the strength of the temperature inversion can be detected with the RMSE of 0.84 degrees centigrade, and that the correlation coefficient between the observed and retrieved strengths of temperature inversion is 0.95. Moreover, as shown in Figure 6, the depth of temperature inversion can be
recognized with the RMSE of 54.56 meters, and the correlation coefficient between the observed and recovered depth of temperature inversion is 0.93.
6. CONCLUSIONS
This research studied detection and modeling the characteristics of temperature inversion using infrared data of the MODIS sensor. This method includes modeling the relationship between the strength and depth of temperature inversion and brightness temperature difference resulting from various band pairs of the MODIS sensor. The collected data, and investigations that were carried out, showed there was a relatively weak relationship between the characteristics of inversion and brightness temperature difference. Since modeling temperature inversion does not follow a linear relation, polynomial math models were used for modeling characteristics of temperature inversion. Considering the very large search space for obtaining a model with the least possible number of terms and the maximum accuracy, and because of the impossibility of carrying out a thorough search, use of an intelligent search algorithm such as the genetic algorithm seemed unavoidable. Modeling of the characteristics of temperature inversion was carried out with considerable accuracy by fitting the polynomial math model to paired brightness temperature differences obtained from satellite images and the strength and depth of temperature inversion resulting from radiosonde data, and through employing the genetic algorithm to obtain the most optimal model. Results of evaluating the modeling carried out at the weather station in Kermanshah were estimation of the strength of temperature inversion with the RMSE of 0.84 degrees centigrade and R2 of 0.90, and estimation of the depth of temperature inversion with the RMSE of 54.56 meters and R2 of 0.86. However, the strength of temperature inversion at the Pole was estimated with the RMSE of 1.9 degrees centigrade and R2 of 0.97, and the depth of temperature inversion with the RMSE of 136 meters and R2 of 0.82.
7. SUGGESTIONS
Considering the initial assumption in the study carried out at the Pole, and in our research, that the base height of temperature inversion is the same as the altitude of the weather station, the altitudes of weather stations are regarded as an effective parameter in modeling temperature inversions. Studying weather stations with different altitudes in urban regions, we can determine the effects of the base height in increasing or decreasing model accuracy in order to estimate the depth and strength of temperature inversion.
REFERENCES
Beasley, D., Bull, D.R., Martin, R.R., 1993, An overview of genetic algorithms: part1, fundamentals, Univ, Computing 15 (2), 58-69.
Beasley, D., Bull, D.R., Martin, R.R., 1993, An overview of genetic algorithms: part2, Research Topics, Univ, Computing 15 (4), 170-181.
Bradley, R. S., Keiming, F. T., Diaz., H. F., 1992, Climatology of surface-based inversions in the North American Arctic, Journal of Geophys, 97, 699-712.
Hedayat, P., and Lashkari, H., 2006, Synoptic patterns analysis of Temperature inversion of Tehran, Journal of Geographical Research, No.56, pp. 65-82.
Hudson, S.R., and Brandt, R.E., 2005, A look at the surface-based temperature inversion on the Antractic Plateau, Journal of Climate, 18, 1673-1696.
Jahanbakhsh, S., and Roshani, R., 2013, Evaluation of the temperature inversion in Tabriz (2004-2008), Journal of Geographical Research, No.4, pp. 45-54.
Kahl, J.D., 1990, Characteristics of the Low-Level Temperature Inversion along the Alaskan Arctic Coast, International Journal of Climatology, Vol 10, 537-548.
Kahl, J. D., Serreze, M. C., Schnell, R. C., 1992, Low-level tropospheric temperature inversions in the Canadian Arctic, Atmos-Ocean, 30, 511-529.
Kaplan, L.D., 1959, Inference of atmospheric structure from remote radiation measurements, Journal of the Optical Society of America, 49, 1004.
Karimi, M., and Derakhshan, H., 2005, Evaluation of the temperature inversion in Isfahan, conference of Geophysic of IRAN, pp. 1-6.
King, J.I.F., 1956, The radiative heat transfer of planet earth. Scientific Use of Earth Satellites, University of Michigan Press, Ann Arbor, Michigan, 133-136.
Liu, Y., and Key, J., 2003, Detection and analysis of clear sky, low-level atmospheric temperature inversion with MODIS, J. Atoms. Oceanic Technol, No. 20, pp. 1727-1737.
Pourahmad, A., 1998, The role of climate and geographical structure in the pollution of the air of Tehran, Journal of Geographical Research, No. 34.
Rahimzadegan M., and Mobasheri M.R., 2010, An Attempt for Improving MODIS Atmospheric Temperature Profiles Products in Clear Sky, Meteorological Application, 10.1002/met.221.
Seemann, S.W., Borbas, E.E., Menzel, W.P., Gumley, L.E., 2006, Modis Atmospheric Profile Retrieval Algorithm Theoretical Basis Document, MOD07/MYD07 ATBD C005, Version 6.
Seemann, S.W., Li, J., Menzel, W.P., Gumley, L.E., 2003, Operational retrieval of atmospheric temperature, moisture, and ozone from MODIS infrared radiances, J. Appl. Meteor, 42, 1072-1091.
Walden, V.P., Mahesh, A., Warren, S.G., 1996, Comment on Recent changes in the North American Arctic boundary layer in winter, Journal of Geophys, 101, 7127-7134.