DEVELOPING A DECISION SUPPORT SYSTEM TO IDENTIFY STRATEGICALLY
LOCATED LAND FOR LAND REFORM IN SOUTH AFRICA
W. Musakwa a, *, E. N. Makonia, M. Kangetheb, L Segooac
a Dept. of Town and Regional Planning, University of Johannesburg, South Africa - [email protected]
a Dept. of Town and Regional Planning, University of Johannesburg, South [email protected]
b Agizo Solutions, Midrand, Johannesburg – [email protected]
cAgizo Solutions, Midrand, Johannesburg - [email protected]
KEY WORDS: Manuscripts, Proceedings, ISPRS Archives, ISPRS Annals, Guidelines for Authors, Styleguide
ABSTRACT:
Land reform is identified as a key tool in fostering development in South Africa. With two decades after the advent of democracy in South Africa, the land question remains a critical issue for policy makers. A number of frameworks have been put in place by the government to identify land which is strategically located for land reform. However, many of these frameworks are not well aligned
and have hampered the government’s land reform initiative in promoting inclusive development. Strategically located land is herein defined as land parcels that are well positioned for the promotion of agriculture, human settlements, rural and tourism development. Accordingly, there is a need to develop a decision tool which facilitates the identification of strategically located land for development. This study proposes the use of geographic information systems (GIS), earth observation (EO) data and multi-criteria decision making (MCDM) to develop a spatial decision support system (SDSS) to identify strategically located land for land reform. The SDDS was therefore designed using GIS, EO data and MCDM to create an index for identification of strategically located land. Expert-led workshops were carried out to ascertain criteria for identifying strategically located land and the analytical hierarchy process (AHP) was utilised used to weight the criteria. The study demonstrates that GIS and EO are invaluable tools in facilitating evidence-based decisions for land reform. However, there is need for capacity building on GIS and EO in government departments responsible for land reform and development planning. The study suggests that there is an urgent need to develop sector specific criteria for the identification of strategically located land for inclusive development.
* Corresponding author.
1. INTRODUCTION
1.1 Background
The land question in South Africa has its roots in the colonial and apartheid systems that saw the dispossession and alienation of black people from their land. Various legislative and spatial planning approaches were deployed by the colonial and apartheid regimes in the service of forcing black people off their land. With the advent of a democratically elected government in 1994, the Department of Rural Development and Land Reform (DRDLR) has accordingly sought to redress the resultant imbalances
The DRDLR is mandated by the Constitution of the Republic to coordinate and manage the land reform programme. Underpinning this objective is the salience of land reform in addressing the triple challenges of poverty, unemployment and inequality. As articulated in the 2014 State of the Nation Address, land reform continues to form part of the
post-apartheid government’s strategies for promoting spatial, social
and economic justice. Also tied to the land question are issues of redressing the injustices of the past; fostering national reconciliation and stability as well as creating conditions necessary for inclusive economic growth and improving household welfare and poverty alleviation (Republic of South Africa, 1997).
Indeed, considerable strides have been made by the government in addressing the legacy of skewed land ownership patterns but more needs to be done in a coordinated and objective manner, which this project will support. The strides made are expressed by President Jacob Zuma in his 2014 State of the Nation Address:
“Since 1994, nearly 5,000 farms, comprising 4.2 million
hectares, have been transferred to black people, benefiting over 200,000 families. Nearly 80,000 land claims, totalling 3.4 million hectares, have been settled and 1.8 million people have benefited”
The post-apartheid government has invested a considerable amount of intellectual, financial and human resources towards achieving its land reform targets. The government had spent about R20 billion since May 2009 on acquiring about 1.8 million hectares of land for restitution and redistribution purposes.1
Although there is huge investment in land reform, currently the government does not have a guideline or framework that clearly outlines what land is referred to as “strategically located”, the criteria for identifying for strategically located land and a tool used to identify strategically located land for agricultural land reform. Accordingly the aim of this study is to identify criteria used to develop a geospatial tool to support decision making. The criteria will be used to develop a composite indicator (index) coined the Strategically Located Land Index (SLLI) for land reform. The SLLI will be used as a pointer for decision makers as it reflects the status of land in terms of its suitability for land reform. It is important to note that the SLLI purpose is to serve as an aid to decision making and thinking not taking the decision.
1 http://www.citypress.co.za/politics/land-reform-laws-biased-jacob-zuma/
1.2 Solving complex spatial problems
Spatial planning professionals use a plethora of decision support tools to assist them in decision making (Brail, 2008) These tools are even more vital as planners attempt to solve complex problems such as suitability analysis and identifying land suitable for land reform. Often these complex problems are loosely defined and difficult to measure. Planners are therefore required to make decisions rationally, which implies an analytical, scientific approach is employed to support decision making as opposed to heuristic decision-making where decisions are made on an ad hoc basis with little or no formal analysis (Armstrong and Densham, 1990, Densham, 1991) (Armstrong et al., 1991, Densham and Rushton, 1991).
Various methodologies have been put forward to enable decision makers solve complex planning problems. These tools are even more useful 21st century were there are global problems such as climate change, sustainable development, urbanisation and land reform in the developing world. Decision consequence analyses (Hall 2010) and multi-criteria decision analysis MCDA (Malczewski 1999, 2006) are common frameworks used in solving these complex problems.
1.2.1 MCDA
MCDA involves a set of alternatives that are evaluated on the basis of conflicting and incommensurate criteria (Malczewski, 1999). Multi-criteria decision making implies a process of assigning values to alternatives that are evaluated along multi-criteria. Multi-criteria decision making can be divided into two broad classes of attribute decision making and multi-objective decision making. If the problem is to evaluate a finite feasible set of alternatives and to select the best one based on the scores of a set of attributes, it is a multi-attribute decision making problem. Conversely, multi-objective decision making deals with the selection of the best alternative based on a series of conflicting objectives (Phua and Minowa, 2005). MCDA can also be classified into single maker and group decision making problems. MCDA techniques can also be distinguished based on the by the level of cognitive processing demanded of the decision maker and the method of aggregating criterion scores and decision maker priorities.
Two cognitive classes of MCDA can be distinguished, namely compensatory, and non-compensatory. The compensatory approach is based on the assumption that the high performance of an alternative achieved on one or more criteria can compensate for weak performance of the same performance alternative on another criterion (Lasker et al., 2003). The compensatory method is quite demanding, as it requires specification of criteria weights. With the non-compensatory method another criterion high score cannot offset a low criterion score for an alternative. dependent on arbitrary definitions on what constitutes outranking therefore its potential for widespread public use is limited. On the other hand the fuzzy method is where fuzzy sets provide a basis for decision making
The analytical hierarchy process (Satty, 1980) is the most widely used MCDA approach because of it is flexible and easy to implement. The AHP is a linear weighted model that uses the
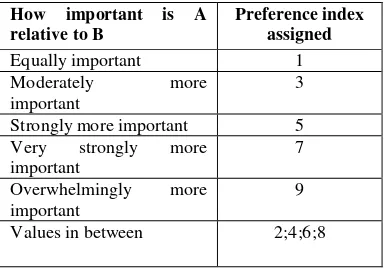
pairwise comparison method to decide on criteria weights. The pair wise matrix asks how important one particular criterion is relative to the other. Decision makers are asked to compare criterion based on a nine-point intensity scale shown below.
How important is A
Strongly more important 5 Very strongly more
Table 3. AHP weighting scale (Saaty 1980)
The intensity scale ranges from 1 to 9 as shown in Table 2 with 2, 4, 6 and 8 as intermediate values that can be used to represent shades of judgment between the five basic assessments.
1.2.2 GIS and MCDA
Conventional MCDA techniques are often non spatial and assume that the area under analysis is spatially uniform. Consequently this makes MCDA unsuitable for spatial analysis.
Despite MCDA’s potential to be integrated into solving planning problems related to spatial entities, multi-criteria decision making approach remained in operational research and management fields for a substantial period of time as decision support systems (Phua and Minowa, 2005). It is only recently
(last two decades 1990’s and 2000’s) as a result of improved technological capabilities that MCDA has tackled spatial problems.
Concerning the specific literature on MCDA, a Science Direct search returned 10 790 whereas when limited to GIS-MCDA 1 392 articles were found. Figure 1 depicts that there has been a significant increase in the GIS-MCDA articles published since 1990. This is as a result of advances in the field of GIS and MCDA which makes integration possible. Integration frameworks combine GIS capabilities of data acquisition, storage, retrieval, manipulation and analysis and the capabilities of MCDA techniques for aggregating geographical data
(spatial) data and the decision maker’s preferences into a one -dimensional value to make a decision. Combining MCDA and GIS techniques reduces the complexity in decision making because of numerous factors required in decision making. Effective multi-criteria decisions in solving complex problems such as land reform are only possible with input from GIS analysts, decision makers, and professionals in the spatial planning domain (Van Niekerk 2008).
Figure 1. GIS-MCDA journal articles since 1995
This integration facilitates decision making in complex spatial problems. Integration models are not without shortcomings; therefore, they cannot be applied universally to any spatial decision problem (Lidouh, 2012). Another challenge to integration arises due to the fact that when integrating two separate fields one not only gets the advantages of each of them, but also their inconveniences. Integration process is therefore looked at in the context of the synergetic capabilities of GIS and MCDA. This way one can see the benefit for advancing theoretical and applied research on GIS-MCDA (Malczewski, 2006).
Several integration models have been proposed, namely: (i) loose integration (ii) tight integration and (iii) full integration (Chakhar and Mousseau, 2008, Chakhar and Martel, 2003). Loose integration implies the integration of GIS software and a stand-alone MCDA software through the use of an intermediate system (Chakhar and Mousseau, 2008) whereas tight integration modedenotes adding a particular MCDA model directly to GIS software. With the tight integration mode a MCDA model constitutes an integrated but autonomous part with its own database. The use of the interface of the GIS part alone increases the interactivity of the system. Meanwhile the full integration mode has a fully GIS-MCDA integrated system that has a unique interface and a unique database. Here, the MCDA method is activated directly from the GIS interface, as any GIS basic function. The GIS database is extended so as to support both the geographical and descriptive data, on the one hand, and the parameters required for the multi-criteria evaluation techniques, on the other hand.
Integration of GIS and MCDA is common place as supported by literature (Eastman, 1999), (Heywood et al., 1995, Laaribi, 2000, Chakhar and Martel, 2003, Feick and Hall, 2004, Malczewski, 2006, Jankowski, 1995, Laaribi et al., 1996, Malczewski, 1999, Thill, 1999). Integration of GIS and MCDA has been largely possible because of three factors. Firstly, an increased recognition of decision analysis and support as an essential element of GIScience initiatives on Spatial Decision Support Systems (SDSS). Secondly, the availability of low-cost and easy-to-use MCDA software and mathematical programming technique and lastly, the proliferation of MCDA modules in such systems as IDRISI and ArcGIS (Eastman et al. 1995). IDRISI, is highly utilized in the United Nations and has a fully-fledged decision support module that was very instrumental for stimulating applied research in GIS-MCDA (Malczewski, 2006).
Since the start of the integration works, several options of GIS -MCDA systems have been proposed, of which out of those, very few have been widely practiced. This was because most of the GIS-MCDA systems where developed by researchers whose work did not filter to the public domain and applied research. As a result, the GIS-MCDA solutions that are available today are the ones that were supported by powerful commercial platforms or active communities such as IDRISI (Liouh, 2012). IDRISI is an example of a spatial solution tool that was the first to integrate SMART methodology for determination of weights using Saaty’s method. This development continued and currently IDRISI includes complete MCDA module with support for Ordered Weighted Average (OWA), MOLA heuristics and Analytical Hierarchy Process (AHP). Apart from the existing GIS-MCDA solutions, there are several tools libraries, and software parts that could be used to produce a working GIS-MCDA solution for specific purpose. Systems like Geographic Resources Analysis Support System (GRASS) GIS, ArcGIS, System for Automated Geoscientific Analyses (SAGA) GIS and others, have allowed users to develop modules or plug-ins to enhance functionalities for specific purpose.
1.3 Case studies
Automated land suitability assessments for agricultural purposes have their contemporary origins with FAO. FAO has defined processes of land suitability classifications through the appraisal and grouping of specific areas of land in terms of their suitability for defined uses (FAO 1976). Similarly, in literature, many studies have utilised GIS-MCDA in land suitability for agriculture. A study by (Feizizadeh and Blaschke, 2012), investigated the optimal utilisation of land resources for agricultural production in Tabriz County, Iran. In the same way Elsheik et al. (2013) developed an agriculture land suitability evaluator (ALSE) for subtropical crops. Meanwhile Xu and Zhang (2013) developed a land suitability evaluation (LSE) for wheat production. A common framework for land evaluation in agriculture is the change and land use evaluator (CLUE) Verburg et al. (2002). This framework has been adapted several times due to its utility (Britz, Verburg and Leip, 2011; Farrow and Winograd 2001; Van Niekerk 2008; Veldkamp and Fresco, 1995; Verburg et al. 1999; Zhang et al. 2013).
These studies on GIS-MCDA land suitability demonstrate that modelling land suitability are important tools to inform policy-makers to make consistent decisions as well as providing a framework for evaluation and accountability. Nonetheless, despite the usefulness of GIS-MCDA land suitability models, they are hardly used to inform policy makers in acquiring land suitable for land reform. To the best knowledge of the authors no GIS-MCDA studies and or tool that exists that has been explicitly developed to support and inform decisions regarding land reform. Accordingly, the aim of this study is to identify criteria and develop a GIS-MCDA tool used to inform acquiring strategically located land for land reform in South Africa.
2. METHODS
The land suitability assessment for identifying strategically located land was done using an adapted method from Bojorquez-Tapia et al. 2001 and Malczesweki 2006. Developing the tool was done in 4 tasks: (1) criteria identification and development of decision rules, (2) criteria weighting using the AHP (3) geodatabases development (4) land suitability assessment to identify strategically located land for land reform using GIS- MCDA.
2.1 Criteria identification
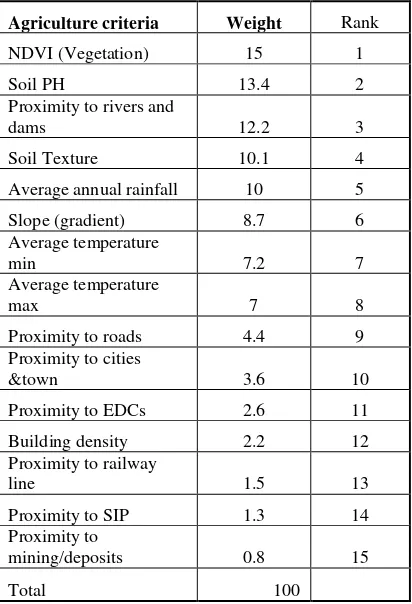
Criteria identification was carried out through participatory planning workshops. An initial workshop was conducted in September 2013, which consisted of professional experts in government departments, consultants, and policy makers. Most of these were officials from various sector departments such as Rural Development and Land Reform, Economic Development, Human settlements, Agriculture and Cooperative Governance. Selection of the criteria was guided mainly from national policy documents and legislation such as the National Development Plan. From this workshop criteria were group into seven broad themes namely proximity to economic development corridors (EDCs), proximity to strategic infrastructure projects (SIP) , proximity to agricultural infrastructure, linkages to social amenities and markets, land with unique resources features that provide a competitive advantage, land suitability for agriculture, vital infrastructure for social and economic development. These themes produced over 30 criteria, which would make it impossible and complex to develop a GIS tool. Accordingly, a core team was appointed to streamline the criteria. Literature and FAO guidelines were consulted extensively in criteria selection. Consequently, the number of criteria was kept as low as possible (15) (Table 3) to make a well-informed decision and reduce complexity and/or redundancy. Similarly, the criteria have to be logically sound and consistently relate to the objective and problem; realistic, transparent, simple and minimal.
Weighting of the criteria was done in a follow up workshop on April 2014 through a participatory process using the AHP process. The AHP was chosen because it the mostly widely used MCDA, it is flexible, easy to use, highly participatory, has been used vastly in literature and it is regarded as the best suitable method as it is straightforward and convenient (LIU et al., 2007). Workshop participants engaged in an Analytical Hierarchy Process (AHP) for weighting each criterion using a pair wise comparison matrix for the 15 criteria (Satty, 1980; Malczewski, 2006)). These participants were experts on land
reform such as planners, project managers, academics, NGO’s
and personnel from relevant government departments. The pair wise comparison matrix asks how important one criterion is relative to another based on a 1-9 scale (Table).
The workshop participants were given a template with 105 pairwise comparisons of the 15 criteria to complete. The template was computed using the software AHP calculator by Goepel (2014). Consequently, the AHP calculator software was used to create an overall weighting matrix by the participants. The pairwise matrix had a consistency ratio of 0.025 which implies that there were no logical inconsistencies in the matrix. The sum of the weight for all the criteria should add up to 1(one). Therefore, deriving the suitability (SLLI) will be a summation problem where �� total score of strategically located land for a land unit is calculated using the following equation.
�� = ∑ �� �
�=1 ��
Where �� of each criterion is calculated using AHP, �� represents value of each criterion based on corresponding standards and n is number of criterion. The SLLI index will range between 0 to 1 where 0 means land is not strategically located and 1 a land parcel is highly strategic for land reform
2.2 Mapping
Mapping is dived into two parts (1)data collection and geodatabase development and (2) using the model builder tool
in ArcGIS to develop the strategically located index for land reform. All processing was done using ArcGIS 10.2.
Data was collected from the national geospatial inspectorate and other government departments. This data was stored into a geodatabases, which was dived into themes, namely environmental/physical and socio-economic GIS layers. This data was projected to the Transverse Mercator projection. Rule-sets for each criterion were identified from literature (Batjes 1995; FAO 1976, FAO 2003; Van Niekerk 2008).
Agriculture
mining/deposits <100 km 100-200 km >200 km
Total 100
Table 4: criteria and rule sets
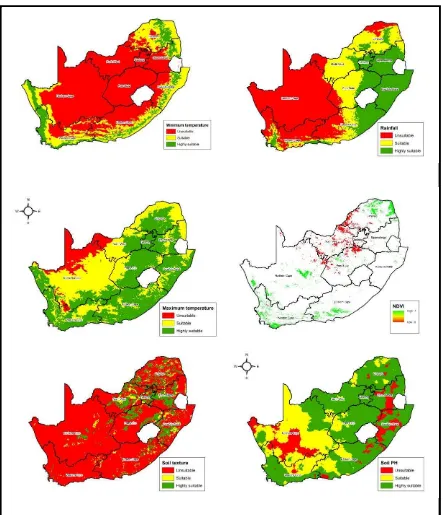
Accordingly, maps for each criterion were created a using suitability on a scale of -1 to 1 were 1 is highly suitable, 0 suitable and -1 unsuitable. From these maps equation 1 was utilised to compute the SLLI using a weighted linear combination. All this was automated using a python script from ArcGIS model builder tool and a cell size of 10 was utilised for consistency. This SLLI is to be deployed in a web map viewer developed by ESRI so that decision makers can make queries
2.3 Results and discussions
The outcome of the participatory workshops for the criteria and weight are shown in (Table 3). It emerges that, physical and environmental criteria such as vegetation, slope, soil, ph and rivers carry more weight as compared to socio-economic criteria such as proximity to strategic planned infrastructure. This is
2 The soil texture dataset already classified by Council for geosciences in terms of suitablity
also consistent with FAO guidelines and other scholars. Some participants intimated that there is a need to increase the number if criteria, however there was general consensus that the 15 criteria are feasible in developing the GIS tool. Moreover, the criteria were reduced to 15 from the initial 30 criteria to reduce redundancy. For example criteria concerning an areas unique renewable opportunity, are not considered critical in identifying land strategic for land reform. Similarly, criteria such as cellular and communications infrastructure are substituted by a proxy criterion such as roads, railways and proximity to major towns. In addition, other criteria such as protected areas were not considered as part of the MCDA as they require Boolean analysis to rule out. Such criteria are however included in the geodatabase as they can be utilised in supporting and querying decisions.
The workshop participants also found out that the criteria are broad as they are to be utilised for a national geospatial tool to identify strategically located land for land reform. However, it was established that there is potential to develop specific sub-criteria for various agricultural sectors such as fisheries, forestry, and livestock farming. A key theme that emerged was that the participants viewed the workshop as a platform for
future discussions amongst key stakeholders’. The workshop proceeded in three stages were there was initial resistance in filling out the template, however when the participants began engaging and completing the template they accepted and realised how useful the AHP participatory process is. Accordingly, the participants were excited in seeing the actual mapped criteria. Consequently participating government officials highlighted that development of the criteria and the geospatial tool to identify strategically located land would add immense value because it is an objective, coordinated and will support government developmental thrust. This is against a backdrop were currently there is no centralised tool which earmarks strategically located land for land reform.
Agriculture criteria Weight Rank
NDVI (Vegetation) 15 1
Soil PH 13.4 2
Proximity to rivers and
dams 12.2 3
Soil Texture 10.1 4
Average annual rainfall 10 5
Slope (gradient) 8.7 6
Figure 4: Selected criterion for agricultural suitability for South Africa
Figure 5 (below) the weighted overlay of all the criteria through the strategically located land index (SLLI) which ranges from 0-1 where 0 is a poor location and 0-1 highly strategic for land reform. The Northern Cape Province is largely unsuitable for agriculture with a SLLI close to 0 due to its high temperature, very low minimum temperature, sparse vegetation and low rainfall. Portions of the Western Cape and sections of the Eastern Cape have a high SLLI close to 1, hence they are suitable for cultivation. Similarly, KwaZulu-Natal, Mpumalanga, Gauteng, Limpopo, North West, the northern part of Free State and Limpopo provinces are suitable for agriculture because of a high SLLI score of above 0.6. The KwaZulu-Natal province is a strategic province for land reform because of
conducive climate and physical conditions. Moreover, KwaZulu Natal has a relatively large number of SIPS and EDCS such as the strategic freight development corridor and Maputo. development corridors in close proximity. Gauteng, Mpumalanga, North West and Limpopo provinces are largely strategic for land reform as a results of infrastructure, as well as favourable physical and climatic conditions such as soil texture and ph. In addition to the physical and environmental criteria the high SLLI of above 0.6 in most areas such as small sections of the largely uncondusive Northern Cape is also attributable to
the national government’s strategic infrastructure projects (SIPs) and economic development corridors (EDCs). EDC’s and
SIPs, are part of the NDP and they are supposed to stimulate agricultural development. .
Figure: Strategically located land index, South Africa
It is important to note the SLLI is a broad national analysis that shows general direction of where agricultural land reform should occur. Use of the SLLI facilities decisions making because policy makers can focus on the targeted areas and understand why it is strategically located and if it is not what can be done to improve suitability. The SLLI also provides a starting point for further analysis of various agricultural sectors and the same method which employs use of GIS, MCDA and AHP can be adapted to forestry, fishery, animal husbandry and horticulture.
2.4 Conclusions
Identifying strategically located land for land reform has been a challenge for the government. Without a tool to facilitate earmarking land strategically located for land reform, to date most land reform initiative have not been coordinated where at times land allocated was not suitable for agriculture. This goes against the NDP thrust of food security, poverty alleviation and a development.
Consequently developing the SLLI is an integral component as it assists policy to carryout-targeted land reform initiatives which are suitable for agriculture. The SLLI is an anchor instrument which demonstrates the utility of GIS-MCDA, AHP methodologies in solving complex spatial problems such as land reform. Development of the SLLI will facilitate channelling and streamlining of land reform initiatives in a coordinated manner. However, it is important to note that the SLLI is not a panacea to solving land reform. It is a bold initial step, which has opportunities for further development for specific agricultural sectors. Furthermore, with maturity and accumulation of more data, the SLLI will evolve to be a mature instrument which an essential cog for identifying strategically located land for land reform.
REFERENCES
Armstrong, M. P., & Densham, P.J., 1990. Database organization strategies for spatial decision support systems. International Journal of Geographical Information System, 4, pp 3-20.
Armstrong, M. P., Rushton, G., Honey, R., Dalziel, B. T., Lolonis, P., DE, S. & Densham, P. J. 1991. Decision support for regionalization: A spatial decision support system for regionalizing service delivery systems. Computers,
Environment and Urban Systems, 15, pp37-53.
Densham, P. J. 1991. Spatial decision support systems. Geographical information systems: Principles and applications, 1, pp 403-412.
Densham, P. J. & Rushton, G. 1991. Designing and implementing strategies for solving large location-allocation problems with heuristic methods, NCGIA.
Hall, G. B. & Leahy, M. G. 2006. Internet-based spatial decision support using open source tools. Collaborative
Geographic Information Systems, pp237-262.
Malczewski, J. 1999. GIS and multicriteria decision analysis, John Wiley & Sons.
Malczewski, J. 2006. GIS‐based multicriteria decision analysis: a survey of the literature. International Journal of Geographical
Information Science, pp 20, 703-726.
Malczewski, J., Chapman, T., Flegel, C., WalterS, D., Shrubsole, D. & Healy, M. A. 2003. GIS-multicriteria evaluation with ordered weighted averaging (OWA): case study of developing watershed management strategies. Environment
and Planning A, pp 35, 1769-1784.
ACKNOWLEDGEMENTS (OPTIONAL)
The Department of Rural Development and Land Reform.