Risk Mapping of Cutaneous Leishmaniasis via a Fuzzy C Means-based Neuro-Fuzzy
Inference System
P. Akhavan a, *, M. Karimi a, P. Pahlavani b
a Faculty of Geodesy and Geomatics Eng, K.N Toosi University of Technology, No.13446, Mirdamad Cross, Valiasr st., Tehran,
Iran; ([email protected], [email protected])
b Dept. of Surveying and Geomatics Eng., College of Eng., University of Tehran, Tehran, Iran; [email protected]
KEY WORDS: Cutaneous Leishmaniasis, Data Mining, Fuzz C Means Clustering, Neuro-Fuzzy Systems
ABSTRACT:
Finding pathogenic factors and how they are spread in the environment has become a global demand, recently. Cutaneous Leishmaniasis (CL) created by Leishmania is a special parasitic disease which can be passed on to human through phlebotomus of vector-born. Studies show that economic situation, cultural issues, as well as environmental and ecological conditions can affect the prevalence of this disease. In this study, Data Mining is utilized in order to predict CL prevalence rate and obtain a risk map. This case is based on effective environmental parameters on CL and a Fuzzy system was also used. Learning capacity of Neuro-Fuzzy systems in neural network on one hand and reasoning power of fuzzy systems on the other, make it very efficient to use. In this research, in order to predict CL prevalence rate, an adaptive Neuro-fuzzy inference system with fuzzy inference structure of fuzzy C Means clustering was applied to determine the initial membership functions. Regarding to high incidence of CL in Ilam province, counties of Ilam, Mehran, and Dehloran have been examined and evaluated. The CL prevalence rate was predicted in 2012 by providing effective environmental map and topography properties including temperature, moisture, annual, rainfall, vegetation and elevation. Results indicate that the model precision with fuzzy C Means clustering structure rises acceptable RMSE values of both training and checking data and support our analyses. Using the proposed data mining technology, the pattern of disease spatial distribution and vulnerable areas become identifiable and the map can be used by experts and decision makers of public health as a useful tool in management and optimal decision-making.
1. INTRODUCTION
Leishmaniasis is the third commonest vector-borne disease and a very important protozoan infection. It is transmitted through the sting of infected female sand flies, which mostly occurs on exposed skins and would be disfiguring and painful (Adegboye, 2012). Up to 350 million people are at risk in 88 countries worldwide. It is believed that approximately 12 million people are currently infected and 2 million new infections occur every year (Rodriguez, 2013) and (WHO, 2010). Cutaneous Leishmaniasis (CL) is a major public health problem in different parts of Iran and prevails in rural districts of 15 out of 31 provinces in Iran. The number of CL cases in this country during the period of 2001 to 2008 drastically rose from 11505 to 26824 (Mollalo, 2014). CL is an environmental disease since its transmission depends on the distribution and abundance of vectors and reservoirs which are sensitive to environmental factors. The identification of these factors could greatly help design prevention strategies due to the limited local resources (Bhunia, 2013), (Valderrama, 2010) and (Raymond, 2004). Public health management and disease control studies are important duties of health agencies, government and researchers to improve human health levels. Risk maps play a key role in public health and epidemiology (Demirel, 2009). Risk map is a map that highlights areas which are more susceptible and more suitable for breeding and maintenance of sand flies and reservoirs with high incidence rate.
Recent advances in the field of data mining have enabled researchers to model expansion of infectious disease based on environmental factors. In 2004, Raymond et al. (Raymond,
2004). designed a logistic regression model to predict the CL prevalence rate in Colombia. In 2010, Valdrama et al. (Valderrama, 2010). modeled CL in Colombia based on environmental factors using Poisson spatial regression method. Also, in 2012, Aliakbarpour et al. (Aliakbarpour, 2012) modeled CL in Fars province, Iran, based on the environmental and climatic factors.
3. The results are presented in section 4. Finally, Concluding remarks are discussed in section 5.
2. STUDY AREA AND DATA COLLECTION
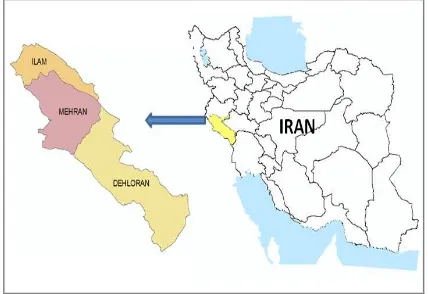
Regarding to high incidence of CL in Ilam province, counties of Ilam, Mehran and Dehloran have been investigated (Figure 1). Ilam province with the center of Ilam city is one of the 31 provinces of Iran and is located in the west of Iran, bordered by Iraq and cover an area of 19086 square kilometres (Kassiri, 2012). This province has eight counties including Ilam, Mehran, Dehloran, Darreh Shahr, Srableh, Eiven, Abdanan and Arkwaz. A mountain range begins at the north-west through the south-east of Ilam. The climate is relatively cold in the north and north-east, particularly in some hilly or mountainous areas. In the south (Dehloran and Mehran Districts); the summer is rather hot and dry. Because of the diverse climate in different areas, the population is usually unstable in some parts of the province (Javadian, 1997).
Figure 1.Ilam province and its counties in southwest Iran.
Data related to CL was received from the Infectious Diseases Management and Control Center. The data includes the number of patients in rural areas of Ilam, Mehran, and Dehloran from 2008 to 2012. To calculate the CL prevalence rate, the data concerning the population was obtained from the Statistical Center of Iran. CL prevalence rate for each village was
Weather properties such as temperature, relative humidity and rainfall from synoptic stations in this province and neighboring provinces over the years 2008 to 2012 were collected monthly form Meteorological Organization. As the disease carriers are more likely to grow in numbers in the warmer months, the average maps of temperature, humidity and rainfall for the six warm months (April to September) were considered.
NDVI is used to indicate green vegetation and was calculated via the red and near infra-red reflectance by a high resolution sensor on ETM+ satellite at a spatial resolution of 30m over the period 2008-2012.
3. ADAPTIVE NEURO FUZZY INFERENCE SYSTEM
Zadeh first introduced fuzzy logic and fuzzy sets theory in1965. Over the past 30 years, this theory became involved in complex problems of uncertainty and it appeared successful. Once the
fuzzy system is formed, the type of membership functions, determinacy of rules, the number of rules and parameter choice are generally decided by area of expertise knowledge and also by trial and error. This situation is the most outstanding difficultly in fuzzy system design. The reason why Neuro-Fuzzy systems, which is a blend of Fuzzy Logic and neural networks, have been used in solving complex problems lies in the fact that learning capacity of artificial neural networks can help to overcome the cited challenge of fuzzy system design. A special approach in Neuro-fuzzy development is the adaptive Neuro fuzzy inference system (ANFIS) which indicates significant results in modeling nonlinear functions. The ANFIS determines the membership degree of input /output variables by using ANNs learning capacity. By means of ANNs learrning, the most important problem of fuzzy methods is eliminated; also it comes through high the feature of reasoning and decision making of fuzzy logic approach (Uguz, 2012).
Iterative adjustment of parameters of the adaptive Neuro-Fuzzy inference system through a hybrid learning procedure in order to predict CL prevalence rate forms the main part of the training. The ANFIS architecture is shown in Figure (2), and the system has a total of five layers. Layer 1 has the input variables with membership function for this purpose the Gaussian membership function is used. T-norm operator that perform the AND operator is used in layer 2. Nodes in layer 3 are fixed and calculate the ratio of the firing strengths of the rules. The nodes in layer 4 are adaptive and perform the consequent of the rules. Single node computes the overall output in layer 5 (Senthil, 2012).
Figure2.The architecture of ANFIS
The learning algorithm for ANFIS is a hybrid algorithm, which is a combination of gradient decent and the least-squares methods. To be specific, in the forward path of the hybrid learning algorithm node outputs move forward up to layer 4 and consequent parameters are determined by the least square method. In the backward path, the error signals propagate backwards through the network and premise parameters are adjusted by gradient decent (Jang, 1997).
rules for the fuzzy inference structure of CL prevalence modeling.
3.1 Fuzzy C-Means Clustering
Clustering is a process of discovering similarity and homogeneous clusters within a dataset. In most cases, a cluster is represented by a cluster center, which will then be used to form the membership shape. Any given data point can belong to different clusters with a specified degree of belongingness indicated by membership grades between 0 and 1 and this is how FCM makes use of fuzzy partitioning. The membership matrix U can hold arrays between 0 and 1 to introduce fuzzy partitioning. The FCM algorithm is based on minimization of the following objective function (Jang, 1997) and (Moertini, 2002):
Where uij varies between 0 and 1; ci is the cluster center of fuzzy group i, dij=||ci-xi|| is the Euclidean distance between ith cluster center and jth data point; and m is a weighing exponent. The cluster centres can also be first initialized and then the iterative procedure carried out. Yet there is no guarantee that FCM converges to an optimum solution (Moertini, 2002).
The FCM method requires the user to specify the number of clusters; seven clusters have been chosen in this research. In addition, the number of clusters chosen also represents the number of rules generated for the model, i.e. seven rules. The maximum number of epochs was set to 300.
4. RESULTS
Before using the ANFIS system to predict the prevalence rate in 2012, membership function parameter values and fuzzy rules, where first specified in an iterative and variable exchange procedure during the training stage, are derived. Outbreak rate of CL in villages of Ilam province in the period between 2008 and 2011, the average temperature, humidity, altitude and the type of vegetation of the area in the same period were utilized. Then raster images for each of aforementioned factors for the year 2012 were entered to the system and prevalence rate for 2012 was then predicted.
To have a system with high prediction capability, it is crucial for the training and evaluation stages to perform using different sets of data. To achieve this goal, these three steps have been designed: (1) clustering of input/output data (2) using the influential factors on the disease and prevalence rate as the output for 2008-2011 for the training stage (3) running ANFIS to predict CL prevalence rate and creating the risk map. Data pertaining to years 2008-2011, which constitute 70% of total data, are used for training the model and the remaining 30% of the data which pertained to 2012 were used for further evaluation. In clustering algorithm, the total amount of data was partitioned into different clusters. Subsequently, membership functions of each factor are formed based on the proximity of data. As mentioned before, the Gaussian-shaped membership function is provisioned to fuzzificate the input data. By using
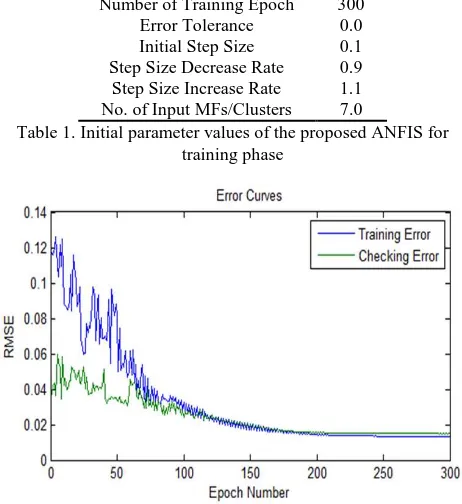
training and checking data were obtained as shown in the Figure (4).
Table 1. Initial parameter values of the proposed ANFIS for training phase
Figure 4. RMSE for training and test data
CL prevalence rate in 2012 that the aforementioned model predict in evaluation stage is depicted in Figure (5).
Figure 5. CL prevalence rate in 2012
Figure 6. Predicted risk map of Ilam in 2012
5. CONCLUSION
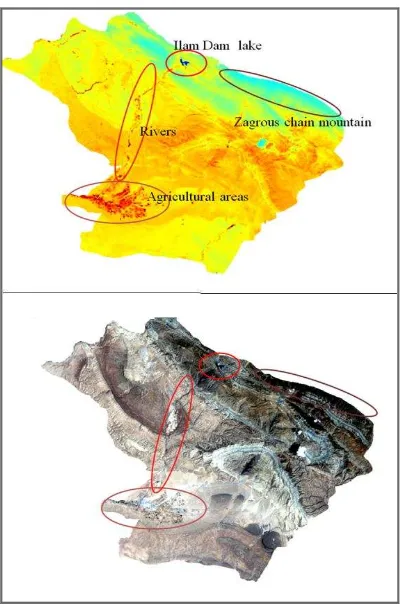
By comparing the risk map of Dehloran city with its satellite image in Figure (7), it is observed that regions in altitude of above approximately 1000 meters are considered as the safe regions. Additionally, Dam Lake was predicted as a safe region. While humidity is essential in areas where sand flies lay eggs, the excess humidity causes the larvae to migrate from that region.
Figure 7. Compariton of risk map of Mehran with it's Satellite Image
The goal of this modeling is to help managers control CL prevalence and use the model to predict CL prevalence rate in the counties of Ilam province for the upcoming years. Our
research confirms the capabilities of Neuro-Fuzzy models in prediction and modeling of CL prevalence rate. The obtained risk map shows that parts of Mehran and Dehloran located in lower regions and had high temperatures are suitable places for the outbreak of this disease. On the other hand, North and Northwest parts of Ilam considered mountainous are predicted as less dangerous regions. In short, during the course of this research, the following point was deduced and proposed. By examining previous studies and the required environmental factors for the disease carrier sand flies growth, the main and available parameters were selected. What is certain for producing vulnerability map, other influential factors are involved as well. In the proposed model of this research, a new factor can be easily entered to this model with little changes in model’s structure.
REFERENCES
Adegboye O.A., and Danelle K., 2012. Disease Mapping of Leishmaniasis Outbreak in Afghanistan: spatial hierarchical Bayesian analysis, Asian Pacific Journal of Tropical Disease. pp: 253–259.
Aliakbarpour M., Mohammadbeigi A., and S.H. Tabatabaee, 2012. Spatial Analysis of Eco-Environmental Risk Factors of Cutaneous Leishmaniasis in Southern Iran , Journal of Cutaneous and Aesthetic Surgery. Vol: 5, no: 1, pp: 30-36.
Bhunia G.S., Kesari S., Jeyaram A., Kumar V., and P. Das, 2013. The Burden of Visceral Leishmaniasis in India: Challenges in Using Remote Sensing and GIS to Understand and Control, Hindawi Publishing Corporation, ISRN Infectious Diseases. Vol: 2013, pp: 1–14.
Geneva, World Health Organization, 2010, Control of the Leishmaniasis,http://www.who.int/neglected_diseases/integrat ed_media_leishmaniasis/en/.
Demirel, R. and Erdoghan S, 2009. Determination of High Risk Regions of Cutaneous Leishmaniasis in Turkey Using Spatial Analysis, Turkish Society for Parasitology. pp.8-14.
Haykin S., 1998. Neural Networks: A Comprehensive Foundation. Prentice-Hall, second edition.
Jang S., Sun T. and Mizutani E, 1997. Neuro-Fuzzy and Soft Computing: A Computational Approach to Learning and Machine intelligence. Prentice Hall, Inc.
Javadian E., Jalali-Galousang A., and Seyedi-Rshti M.A., 1997. Sandflies of Ilam Province, West of Iran with Description of Two New Species from the Genus Phlebotomus: PH. Ilami and PH. Nadimi, Iranian Journal of Public Health. Vol: 26, pp: 13–20.
Kassiri H., Sharifinia N., Jalilian M., and Shemshad K., 2012. Epidemiological Aspects of Cutaneous Leishmaniasis in Ilam Province, West of Iran (2000-2007), Asian Pacific Journal of Tropical Disease. pp: S382–S386.
Moertini V.S., 2002. Introduction to Five Data Clustering Algorithms, Integral. Vol: 7, pp: 87–96.
of the Relation Between Vegetation cover and Incidence of Cutaneous Leishmaniasis in an Endemic Province, Northeast of Iran, Asian Pacific Journal of Tropical Disease. pp: 176– 180.
Raymond J.K., Diarmid H.C., and R.D. Davies, 2004. Predicting Geographic Variation in Cutaneous Leishmaniasis, Colombia Medicine Tropical. Vol: 4, no: 2, pp: 10-14.
Rodriguez E.M., Diaz F., and Perez M.V, 2013. Spatio-Temporal Clustering of American Cutaneous Leishmaniasis in a Rural Municipality of Venezuela, Epidemics. pp: 11–19.
Senthil Kumar A.V., 2012. Diagnosis of Heart Disease using Fuzzy Resolution Mechanism, Journal of Artificial Intelligence. Vol: 5, pp: 47–55.
Sikchi, S.S, Sikchi, S., and Ali, M.S, 2013. Design of Fuzzy Expert System for Diagnosis of Cardiac Disease, International Journal of Medical Science and Public Health. Vol: 2, pp: 56-61.
Uguz H., 2012. Adaptive Neuro-Fuzzy Inference System for Diagnosis of the Heart Valve Disease using Wavelet Transform with Entropy, Neural Computing and applications. Vol: 21, pp: 1617–1628