STATIC AND DYNAMIC BEHAVIOUR ASSESSMENT OF THE TRAJAN ARCH
BY MEANS OF NEW MONITORING TECHNOLOGIES
L. Petti a*, F. Barone b, A. Mammone a, G. Giordanob
a DICIV, Department of Civil Engineering, University of Salerno, 84084 Fisciano SA, Italy - (petti, amammone)@unisa.it b Department of Medicine and Surgery, University of Salerno, 84084 Fisciano SA, Italy - (fbarone, gerardogiordano)@unisa.it
Commission II
KEYWORDS: Monument preservation; Monolithic Folded Pendulum; Distributed monitoring system; Structural dynamic analysis
ABSTRACT:
An effective assessment of the static and dynamic structural behavior of historical monuments requires the development and validation of suitable adaptive structural models using high-quality experimental data acquired with an effectively continuous and distributed monitoring. Furthermore, the adaptive strategy allows an efficient evaluation of the health status and of the evolution along the time of a historical monument, providing relevant information to plan appropriate actions for its long-term preservation. The Trajan Arch in Benevento chosen as a case of study to develop and apply this new adaptive strategy in cultural heritage conservation. The paper, after a description of the innovative monitoring system, based on state-of-the-art mechanical sensors, presents and discusses the results of two tests, comparing the measurements with the predictions of an adaptive structural FEM model developed for the dynamical simulation of the Trajan Arch.
1. INTRODUCTION
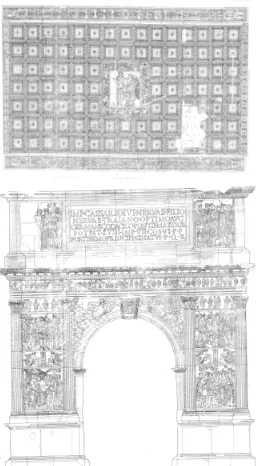
One of the most important and well-preserved monuments of the Roman Empire is the Trajan Arch in Benevento. In its two thousand years of history, it suffered many damages due to important events, such as earthquakes, wars, and, last but not least, partial rec1onstructions, and restorations Figures 1-2. Such significant structural changes interested the monument in different periods, most of them on its top section, the Attic, probably already during or just after its construction.
Figure 1. East Façade and The Fornice (bottom view) – Architectural Survey. Soprintendenza Archeologica delle
Province di Salerno, Avellino e Benevento, 1998.
* Corresponding author
The historical value of the Trajan Arch and its preservation for future generations requires, therefore, a dedicated program of conservation actions and safeguarding measures, planned and optimized along the time (Nichols, 2003), (M. Petzet, 2004), (Tortorella et al., 2011) and (Ribera at al., 2015). Furthermore, it is critical to acquire an adequate knowledge of its present health status and information on its evolution over the years. This knowledge can be obtained with an optimized design and implementation of a continuous and distributed monitoring of all its essential structural elements in connection with a careful analysis based on an adaptive structural FEM (Finite Element Method) dynamic model of the arch.
Figure 2. The view of the Trajan Arc
With this process it is possible to achieve information both on the dynamic and static loads sources (seismic noise, anthropic noise, wind noise, etc.) which affect the monument and on the effects on its sculptures and structural elements, such as to provide reliable description and clarification of the existing damage patterns, like the ones in the Fornice.
The International Archives of the Photogrammetry, Remote Sensing and Spatial Information Sciences, Volume XLII-2/W5, 2017 26th International CIPA Symposium 2017, 28 August–01 September 2017, Ottawa, Canada
1.1 Seismic History of Benevento
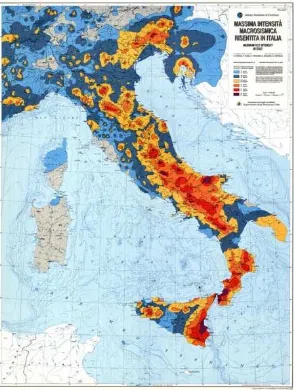
The area in which the Trajan Arch has been erected is subjected to strongest and high seismic events. The most dangerous ones happened along the Apennines that are crossed by the Mediterranean fault earthquake which represents the plate boundaries between the African plaque and the Euro-African one Figure 3. These movements have surely affected the territory of Benevento and the structural changes implemented on the arch.
Figure 3. Map of Maximum Macroseismic Intensity observed, the database Macroseismic DBMI11 Italian INGV
Over the years too many were the seismic events occurred in this area that can be defined as the cause of some interventions made on the arch, and that led to some changes to it. The highest catastrophic events registered in the last 2000 years, have been characterized by an intensity of the site "Is" equal to 8 MCS and they are:
Seismic event 99 AC, in Circello; Seismic event 375 AC, in Benevento;
The city was destroyed. At that time Benevento was an important cultural and artistic center. Most of its inhabitants died. All the 15 towers and the famous buildings and temples crashed down. So its citizens cared for the rebuilding without any public financing as Simmaco’s letter to his father testified.
Seismic event 989 AC, in Irpinia;
The earthquake caused the fall of many buildings in Benevento and 15 towers; Again some people testify this earthquake as in “Gli Annales Beneventani”, Leone Ostiene and “The Chronicon” by Romualdo Salernitano.
Seismic event 1456 AC, in Molise;
This earthquake has affected the city of Benevento, Naples, L’Aquila, just to quote some of the most famous towns of South of Italy. However, the damages were huge all over this area as written in some of the letters sent by ambassadors living in the Neapolitan court found in the state archives. Seismic event 1688 AC, in Sannio;
In Benevento 997 buildings over 1607 were destroyed; 285 had no damage, 325 had cracks, 1367 people died. Churches were badly damaged such as Santa Sofia’s in which the Medieval adjuncts, the central dome, and the Romanesque bell tower collapsed. The only evidence of this has been found in chirographs by Innocenzo XI and Alessandro VIII. Seismic event 1702 AC, in Benevento, Irpinia;
There were huge damages in the city of Benevento which interested the lower part of the city. The quakes of the 2nd
and of the 6th April caused crashes and cracks at some buildings in the city. 159 people died over 8400. Many new and old buildings crashed, too. The pope sent some technicians to evaluate the damages and to allow extraordinary loans by the city’s bishop. All is testified in letters between the vice- governor of Benevento and the secretary of the papal state.
This such of earthquakes, as shown by Petti et al. (2015), are characterized by strong directivity effect, Petti et al. (2012).
2. THE MONITORING SYSTEM
The monitoring system implemented for the Trajan Arch in Benevento is an application of a general adaptive assessment strategy that originates from an innovative monitoring approach based on state-of-the-art broadband high sensitivity mechanical sensors.
This strategy requires the implementation and optimization of a numerical finite element model (FEM) describing the dynamical behaviour of the Trajan Arch on the basis of measurements obtained with an adaptive monitoring system, that acquires data from sensors, whose typology, position and number is defined on the basis of the obtained results. (Barone et al., 2015/1).
The final goal of this strategy is that of understanding the dynamical behavior of the Trajan Arch to assess its health status and to foresee its dynamical evolution along the years, necessary for the definition of suitable interventions aimed to its preservation.
For the above-quoted reasons, the monitoring system architecture implemented for Trajan Arch is fully modular: the acquisition system is able to integrate sensors, whose number, position, typology (displacement, acceleration, environmental variables like wind speed and direction, temperature, etc.) and characteristics (weights, dimensions, band, sensitivity, etc.) are defined and/or changed on the basis of the experimental results and of the numerical simulations. Furthermore, the data acquisition system ensures wireless connectivity, very low power consumption, fault tolerance and unattended working. For this task, the standard module is based on real-time Compact-RIOs 16 bits DAQ board by National InstrumentsTM, that fully satisfies the above-quoted requirements. The main sensors (displacement and/or acceleration sensors) belong, instead, to the UNISA class of folded pendulum mechanical sensors, an innovative class of broadband high sensitive mechanical sensors developed at the University of Salerno by the Applied Physics Research Group. These sensors, briefly described in the following section, are characterized by large bands, high sensitivities (especially in the low-frequency region), dimensions and weights that fully satisfy all the requirements on data accuracy and quality for the Trajan Arch, (Barone et al., 2015/2-3). Furthermore, their large band in the low-frequency region (a yet unexplored band) allow the possibility to study the effects of many relevant noise sources, that may damage the monument in the long term. Typical examples are the daily and seasonal temperature changes, which may induce relatively large displacements among different sections of the Trajan Arch, or daily anthropic noise (e.g. car traffic).
2.1 UNISA Folded Pendulum
The UNISA Folded pendulum is a mechanical oscillator of remarkable properties, able to resonate at very low frequency, still keeping compact size and weight, (Barone, 2011; 2012; 2015/1-2), (Acernese et al., 2008; 2010/1-2; 2012; 2015). In fact, taking advantage of the peculiar coupling of the local gravitational acceleration with the folded pendulum mechanics, (Barone et al., 2008) and of the modern machining technologies and techniques (e.g. precision milling ad electro-discharge machining (EDM)), it is possible to design compact, light and stable mechanical oscillators, an effective basis for the implementation of high quality and high sensitivity mechanical seismometers and/or accelerometers, characterized by very low natural resonance frequencies (< 100 mHz), that allow large measurement bands (10−7 Hz – 103 Hz) and sensitivities (<10−12 m/Hz1/2) also in the low frequency region of the seismic spectrum, still keeping light weight (< 200 g), small size (< 10 cm side) and large immunity to environmental noises, at low cost.
Figure 4. Uniaxial monolithic UNISA Folded Pendulum (Model GE15)
Moreover, their mechanical transfer function, and in particular, their natural resonance frequency, can be changed by applying external forces or by introducing calibration masses or suitable external forces, changing, in this way, also their sensitivity curve, (Barone, 2011; 2012; 2015/1-2), (Acernese et al., 2008; 2010/1-2; 2012; 2015).
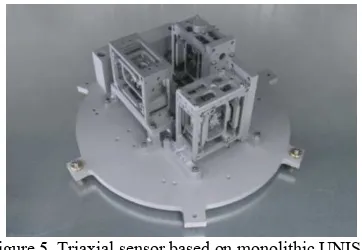
Figure 5. Triaxial sensor based on monolithic UNISA Folded Pendulum
Figure 4 shows the mechanics of the Model GE15, a medium size (8 cm side, 0.3 kg weight) UNISA uniaxial monolithic folded pendulum seismometer for low-frequency large band measurements used for the test on the Trajan Arch. This sensor is implemented in Ergal (AL7075-T6), anodized for long-term environmental applications and designed to host the most common readouts (shadow meters, optical levers, LVDTs, fiber channels, interferometers). Figure 5. shows, instead, a triaxial sensor obtained with three monolithic UNISA Folded Pendulums (Model GE15) oriented along the three Cartesian axes (x, y, z), allowing the implementation of an efficient and stable tridimensional measurement point.
Characteristic Properties Band 0.1 uHz < B < 1 kHz Sensitivity 10-15 m/Hzm/Hz1/2 < S < 101/2 -6
Directivity D > 104
Reson. Frequency 50 mHz < f0 < 1 kHz Table 1. UNISA Folded Pendulum Main Characteristics
Finally, Table 1 summarizes some of the main characteristics of typical mechanical sensors based on the UNISA Folded Pendulum architecture. An important advantage of using UNISA folded pendulum monolithic mechanical sensors is that, at least for applications on the Earth surface, their sensitivity and band of this class of sensors are not limited by intrinsic mechanical noises (e.g. thermal noise), but by the noises introduced by the readout and data acquisition system. (Barone et al., 2008). Therefore, in the case of Trajan Arch the best choice of the mechanics, of the readout and the data acquisition system is a real compromise among performances, cost, stability along time and, last but not least, power consumption (solar power supply). It is important to underline that the total power consumption of the monitoring system (power consumption of the sensors electronic interfaces, of the acquisition boards, of the local data storage and of the data transmission devices positioned on the Attic) is probably one of the most important constraints for the design and implementation of a reliable and effective monitoring system. To minimize power consumption and to guarantee enough dynamics to the sensor, the readout system is based on commercial LVDTs that still guarantee enough sensitivity (≈ 10-9 m/Hz1/2). Of course, UNISA mechanical seismometers with better/or worse sensitivities can be designed using different readouts (shadow meters, fiber bundle, LVDT, capacitive, etc.), whose choice depends on the requirements of the specific application (e.g. sensitivity, band, robustness, weight, dimensions, environmental noise, cost, etc.), and tuned to different resonance frequencies (e.g. by changing the position of a calibration mass).
Figure 6. Sensitivity curves of the UNISA Horizontal Folded Pendulum mechanical sensors equipped with an Optical Lever, an LVDT and a Michelson Interferometer
readouts and tuned at different resonance frequencies, compared with the Peterson Low Noise Model, with the
McNamara Noise Model and with two commercial sensors: STS-2 by Streckeisen and Trillium-240 by
Nanometrics.
Just for the sake of comparison in Figure 6 the designed theoretical sensitivity of the UNISA Folded Pendulum sensor
The International Archives of the Photogrammetry, Remote Sensing and Spatial Information Sciences, Volume XLII-2/W5, 2017 26th International CIPA Symposium 2017, 28 August–01 September 2017, Ottawa, Canada
with commercial LVDT readout, compared with the typical theoretical sensitivities and bands of UNISA Folded Pendulum sensors equipped with an optical lever and interferometric readouts are shown. In the same figure, the sensitivity curves of the STS-2 (Streckeisen Nakayama et al., 2004) and of the Trillium-240 by Nanometrics, representing the state-of-the-art of ground-based low-frequency seismic sensors, are reported for comparison, together with the Peterson New Low Noise Model (NLNM). (Berger et al., 2005) and the McNamara and Bouland Noise Model, (McNamara et al., 2004), that represents the minimum measured Earth noise evaluated from a collection of seismic data from several sites located around the world: noise levels below this are never - or extremely rarely – observed.
2.2 The Measurements
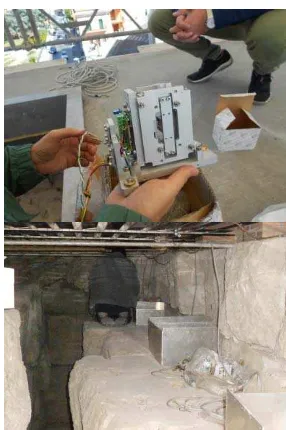
Figure 7. Accelerometers position.
Two tests were performed on the top of the Trajan Arch with a limited number of sensors: the first one in July 2015 (few hours) necessary for the definition of the requirements that sensors and monitoring system have to satisfy and the second one in late September 2015 (4 days) performing a simultaneous acquisition of 4 sensors, necessary to understand the optimal placement of the sensors and of the data acquisition system on the Attic. The measurement was also performed at the base of the Arch to understand the noise floor level, to correlate the measurements of the sensors on the top of the Arch.
Figure 8. Displacement spectral density of selected measurement points on the top of Trajan Arch (I test).
These measurements highlighted the need of an effective and continuous monitoring also of wind speed and direction. In
fact, the effect of the wind and car traffic is very relevant for the dynamic behavior of the Trajan Arch. The first test was performed during a windy day in Benevento. Figure 8 shows the displacement spectral density of three sensors positioned on the top of the Arch (the first two sensors on the Arch center, the third one on the corner) in the band [100 mHz – 100 Hz]. It is evident the strong effect of the wind on the whole band, in particular in the central part of the Arch.
Figure 9. Displacement spectral density of the central transverse measurement point on the top of Trajan Arch
(II test).
The second test was longer (4 days), with the very low wind. In Figure 9 the central transverse measurement point is shown for comparison, but on a larger band (10 mHz – 100 Hz). The sensitivity of the sensor (10-9 m/sqrt(Hz) ) is the one predicted by the theoretical model.
Figure 10. Installation of accelerometers, on the Attic of Trajan Arc
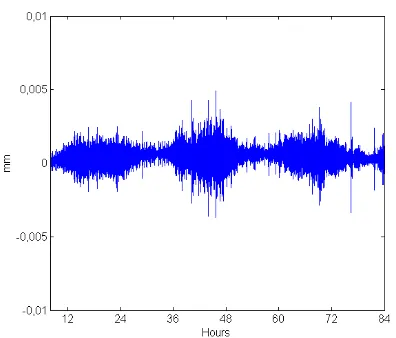
Figure 11.Displacement time course of the lateral transverse measurement the point on the top of Trajan Arch
(II test)
3. FEM MODEL DESCRIPTION
Within the study process of the Arch has been used a linear model Figure 12, such as the “SAP2000 Advanced v17.3.0” software developed by CSI (Computers and Structures Inc.) Berkeley.
Travertino building block
Marble Lunense building blocks
Building block in opus caementicum
Thick limestone building blocks
Figure 12. Macro-elements subdivision of the Arch, with breakdown by material
The FEM model involves the use of solid macro-elements, able to describe three-dimensional stress states. The Arch has been divided into several FEM macro-elements and subsequently automatically discretized by an appropriate meshing which allowed to carry out more refined analysis in section variations. The model has been fixed at the base of the Arch with constraints because the dynamic response recorded was modest. The macro-elements that describe the
blocks groups of limestone have been modeled assuming an equivalent compact section as described in Figure 12. These macro-elements have been meshed assuming a reference of 0,40m as the maximum length. The particular shape of the attic form by an internal and an external parameter, so the FEM system realized until now has been refined with the splitting of the last top block as shown in the picture.
Thanks to several types of research throughout the world about triumphal arches built in the history, the model has been enforced by further improvements. It has been found a close relationship between the Triumphal Arch and the Trajan one in Rome. The similarity between the two arches is either in the architectonic shape or the dimensions. It has been possible to make these assumptions according to the information acquired from the Arch of Tito as regards the material used to build the Trajan Arch.
Materials (kN/mWeight 3)
Modulus of Elasticity E
(GPa) Travertine building
block 24,00 8,50
Marble Lunense
building blocks 28,17 10,00 Building block in opus
caementicum 19,00 4,00
Thick limestone
building blocks 26,00 10,00 Table 2. Mechanical properties adopted for the reference
FEM model
As for materials, it is thought that the building blocks basis of the Trajan Arch were made of travertine marble while the pylons, in their central nucleus, were made of ‘opus caementicium’ concrete plated with building blocks of Lunense marble whereas the inside cover of the attic was made of thick limestone blocks. Thus the FEM pattern has further been refined. The mechanical properties of the reference FEM model have been researched by adaptive recursive analysis, having considered for the first model the mechanical properties as described in the report of the prof. Salvatore D'Agostino (1991), who wrote also “.It is constituted by a core wall in limestone boulders covered with marble slabs lunense…”.
The results of the adaptive recursive analysis have been leaded at the end to the following equivalent mechanical parameters for each considered materials Table 2.
The International Archives of the Photogrammetry, Remote Sensing and Spatial Information Sciences, Volume XLII-2/W5, 2017 26th International CIPA Symposium 2017, 28 August–01 September 2017, Ottawa, Canada
4. ASSESMENT PROCEDURE AND RESULT The reference FEM model has been obtained by varying the elastic properties of the materials using an adaptive recursive procedure. The Tables 3 and 4 describe the main modal analysis results carried out in the first and the last steps.
Material Modulus of Young
Travertino building block 40.0 GPa
Marble Lunense building blocks 50.0 GPa Building block in opus caementicum 8.0 GPa Thick limestone building blocks 50.0 GPa
Modes Frequency [Hz] Period [s]
1st 9.28 0.107
2nd 14.85 0.067
3rd 17.80 0.056
4th 24.01 0.041
5 th 24.54 0.040
6 th 35.27 0.028
Table 3. Modal analysis results, Case 1
Material Modulus of Young
Travertino building block 8.5 GPa
Marble Lunense building blocks 10.0 GPa Building block in opus caementicum 4.0 GPa Thick limestone building blocks 10.0 GPa
Modes Frequency [Hz] Period [s]
1st 4.33 0.230
2nd 7.14 0.140
3rd 8.38 0.119
4th 10.76 0.092
5 th 10.98 0.091
6 th 15.97 0.062
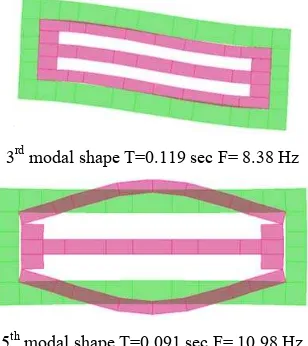
Table 4. Modal analysis results, Reference Case The first three modal shapes respectively show transversal, longitudinal and rotation motion of the top side. The upper
modal shapes involve deformations in the walls of the Attic.In Fig.13 the 3rd and 5th are described as examples
3rd modal shape T=0.119 sec F= 8.38 Hz
5th modal shape T=0.091 sec F= 10.98 Hz Figure 13. Modal Shapes
Table 5 describes the activated displacement components in correspondence of the recording stations for each investigated modal shape.
Table 5 – Modal shapes displacement components External Zone Internal Zone
Modes Shift X Shift Y Rotation
Shift X Shift Y Rotation
1° - point all - - all point -
2° point all - - point all - -
3° - - all point - - all point
4° - - - - middle point -
5° - - - - middle point -
6° - - - - middle point -
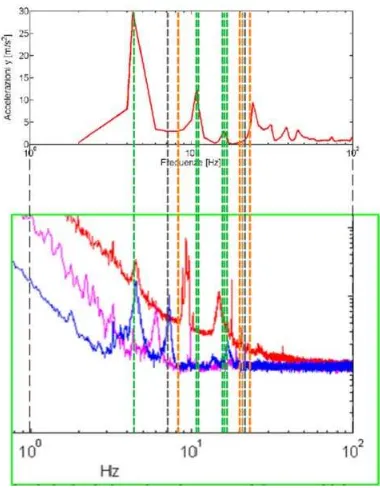
Figure 14 describes the comparison between the evaluated main modal periods (frequencies) and the Fourier Spectrum of the recorded signals of the first FEM model.
Figure 14. Comparison between numerical and signals data analyses Case 1
recorded signals results and the numerical ones. The Fourier Spectrum also shows a peak on the central recorded signal around 9 Hz that could not be explained by the linear analysis carried out. The following observations could be explained by considering local behavior due to the original composition of the external walls in correspondence of the Arch. Finally, it is interesting to observe that equivalent Young modulus is considerably lower of that describing the blocks material.
Figure 15. Comparison between numerical and signals data analyses. Reference Case
Similar results have been obtained through the steady-state analysis, which relates the dynamic response in the frequency domain of a reference point to the loads. The case study has been investigating by considering the following load patterns:
Ground acceleration in the transverse direction y of the arch;
Ground acceleration in the longitudinal direction x of the arch;
The load applied in the transverse direction over the entire facade, due to the wind.
For each load, the steady state analysis has been carried out considering the frequencies range 0-100 Hz and the step of 2 Hz, investigating the transversal and longitudinal acceleration of the corner and central nodes of the arch. Figures 16 and 17 describe the comparison between the amplification functions carried out by the FEM models and the frequency responses obtained from the on field tests in the center node.
5. CONCLUSION
The purpose of this study described a dynamic behavior of a monumental construction by using an adaptive recursive procedure. This innovative monitoring system, which is based on the state-of-the-art of mechanical sensors, is profitable both in deep analysis of complex structural systems and in the monitoring of the evolution of static behavior over time.
The presented results, obtained by comparing a reference FEM model behavior with the on-site recorded signals, shown the best agreement and demonstrate the effectiveness of the adaptive procedure to assess complex structures like the monumental one.
Figures 16. Amplification function comparison for longitudinal and transversal direction-central node
Figures 17. Amplification function comparison for longitudinal and transversal direction-central node
REFERENCES
D.E. McNamara and R.P. Buland, “Ambient Noise Levels in the Continental United States”, Bull. Seism. Soc. Am., 94, 1517-1527 (2004).
E.Tortorella, I. Marino, M. N. Khanlou, U. Dorka, L. Petti, “Seismic response control of rigid block systems by using tendon system: The case of Greek columns”. Joint Conf. Seismic Protection of Cultural Heritage Pag.149-161,WCCE-ECCE- TCCE, 2011.
The International Archives of the Photogrammetry, Remote Sensing and Spatial Information Sciences, Volume XLII-2/W5, 2017 26th International CIPA Symposium 2017, 28 August–01 September 2017, Ottawa, Canada
F. Acernese, G. Giordano, R. Romano, R. De Rosa, F. Barone, “Tunable Mechanical monolithic sensor with an interferometric readout for low-frequency seismic noise measurement”, Nucl. Instrum. and Meth. A 617 (2010/1) 457-458.
F. Acernese, R. De Rosa, F. Garufi, G. Giordano, R. Romano, F. Barone, “Tunable Mechanical monolithic horizontal sensor with high Q for low-frequency seismic noise measurement”, Journal. of Phys. Conf. Series 228 (2010/2) 0120351.
F. Acernese, R. De Rosa, G. Giordano, R. Romano, F. Barone, “Low frequency seismic characterization of underground sites with tunable mechanical monolithic sensors”, Proc. SPIE 9435, SPIE, Bellingham, 94352Q, ISBN: 9781628415384, doi: 10.1117/12.2083362 (2015).
F. Acernese, R. De Rosa, G. Giordano, R. Romano, F. Barone, “Mechanical monolithic horizontal sensor for low frequency seismic noise measurement”, Rev. Sci. Instrum., 79 (2008) 074501.
F. Acernese, R. De Rosa, G. Giordano, R. Romano, S. Vilasi, F. Barone, ”Low Frequency-High Sensitivity Horizontal Inertial Sensor-based on Folded Pendulum”, Journal. Phys. Conf. Series 339 (2012) 012001.
F. Barone, G. Giordano, “Low frequency folded pendulum with high mechanical quality factor, and seismic sensor utilizing such a folded pendulum”, (PCT), WO 2011/004413 A3 (2011), Patent Numbers: IT 1394612, EP 2452169, JP 5409912, RU 2518587, AU 2010269796, US 8,950,263, Canada pending.
F. Barone, G. Giordano, “Mechanical Accelerometers”, J. Webster (ed.), Wiley Encyclopedia of Electrical and Electronics Engineering. John Wiley & Sons, Inc., doi: 10.1002/047134608X.W8280 (2015/2).
F. Barone, G. Giordano, F. Acernese, “Low frequency folded pendulum with high mechanical quality factor in vertical configuration, and vertical seismic sensor utilizing such a folded pendulum”, (PCT), WO 2012/147112 (2012), Patent Number: IT 1405600, AU 2012247104, Europe, Japan, Russia, USA, Canada pending.
F. Barone, G. Giordano, F. Acernese, and R. Romano “Watt’s linkage based large band low frequency sensors for scientific applications”, Nucl. Instrum. and Meth. A, doi: 10.1016/j.nima.2015.11.015 (2015/3).
F. Barone, R. De Feo, G. Giordano, A. Mammone, L. Petti, L. Tomay, “A new strategy of monitoring in cultural heritage preservation: the Trajan Arch as a case of study”, Proc. of the First International Conference on Metrology for Archeology, Benevento (Italy), 21-23 October, ISBN:15:978-88-940453-3-8, p.333-338 (2015/1).
F. Ribera, L. Petti, G. Miccio, A. Landi, A. Lodato “Risk Analysis of Historic Urban Areas: A Case Study of the Salerno City, Italy”, pp.1099-1106 in Journal of Civil Engineering and Architecture, Volume 9, Number 9, September 2015 ISSN 1934-7359.
http://www.nanometrics.ca/products/trillium-240.
J. Berger and P. Davis, “2005 IRIS 5-Year Proposal”, 38 (2005).
J. Nichols, M. Todd, M. Seaver, & L. Virgin, Use of chaotic excitation and attractor property analysis in structural health monitoring, Physical Review E, APS, 2003; 67:016209. L. Petti, A. Lodato. “Analisi della Domanda Sismica del Terremoto di L’Aquila 09’ ”, paper n.2212, XVI Convegno ANIDIS “L’Ingegneria Sismica in Italia”, 13-17 Settembre 2015 L’Aquila ISBN 978-88-940985-6-3.
L. Petti, I. Marino. “Innovative procedures to assess seismic behaviour of existing structures by means of non linear static analysis: polar spectrum and capacity domains ”, Buildings, ISSN 2075-5309, doi:10.3390/buildings2030271, pp. 271-282, n.3,2012.
M. Petzet, “Principles of Preservation. An Introduction to Int. Charters for Cons. and Restor. 40 Years after the Venice Charter”, ICOMOS, München, pp.7-29.ISBN 3-87490-676-0, 2004.
SAP 2000 Computers and Structures, Inc., Berkeley, California, USA.